


All Issues
Precision agriculture can increase profits and limit environmental impacts
Publication Information
California Agriculture 54(4):66-71. https://doi.org/10.3733/ca.v054n04p66
Published July 01, 2000
PDF | Citation | Permissions
Abstract
Precision agriculture is the management of an agricultural crop at a spatial scale smaller than the individual field. Mineral nutrient levels, soil texture and chemistry, moisture content and pest patterns may all vary widely from location to location. At its most fundamental level, precision agriculture is based on information management, and is made possible by a confluence of new technological developments. It provides the opportunity to increase profitability and reduce the environmental effects of farming by more closely matching the application of inputs such as pesticides and fertilizers with actual conditions in specific parts of the field. We demonstrated precision agriculture technology in a wheat field in Winters, and the farmer changed several of his management practices as a result. Adoption of this technology is limited in California at the beginning of the 21st century, but is likely to increase as growers come to appreciate the economic benefits it can provide.
Full text
Precision agriculture, also called site-specific management (SSM), is the management of an agricultural crop at a spatial scale smaller than the individual field. In many fields, the crop's environment varies substantially from one part to another. Mineral nutrient levels, soil texture and chemistry, moisture content and pest patterns may all vary from location to location. By adjusting management practices and input levels according to what is appropriate for local conditions, the farmer can in principle save money, improve yields and reduce unwanted environmental effects.
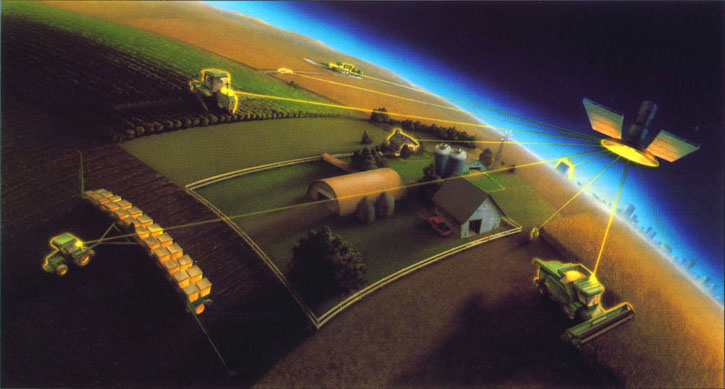
The wired farm.
The initial development of precision agriculture methodology took place during the late 1980s in the corn/soybean/wheat production systems of the Midwest. For a variety of reasons, research into this technology did not begin in California until the mid-1990s. A number of factors, however, make California production systems well suited for SSM. The relatively high value per acre of many California crops encourages investment in the specialized equipment associated with precision agriculture. Also, the fully irrigated nature of many California production systems gives the grower a relatively high level of control over the crop's environment, permitting adjustments to match variations in growing conditions. Finally, the generally cloud-free skies during the summer growing season make California particularly well suited for remote sensing, often an integral component of precision agriculture.
At its most fundamental level, precision agriculture is information management. To effectively manage a field on a site-specific basis, the farmer must be able to measure variations in yield in order to determine whether intensive management is economically justified. The farmer must also be able to measure variations in factors that influence yield and identify the factors underlying yield variability in each specific field and season. Finally, means must exist to use this information to implement changes in management practices that increase profitability or reduce environmental impacts.
The introduction of SSM practices into crop production was made possible by the confluence of a number of information-management technologies. These include yield monitoring, remote sensing, geographic information systems (GIS), global positioning systems (GPS) and variable-rate application technology. Most of these technologies were developed in other industries and adapted for crop production, in effect putting the technology ahead of the science. Currently existing technology is sufficient to support adoption of SSM practices in those crops for which reliable yield monitors already exist, such as grains, cotton, tomatoes and potatoes. Whether or not these practices are actually adopted will depend on development of the capability to interpret site-specific data and act on that information to increase profitability.
Yield-mapping technologies
The primary technological advance that made precision agriculture feasible is the yield map, which enables the farmer to estimate crop yields for sections as small as a few square yards and to display the collection of these estimates in color-coded maps. Any area can be mapped. Typical fields are about 150 acres. Growers can identify high- and low-yielding regions of the field and precisely quantify the differences between them. Yield mapping is based on three basic technologies: yield monitors, GPS and GIS.
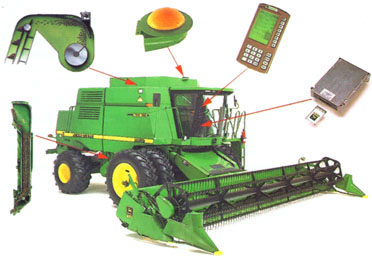
Components of a combine-mounted yield-monitoring system. Clockwise from left, Motion sensor, yield monitor, global positioning system, yield-monitor display and data-recording device. Photo composite courtesy of John Deere Company.
Yield monitor.
A yield monitor is a device that periodically (generally about once per second) measures the mass or flow rate of harvested material, and based on this measurement computes an estimate of crop yield. In a combine harvester, the estimate is obtained by measuring the force of the grain against a plate.
GPS.
The global positioning system, or GPS, uses triangulation of signals from a constellation of satellites to identify the location of the GPS on the Earth's surface, generally within about 1 yard. A fully functional yield-monitoring system includes a GPS that tags each yield estimate with the current location in the field so the data can be matched with the location. These data are stored in a file that can be downloaded after harvest.

A yield monitor-equipped combine harvests a corn field.
GIS.
A geographic information system, or GIS, is a computer program that combines database-management systems with graphics. It can accept data from an assigned location and generate a thematic map showing the spatial distribution of the data. Data from a yield monitor is downloaded into a GIS and converted into a colorcoded yield map that displays yield levels throughout the field. A typical yield monitor includes a data card to transfer files from a personal computer. The typical yield map shows high-yield areas in green and low-yield areas in red (fig. 1).
We demonstrated state-of-the-art precision agriculture technology in a 70-acre wheat field located in Winters, near Davis. The result was a series of interpretive maps that the grower then used to adjust fertilizer and crop distribution during the 1997 growing season. The research was a joint project of UC Davis scientists and Precision Farming Enterprises, a Davis-based consulting firm.
Additional information sources
Soil sampling.
If the yield map reveals substantial variability at different places in the field, as is the case in figure 1, additional information is needed to determine why. Intensive soil samples are a valuable, albeit expensive, source of information. In this procedure, soil samples are collected at a large number of points across the field (typically an average of one per acre or two), analyzed and statistically interpolated to provide an estimate of the soil's physical and chemical properties at every point in the field.
Because of the great expense associated with this process, other sources of information such as remote-sensing data and soil electrical-conductivity measurements are often used to stratify the field for purposes of improving the statistical efficiency of soil sampling, as well as to supplement or replace the soil samples themselves. In the Winters field, we took a soil sample per acre. Figure 2 shows an interpolated map of the field's clay content, revealing a large area of high clay content in its northern area. Therefore, the low yield in the field's northern portion (fig. 1) can be associated with high moisture or poor drainage.
Remote sensing.
Remote sensing is a less expensive source of information than soil monitoring, which can also estimate crop vegetation status. At present, the most common form of remote sensing is via electromagnetic radiation, which is detected by a sensor mounted in an airplane or satellite (also called passive sensing systems). Electromagnetic radiation is classified by wavelength. The wavelengths currently most widely used for agricultural applications are visible light, near infrared and thermal infrared. Plants and soil reflect visible light and near-infrared radiation in relative proportions that provide information about the extent and health of vegetation. Thermal-infrared radiation is emitted from plants at wavelengths dependent on their temperature. Because plants suffering from water or other stress tend to have higher temperatures, the wavelength of thermal-infrared radiation indicates the plant's stress level.
Figure 3 shows a sequence of false-color infrared aerial photographs for the same Winters field. False color infrared shows infrared radiation as red, red light as green and green light as blue. The first was taken in December 1995, shortly after planting, and shows the bare soil following a heavy rainfall (fig. 3a). The darker areas are wetter and correspond to the heavy clay with lower infiltration rate. The second was taken in March 1996 at the soft-dough stage, when the wheat grains were immature (fig. 3b). The brighter red areas in the southern end of the field indicate healthy vegetation, while the grayer areas in the northern portion indicate less vigorous vegetation and a less dense canopy, presumably caused by aeration stress. The third image was taken in May 1996, just prior to harvest (fig. 3c). Some of the brighter red areas in this figure correspond to weedy patches.
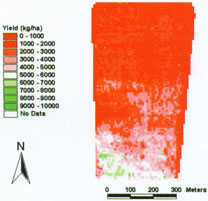
Fig. 1. Color-coded yield map from a wheat field in Winters. The highest-yielding areas are shown in green, the lower-yielding areas in red.
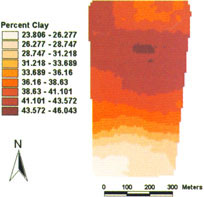
Fig. 2. Interpolated map of clay content for the Winters field. The large area of high clay content indicates that low yield in this field may have been caused by aeration stress due to poor drainage.
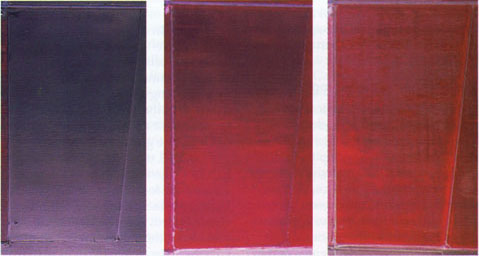
Fig. 3. Sequence of false-color infrared aerial photographs of the Winters field. Left (a), The bare-soil field in December 1995. Middle (b), The crop at soft-dough stage in March 1996. Right (c), The mature crop in May 1996.
Electrical-conductivity measurement.
A second relatively inexpensive source of field information is electrical-conductivity measurement. Soil electrical conductivity can be measured either directly or through measurement of electrical inductance. In either case, the machine measures the strength of electric currents passed through the soil. Measurements are generally correlated with soil salinity, water content, soil density, topsoil depth and clay content. Figure 4 uses colors to show soil electrical conductivity in the Winters wheat field. In this low-salinity soil, electrical conductivity is related to clay content.
Additional data can be obtained from scouting of insect, weed and pathogen infestations. In field scouting, a trained person walks through the field to evaluate weed levels. Figure 5 shows high weed-infestation areas in the field. This map was developed based on a combination of scouting on a one per acre grid and interpretation of the May 1996 aerial photo (fig. 3c).
Variable-rate technology.
Maps of data from soil analyses, remote sensing and direct measurements of electrical conductivity and pest and pathogen levels can be combined with yield-map data in the GIS to determine the primary factors underlying yield variability. If these factors can be determined and the decision is made to vary the application rates of pesticides and fertilizers across the field, variable-rate technology (VRT) application equipment can be utilized.
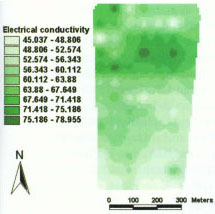
Fig. 4. Soil electrical-conductivity map of the Winters field. These data are interpolated from inductance measurements recorded on an electrical-inductance meter and units are based on meter values.
This equipment typically contains an on-board GPS to determine precise locations in the field, as well as adjustable-rate application devices. These may be either manually adjusted by the operator or equipped with an on-board computer that adjusts the rate automatically. VRT closes the loop between acquiring the data, converting the data into information, and acting on the information to make maximum use of underexploited areas of the field and reduce wasted inputs in low-potential areas.
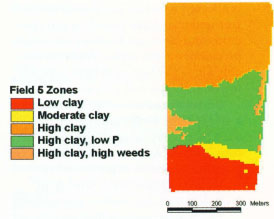
Figure 6 shows the field subdivided into zones, based on the principal yield-limiting factors as determined by analysis of the collected data (Plant et al. 1999). Based on the information provided in this figure, the cooperating grower carried out two modifications to his management practices; he changed his fertilization program to increase available phosphorous and broke off the southern portion of the field to grow a higher-value vegetable crop. The grower is also exploring the economics of installing drain tiles in the field's northern section to improve drainage.
In the long run, the primary restriction on adoption of precision agriculture technology is not likely to be cost but rather the ability of the farmer or consultant to make effective use of it to increase profits.
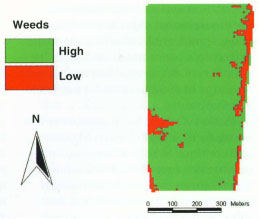
Fig. 5. Weed-level map for the Winters field. Levels were determined by scouting on a one-per-acre grid.
Environmental, regulatory issues
In California, agriculture is regulated by several state and federal agencies. In 1990, California was the first state in the nation to require 100% reporting of all pesticides applied and to compile and publish an annual database of the amounts of all chemicals used in agriculture. New agricultural chemicals must be registered with the U.S. Environmental Protection Agency as well as the California Department of Pesticide Regulation. The intent of California's strict compliance program for pesticides is to reduce non-point-source water pollution related to agriculture.
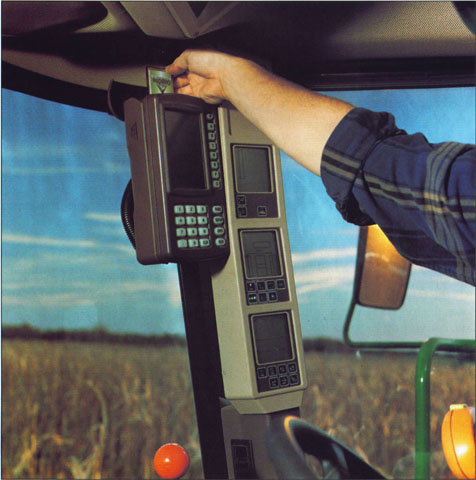
Inside the combine's cab, the operator utilizes a data card to transfer data from the monitor to the computer.
U.S. EPA is conducting studies in several watersheds to determine mechanisms to reduce non-point-source pollution. One possible solution would be to regulate fertilizer inputs so that the agricultural producer is allowed a certain number of fertilizer units per farm, based on soil type, crops and location. To maximize farm productivity, the inputs could be variably spread across each field depending on soil type and future crops.
Current regulations do not mandate a site-specific fertilization plan, but such plans may be specified in the future. If such plans are mandated, growers will need to more closely match input application rates with crop demands and reduce unnecessary applications to areas where no economic benefits are achieved.
In California, water is a critical resource in the arid valleys. Over many decades, state and federal agencies have created an enormous reservoir system to satisfy California's agriculture industry. Agriculture's allocation of approximately 75% to 80% of California's stored water must compete with the state's growing urban population and a renewed interest in the environment. Agriculture has taken significant strides to understand each crop's water needs and, with the adoption of drip irrigation, to alter water usage in most permanent tree and vine crops.
However, most field crops have not successfully adopted drip irrigation and continue to rely on furrow, flood or sprinkler irrigation. Precision irrigation methods such as drip irrigation are becoming more economical for some crops. SSM will play a crucial role in reducing the water consumption of major field crops and possibly will allow more water for nonagricultural uses. The widespread adoption of SSM will depend on technological improvements, water costs and availability, and improved understanding of the interaction between soil properties and the water needs of crops.
Adoption of precision agriculture
Precision agriculture is in the early adoption stage; the technology is commercially available but not yet widely used. The technology is currently most advanced in combine-harvested grain crops. In 1998, an estimated 17,000 combines in the United States were equipped with yield monitors (Anonymous 1998). However, this accounted for only 8% of major U.S. crops and 5% of farmers with gross annual incomes above $100,000.
Cochrane (1993) introduced the concept of the “technological treadmill” to characterize the spread of innovations in agriculture. According to this theory, market pressure drives commodity prices toward the minimum average cost of production. Early adopters of a technology that increases profitability will benefit during the period when prices still reflect the production costs of those who have not adopted it. As more farmers either adopt the technology or are driven out of business, the average cost is driven down to that of users of the new technology. Early adopters may be motivated by reasons other than economics (for example, curiosity or willingness to speculate on innovation), but the ultimate widespread adoption of a technology depends on its ability to increase profitability.
At the national level, studies on the profitability of precision agriculture have been inconclusive (Lowenberg-DeBoer and Swinton 1997). In part this is because its benefits are often hard to isolate and quantify. SSM has both tangible and intangible associated costs. Tangible costs include equipment, such as the yield monitor, GPS and GIS, and services, such as remote sensing, soil profiling and data management. Intangible costs, such as the time and effort required to learn a new concept like SSM and make it a seamless part of the overall farming operation, are more difficult to quantify.
Because precision agriculture involves the use of information, its profitability can be increased by making the information cheaper and easier to acquire and by increasing the effectiveness of the information once it is acquired. A well-established characteristic of information technology is that costs are reduced dramatically as the technology matures. In the long run, the primary restriction on adoption of precision agriculture technology is not likely to be cost but rather the ability of the farmer or consultant to make effective use of it to increase profits. Experience with other information technologies indicates that some time is required for users to learn how to employ these technologies effectively.
Eventually, it is likely that, as they have with other new technologies, growers will adapt the information technologies to their production systems.
By the mid-21st century something akin to the scenario illustrated in Figure 7 is likely to be in place on farms throughout California. Planting, fertilization, pest treatment and harvesting will all be connected to centralized data-recording and control systems. Because one of the key technological bottlenecks in precision agriculture at the moment is the cost of crop and soil information, sensor technology must be dramatically improved. We can expect to see implement-mounted sensors that use spectrography to detect soil properties such as mineral nutrient concentration, salinity and sodicity. Similarly, detailed analysis of the electromagnetic spectrum reflected and emitted by plants will be used to interpret water status, pest pressure and nutrient level. Preliminary research is currently under way, and will certainly have reached fruition by midcentury, to genetically engineer plants that provide a direct indication of their status through changes in their reflectance or emittance properties.
Future in focus: Site-specific management
We cannot say with any certainty that the scenario just described will ever come to pass, or that any aspect of precision agriculture will survive the early adoption process and achieve widespread use. It is likely, however, that some aspects will indeed be adopted. The cost of newly introduced information technologies has historically declined dramatically as these technologies matured. This is likely to happen with the technologies associated with precision agriculture, particularly yield monitors, sensors and GPS.
Likewise, the value of the information is likely to increase as farmers become more familiar with it. Nowak (1997) distinguishes between “soft” and “hard” precision agriculture technologies. “Soft” technologies rely more on traditional means of acquiring site-specific information (for example, visual observation of crop and soil differences) and on farmer intuition rather than statistical or scientific analysis of data. Because the cost of the information is likely to decline, farmers are likely to increasingly rely on “hard” technology to acquire information. On the other hand, if history is any guide, farmers are more likely to rely on “soft” technology to interpret map data. However, “hard” devices such as on-the-go weed-control systems based on the automated detection of weeds through video imaging may also come into widespread use.
Several critical issues will come into play with the adoption of precision agriculture:
▪ Size-neutrality.
Many of the technological advancements associated with agricultural mechanization have favored large farms, resulting in a trend toward farm consolidation. Because SSM may increase the efficiency of large-scale crop production, it is reasonable to suppose that it may have the same effect.
▪ Farm jobs.
In general, the incorporation of information technology in industry has tended to expand the market for skilled employees and reduce the number of semiskilled and unskilled jobs. In agriculture, one may expect SSM to increase the demand for skilled individuals who can manage and interpret the information. This increase in skilled positions may be associated with a corresponding decrease in the number of available unskilled positions.
▪ Unintended side effects.
Regulatory agencies may require site-specific management plans to reduce the environmental impacts of agricultural inputs. This information may influence the price of land in the way that laser leveling of fields does now. It is possible that farmers' ability to more precisely measure variability and discern cause and effect will encourage on-farm experimentation, changing the relationship of farmer and university researcher by making the farmer a part of the entire research program rather than a passive recipient of information.
Finally, precision agriculture may have other uses that are totally unanticipated by those conducting research on the technology today. A fundamental role of UC researchers will be to adapt novel information technologies to improve productivity and reduce environmental effects of crop production.
Precision agriculture can increase profits and limit environmental impacts

