


All Issues
Forest biomass diversion in the Sierra Nevada: Energy, economics and emissions
Publication Information
California Agriculture 69(3):142-149. https://doi.org/10.3733/ca.v069n03p142
Published online July 01, 2015
NALT Keywords
Abstract
As an alternative to open pile burning, use of forest wastes from fuel hazard reduction projects at Blodgett Forest Research Station for electricity production was shown to produce energy and emission benefits: energy (diesel fuel) expended for processing and transport was 2.5% of the biomass fuel (energy equivalent); based on measurements from a large pile burn, air emissions reductions were 98%-99% for PM2.5, CO (carbon monoxide), NMOC (nonmethane organic compounds), CH4 (methane) and BC (black carbon), and 20% for NOx and CO2-equivalent greenhouse gases. Due to transport challenges and delays, delivered cost was $70 per bone dry ton (BDT) — comprised of collection and processing ($34/BDT) and transport ($36/BDT) for 79 miles one way— which exceeded the biomass plant gate price of $45/BDT. Under typical conditions, the break-even haul distance would be approximately 30 miles one way, with a collection and processing cost of $30/BDT and a transport cost of $16/BDT. Revenue generated from monetization of the reductions in air emissions has the potential to make forest fuel reduction projects more economically viable.
Full text
Large regions of Sierra Nevada mixed conifer forests are in need of hazardous fuels reduction treatments to reduce the risk of high severity wildfire and return forests to fire-resilient conditions. Whether as a complement or replacement to prescribed burning, it is highly desirable to increase the pace and scale of these treatments (North 2012; North et al. 2012). Significant quantities of woody biomass wastes are the unavoidable byproduct of these treatments.
Open pile burning in the forest is most commonly used to dispose of woody biomass waste, as fire hazard reduction objectives prevent leaving the material in-field to decompose, and because in many cases it is the most economically viable option. While woody biomass wastes represent a significant renewable energy resource, the cost to process and transport the material for use as fuel to produce electricity (or use for other value-added bioproducts such as biochar, biofuels, polymer precursors or thermal energy) often well-exceeds the combined value at the biomass electricity generation plant, the avoided cost to pile burn, and the potential value of nutrients returned to the soil (which is low due to the localized and limited pile burn location). A significant drawback of open pile burning is that it generates emissions of criteria air pollutants (particulate matter, carbon monoxide, volatile organic compounds and nitrogen oxides), greenhouse gases (GHGs) and air toxics such as polycyclic aromatic hydrocarbons and aldehydes.
The Placer County Air Pollution Control District sponsored — in cooperation with the UC Berkeley Center for Forestry, United States Forest Service (USFS) Rocky Mountain Research Station Missoula Fire Lab, and UC Davis Biological and Agricultural Engineering — a case study to quantify the energy, air quality and GHG benefits, as well as the economics, of utilizing woody biomass wastes generated at Blodgett Forest Research Station (BFRS) for renewable energy at the Buena Vista Biomass Power (BVBP) facility as an alternative to the status quo of open pile burning.
Contractor CTL Forest Management Inc. loads a chip van with woody biomass waste from the Yeti Fuels Reduction Project in the Lake Tahoe Basin Management Unit, Kings Beach, CA. A case study at Blodgett Forest Research Station quantified the air quality and energy benefits of converting biomass waste to electricity as an alternative to open pile burning in the forest.
Turning a waste into a resource
The UC Berkeley Center for Forestry manages BFRS, located east of Georgetown, California. Our research project targeted woody biomass waste piles (slash) from hazardous fuels reduction and timber operations at BFRS that included tree tops, limbs and small trees. The piles were generated from thinning treatments in mixed conifer plantations during the summer of 2012. The treatment objectives were to reduce fire hazard, increase average tree vigor and increase species diversity. Operations were typical of those in the Sierra Nevada, where young and dense forests have developed following wildfires or even-aged harvests. Plantations were thinned to an average of 110 trees per acre from pre-treatment stocking levels of 222 trees per acre. Four plantations were thinned, covering a total of approximately 80 acres. Because smaller trees were preferred for removal, average stem diameter (for residual trees) at breast height (DBH) increased from 11.9 to 13.1 inches. Sawlogs greater than 6 inches diameter on the small end and at least 10 feet long were transported to a sawmill for processing into lumber products. Unmerchantable trees (too small to process into sawlogs) plus the limbs and tops of merchantable trees were piled at roadside landings for disposal by open burning. The overall size of the piles generated were typical of thinning operations in young and mature forests, with bulk volume averaging 63,000 ft3 per pile.
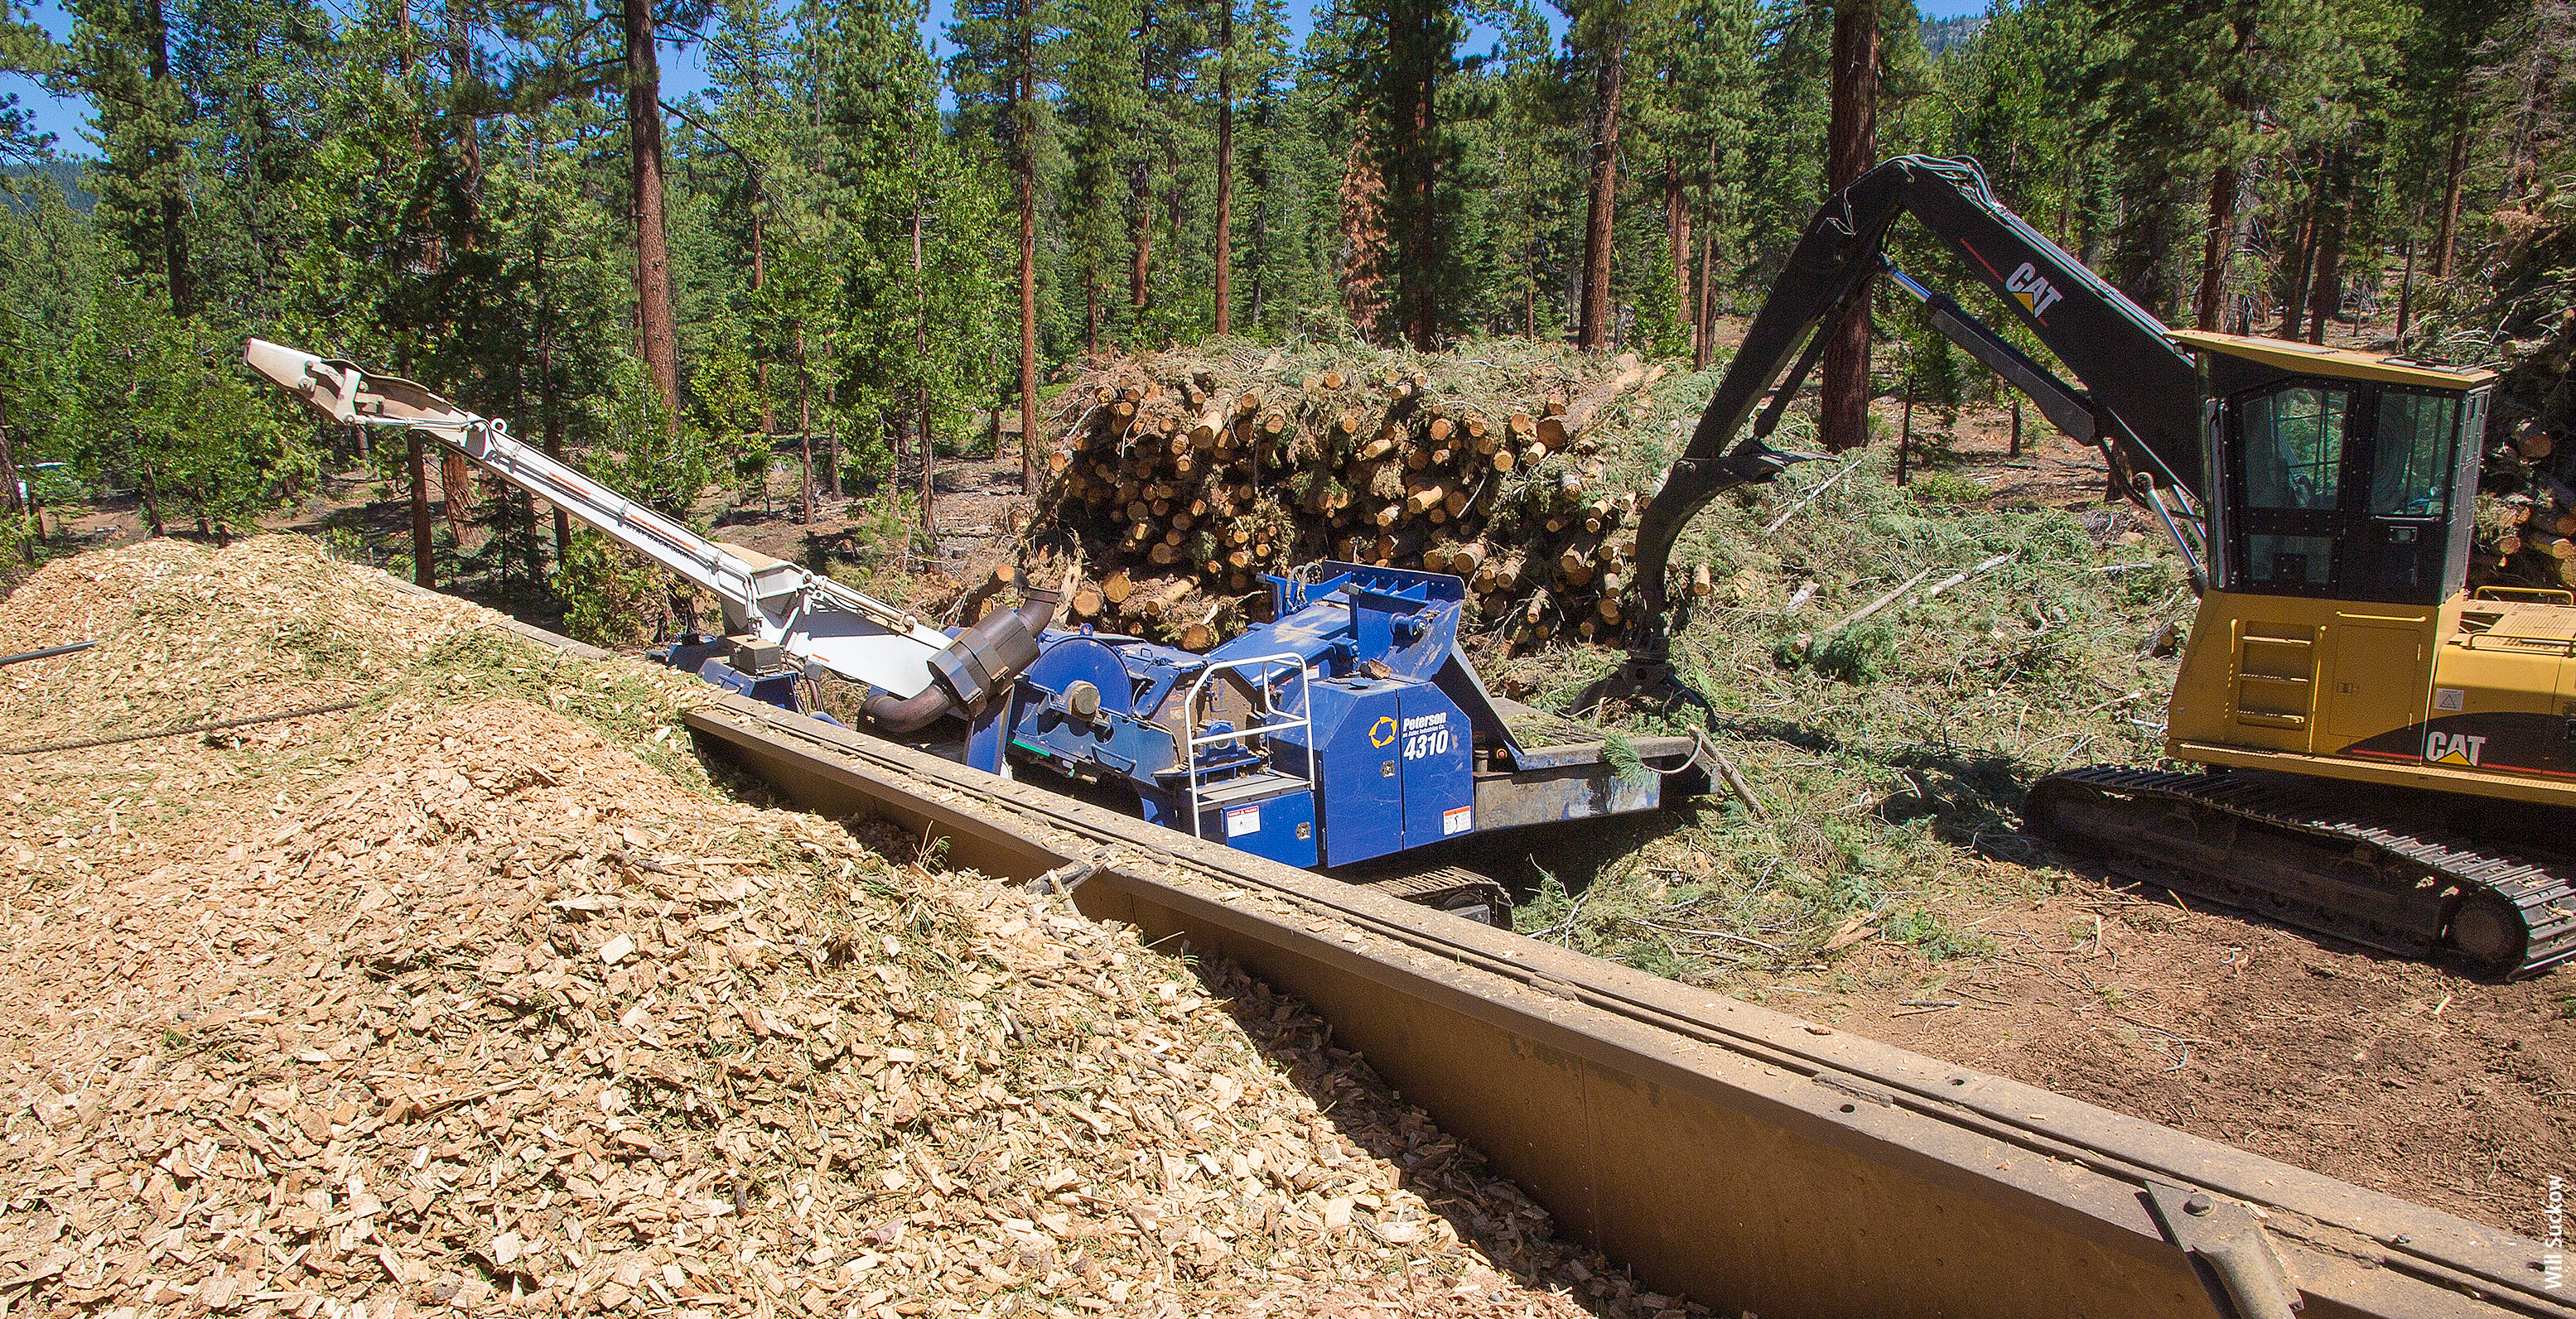
A forest biomass processing contractor, Brushbusters Inc., was retained to process and transport six woody biomass waste piles for use as fuel in the BVBP generation facility located near Ione, California. BVBP is the nearest biomass plant to BFRS. At each BFRS slash pile, an excavator was used to transfer the waste material into a horizontal grinder (fig. 1). Wood chips from the grinder were conveyed directly into chip vans, and transported to the BVBP facility, typically a 65-mile one-way trip. Due to road construction projects and detours, the actual one-way distance averaged about 79 miles. Equipment used for the chipping and transport operations (detailed in table 1) were sized for scale of operations that a medium or large landowner might consider — projects for which landing piles contain at least 100 green tons (GT) of biomass wastes (the equivalent of four chip vans each holding 25 GT). All biomass received at BVBP had been chipped prior to transport.
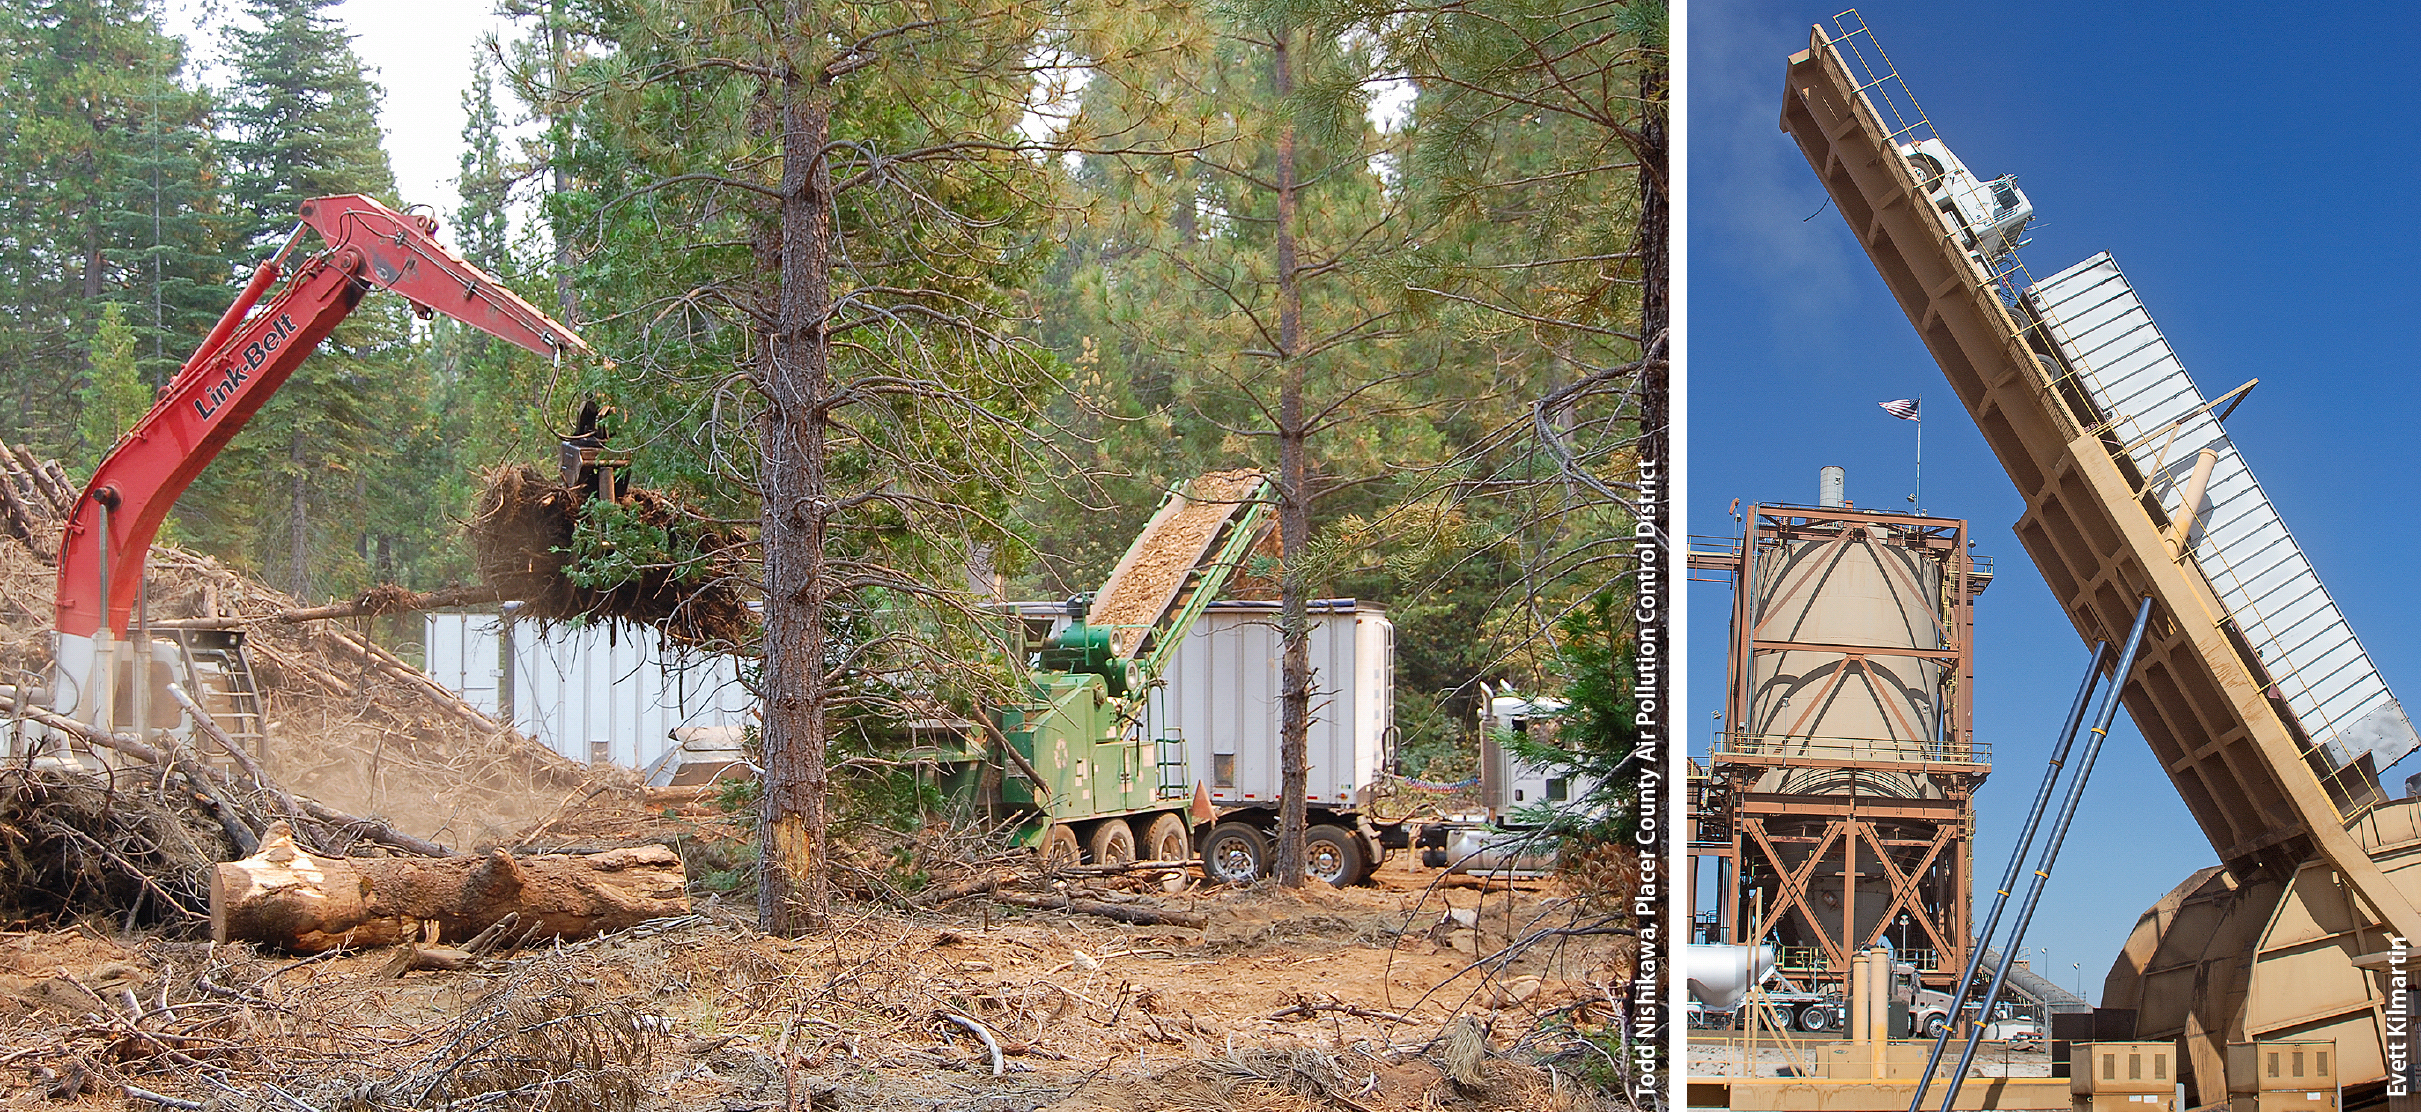
Fig. 1. At Blodgett Forest Research Station, an excavator (left) loads forest slash into a horizontal grinder. Wood chips from the grinder are then conveyed into chip vans (center) for transport to Buena Vista Biomass Power plant (right).
Brushbusters’ operations (grinder, loader and chip vans) were carefully observed and tracked by our team, including total operating hours, productive operating hours (time when grinding and not including time when idling or waiting), diesel fuel use, biomass production and miles traveled. Engine and equipment air emission factors used to determine processing and transport emissions were taken from the manufacturer for each particular model. The following equipment cost factors were used, based on current contractor bid rates: grinder: $450/hour; excavator: $175/hour; chip van: $90/hour.

The BVBP facility uses a wood-fired boiler that produces steam for a turbine and generator rated for 18 megawatts (MW) of electricity. The boiler is a Combustion Engineering/Lurgi circulating fluidized bed design fueled by biomass wastes including agricultural wastes (nut shells and orchard removals and prunings), forest slash and urban wood waste (tree trimmings and sorted construction debris). The boiler utilizes selective non-catalytic reduction for nitrogen oxides control, and multiclones and a baghouse for particulate matter control.
BVBP energy production and air emissions from the use of the BFRS forest slash were determined from direct measurements of biomass use and heat content, boiler continuous emissions monitors, air pollution source test (Avogadro 2013) and boiler heat rate. Emissions from electricity displaced by the biomass project were determined from overall California state generation factors (CARB 2010).
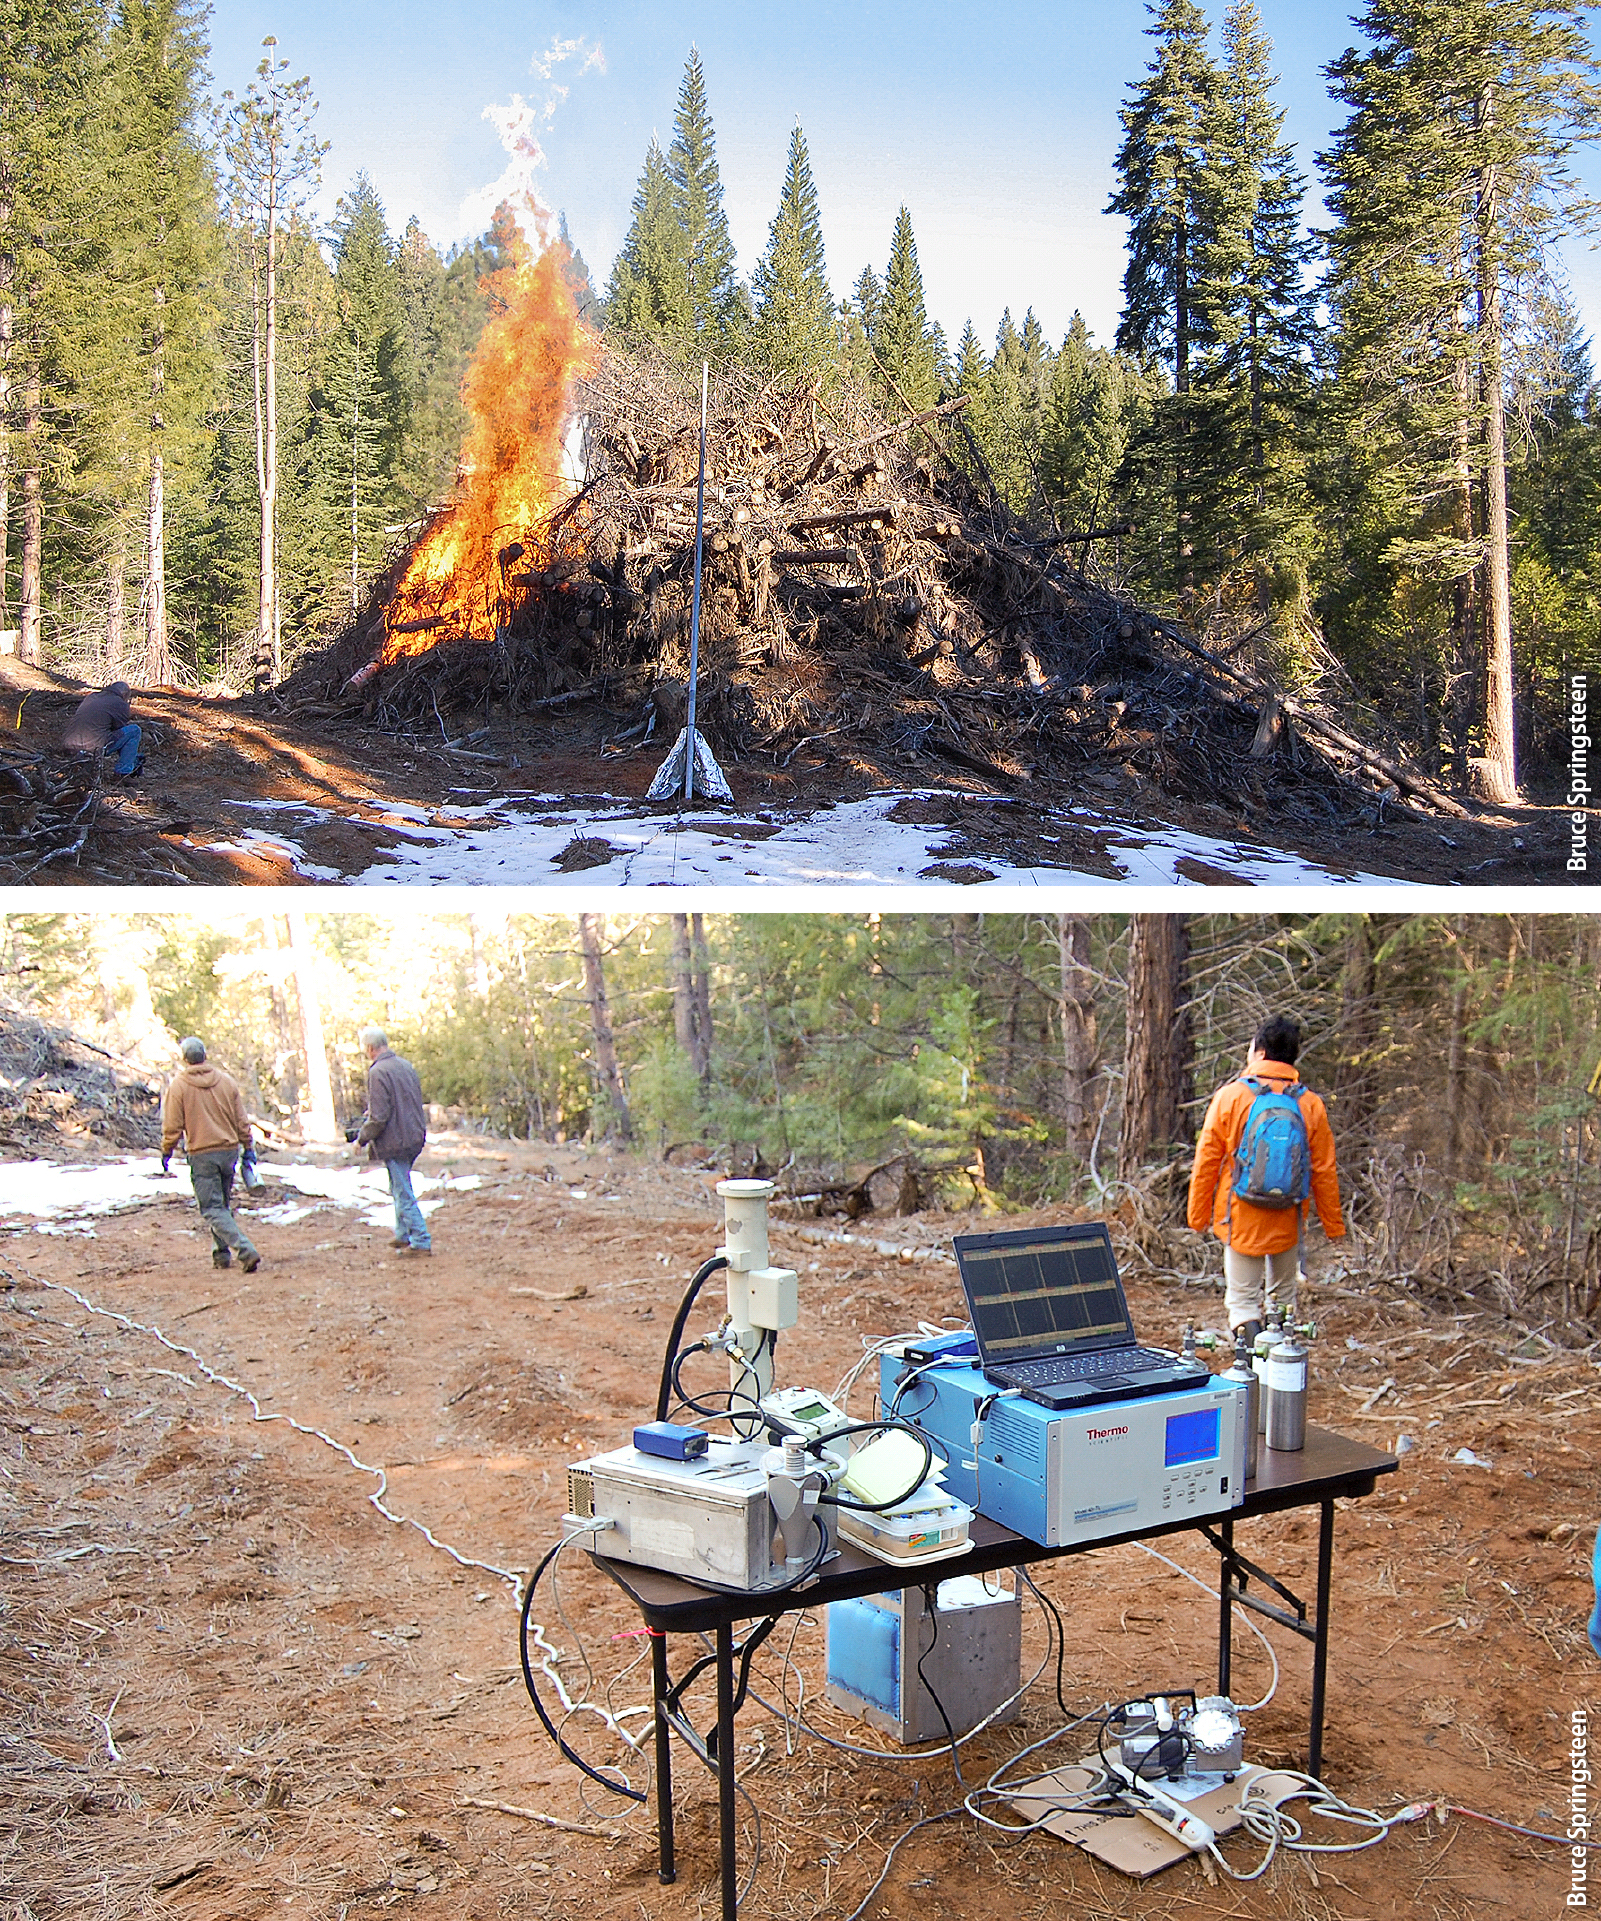
Fig. 2. To sample air emissions from the pile burn, researchers used a 20-foot steel probe at the edge of the pile (top); nitrogen oxides, black carbon and carbon dioxide were measured on site using continuous emissions monitors. Canister samples were collected and sent for off site analysis for total fine particulate matter, trace hydrocarbons and carbon monoxide.
Staff from the USFS Rocky Mountain Research Station Missoula Fire Lab conducted field measurements characterizing air pollutant emissions from an open burn of one of the forest slash residue piles at BFRS (for details see Baker et al. 2014). Air emissions from pile combustion were sampled through a 20-foot steel probe angled over the edge of the pile (fig. 2). Real-time continuous nitrogen oxide (NOx) (Thermo Model 42i analyzer), black carbon (BC) (microAeth Model AE51 aethelometer) and carbon dioxide (CO2) (LICOR LI-820) measurements were conducted on site. Particulate matter less than 2.5 microns (PM2.5) was collected on 37-mm Teflon filters at 15-minute intervals. Emissions samples were collected in SUMMA canisters — three during the flaming phase, and 31 at 10-minute intervals during the burn down — and analyzed for carbon monoxide (CO), nonmethane organic compounds (NMOC), methane (CH4) and CO2 at the Missoula lab using gas chromatography and flame ionization detection. Pile material samples were analyzed at Missoula for moisture, carbon and nitrogen content; Hazen Research Laboratory (Golden, CO) performed ultimate analysis on a representative chip sample. Emission factors were determined using the carbon mass balance method (Hao 1996) for both a “fire average” integrated over the full duration of the flaming and smoldering phase, and a smoldering-only phase.
During the period of August 20, 2013, through September 4, 2013, on eight separate work days, Brushbusters collected, processed and transported 601 bone dry tons (BDT) (928 GT) of forest slash from BFRS to BVBP. This comprised a total of 37 separate chip van loads, with deliveries averaging 16.3 BDT (25.1 GT).
Table 2 shows forest slash biomass waste pile composition — material was relatively dry (9% to 18% moisture) with ash (1.3% dry weight) and heat content (high heating value of 8,359 Btu/dry lb) comparable to virgin conifer slash, indicating minimal contamination with rock and soil.

Energy tradeoffs
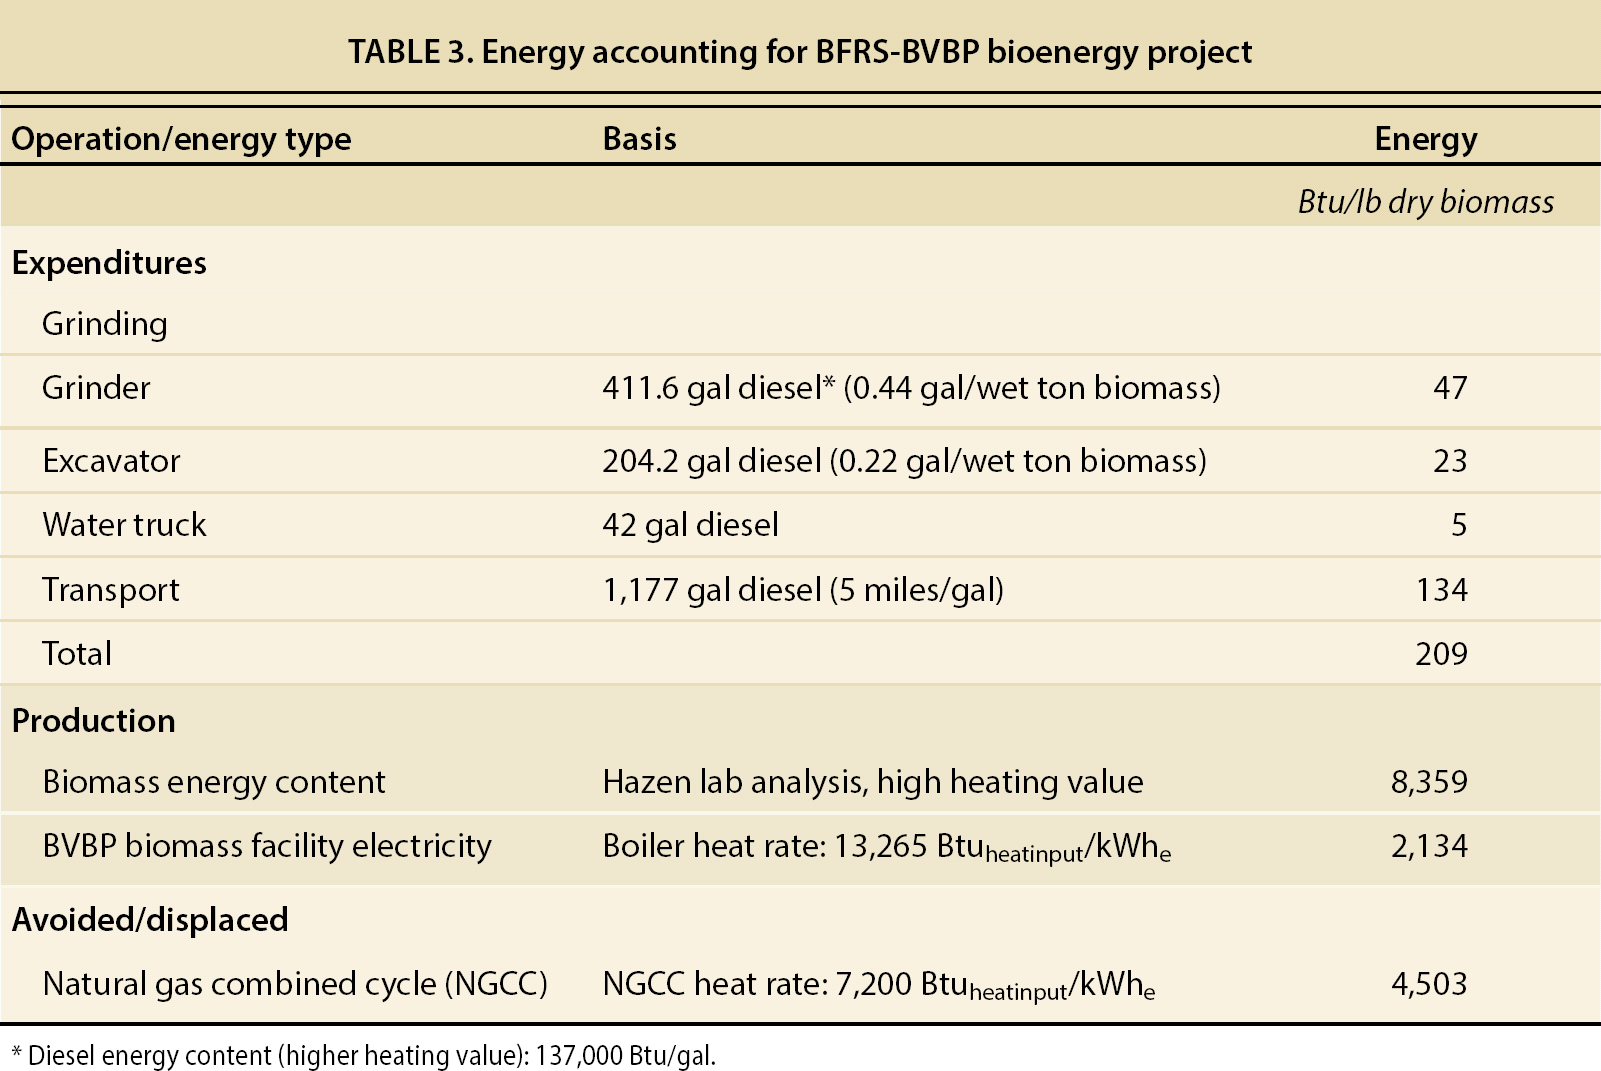
Energy use input requirements and output production for the biomass project are shown in table 3. The energy of the diesel fuel used in collection, grinding and transport is only 2.5% of the available energy of the biomass wastes delivered to BVBP; and 4.6% of the energy of the natural gas (that would be required for producing an equivalent amount of electricity in a combined cycle natural gas-fired generation facility) that is displaced by the BFRS-BVBP bioenergy project. This is consistent with displaced generation found in other studies (e.g., Jones et al. 2010; Pan et al. 2008; Springsteen et al. 2011).
Challenging economics
Biomass project economics are shown in table 4. The total delivered cost of $70/BDT was almost equally split between collection and processing at $34/BDT and transporting to BVBP at $36/BDT.
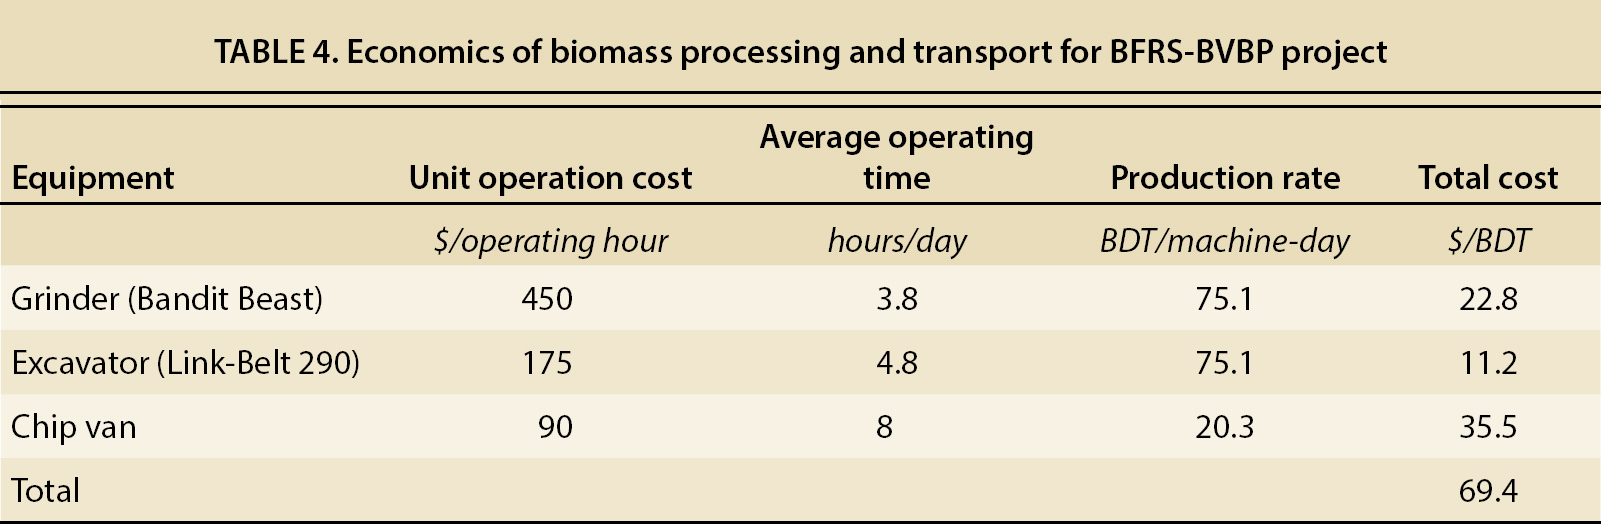
Production rates were less than expected due to lack of full-time availability of chip vans to the grinder landings. This was due to the following considerations: (1) BVBP was not in commercial operation and curtailed the hours they were accepting fuel deliveries. In many cases, trucks had to be parked loaded overnight rather than complete a one-day round trip; (2) public road contruction activities caused transport delays, resulting in average chip van transport speeds of only 31 mph; and (3) trees and brush from BFRS spur roads and landings needed to be cleared to allow van access.
Three to four chip vans were used each day for hauling. Each chip van averaged only 1.25 delivered loads per day rather than the potential two loads per day for the round-trip distance of 158 miles.
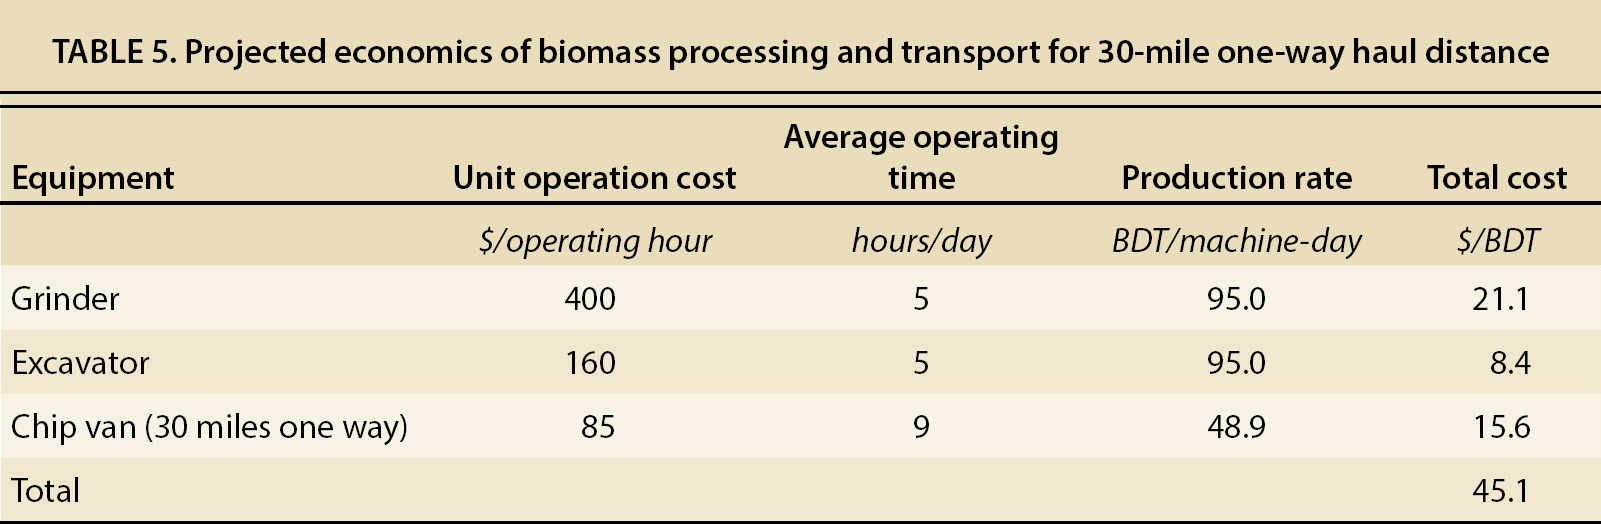
Time-motion evaluation found the grinder to be actively processing material for only 2.5 hours/day, while the grinder engine and excavator actually operated 3.8 and 4.8 hours/day, respectively (including idling and non-processing time). The biomass piles were originally created with pile burning as the planned disposal method, not grinding and removal for use as energy. The low density piles slowed feeding of the biomass wastes into the grinder. There were other delays due to moving equipment, preparing roads to access the piles and waiting for chip vans. All of these are common challenges that should be expected when first introducing biomass operations on forestlands. With improved pile stacking and a reduction in grinder idling, projected processing costs could be reduced to about $30/ BDT (table 5).
Project expenditures for processing and transport were close to $70/BDT, while the competitive market value at the time of the project for biomass sourced from timber harvest residual in the central Sierra Nevada region was $45/ BDT. The economic cost to dispose of the biomass wastes at the site of generation through open pile burning was less than $5/BDT. Thus, the demonstration project operated with a cost deficit of approximately $20/BDT.
Transport costs are a significant cost driver when collecting, processing and transporting forest biomass. To achieve a market price of $45/BDT for biomass fuel, the projected break-even transport distance would need to average approximately 30 miles one way. As shown in table 5, this estimate assumes improvements in grinder processing efficiency and transport costs of $15.60/BDT (based on a chip van capacity of 16.3 BDT per load, chip van speed of 30 miles/hour, round trip of 60 miles, van loading and unloading time of 1 hour, and hourly van rate of $85/hour).
Emissions from open pile burning
On the morning of January 20, 2014, one pile at BFRS, roughly 80 feet by 100 feet wide and 15 feet tall, containing approximately 300 BDT, was burned. The pile material composition, size and stacking arrangement was similar to those moved to BVBP. The pile was lit at the edge near the steel sampling probe. Within 5 minutes, a strong convective column with 100-foot-high flames formed. Due to the size and height of the burn it was not possible to sample the main section of the plume during the full flaming combustion mode of the burn. Figure 3 shows the pile as the ignition progressed through flaming and smoldering stages. Flaming phase transitioned to smoldering phase approximately 40 minutes after ignition.

Fig. 3. In 2014, researchers measured air emissions from an open pile burn at BFRS. Due to the size and height of the burn, they were unable to sample the main section of the plume during the full flaming combustion mode (see time interval at 13 minutes). Flaming phase transitioned to smoldering phase approximately 40 minutes after ignition.
CO is a strong surrogate indicator for other products of incomplete combustion (NMOC and CH4), as shown in fig. 4 (canister measurements taken throughout the pile burn). Because monitoring CO is comparatively straightforward, it is important to establish its relationship to compounds that are more difficult to monitor (including NMOC and CH4). The pile burn overall modified combustion efficiency (MCE) value of 94% (table 6) is consistent with the observation of good pile burning conditions — dry material, good air mixing and high burn temperature.

Emission factors from the open pile burn at BFRS are shown in table 6, including measurement variability (standard deviation) for both the smoldering phase and the total overall integrated (flaming and smoldering phases) burn. Due to the researchers’ inability to sample the primary pile smoke plume, BC results are only presented for the smoldering phase; total overall burn results are reported for the other air pollutants but may not adequately represent the flaming conditions in the main pile burn exhaust plume.
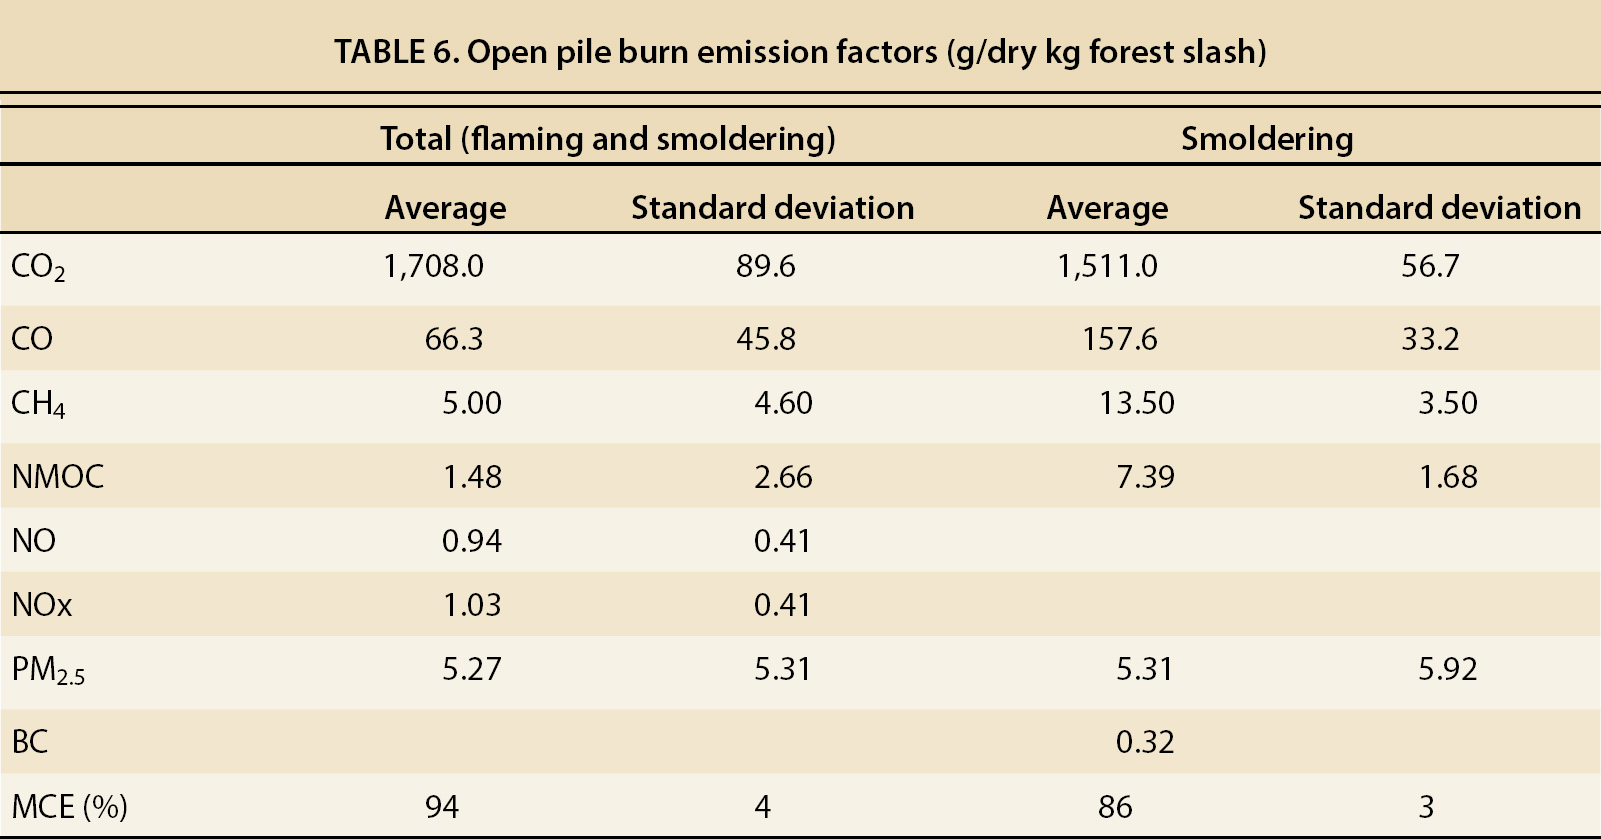
Emissions factors for PM2.5, CO and CH4 were consistent with those reported in the literature (see Springsteen et al. (2011) for a recent compilation of forest residue open pile burn emission factors). Emission factors for NOx and NMOC were 50% to 75% and 0% to 75% lower, respectively, than other studies. The lower NOx may be the result of the large pile size and inability to sample the high temperature locations of the pile plume during the flaming phase. As expected, emission factors for products of incomplete combustion, including CO, NMOC and CH4, were significantly higher for the smoldering phase.
Emissions comparison.
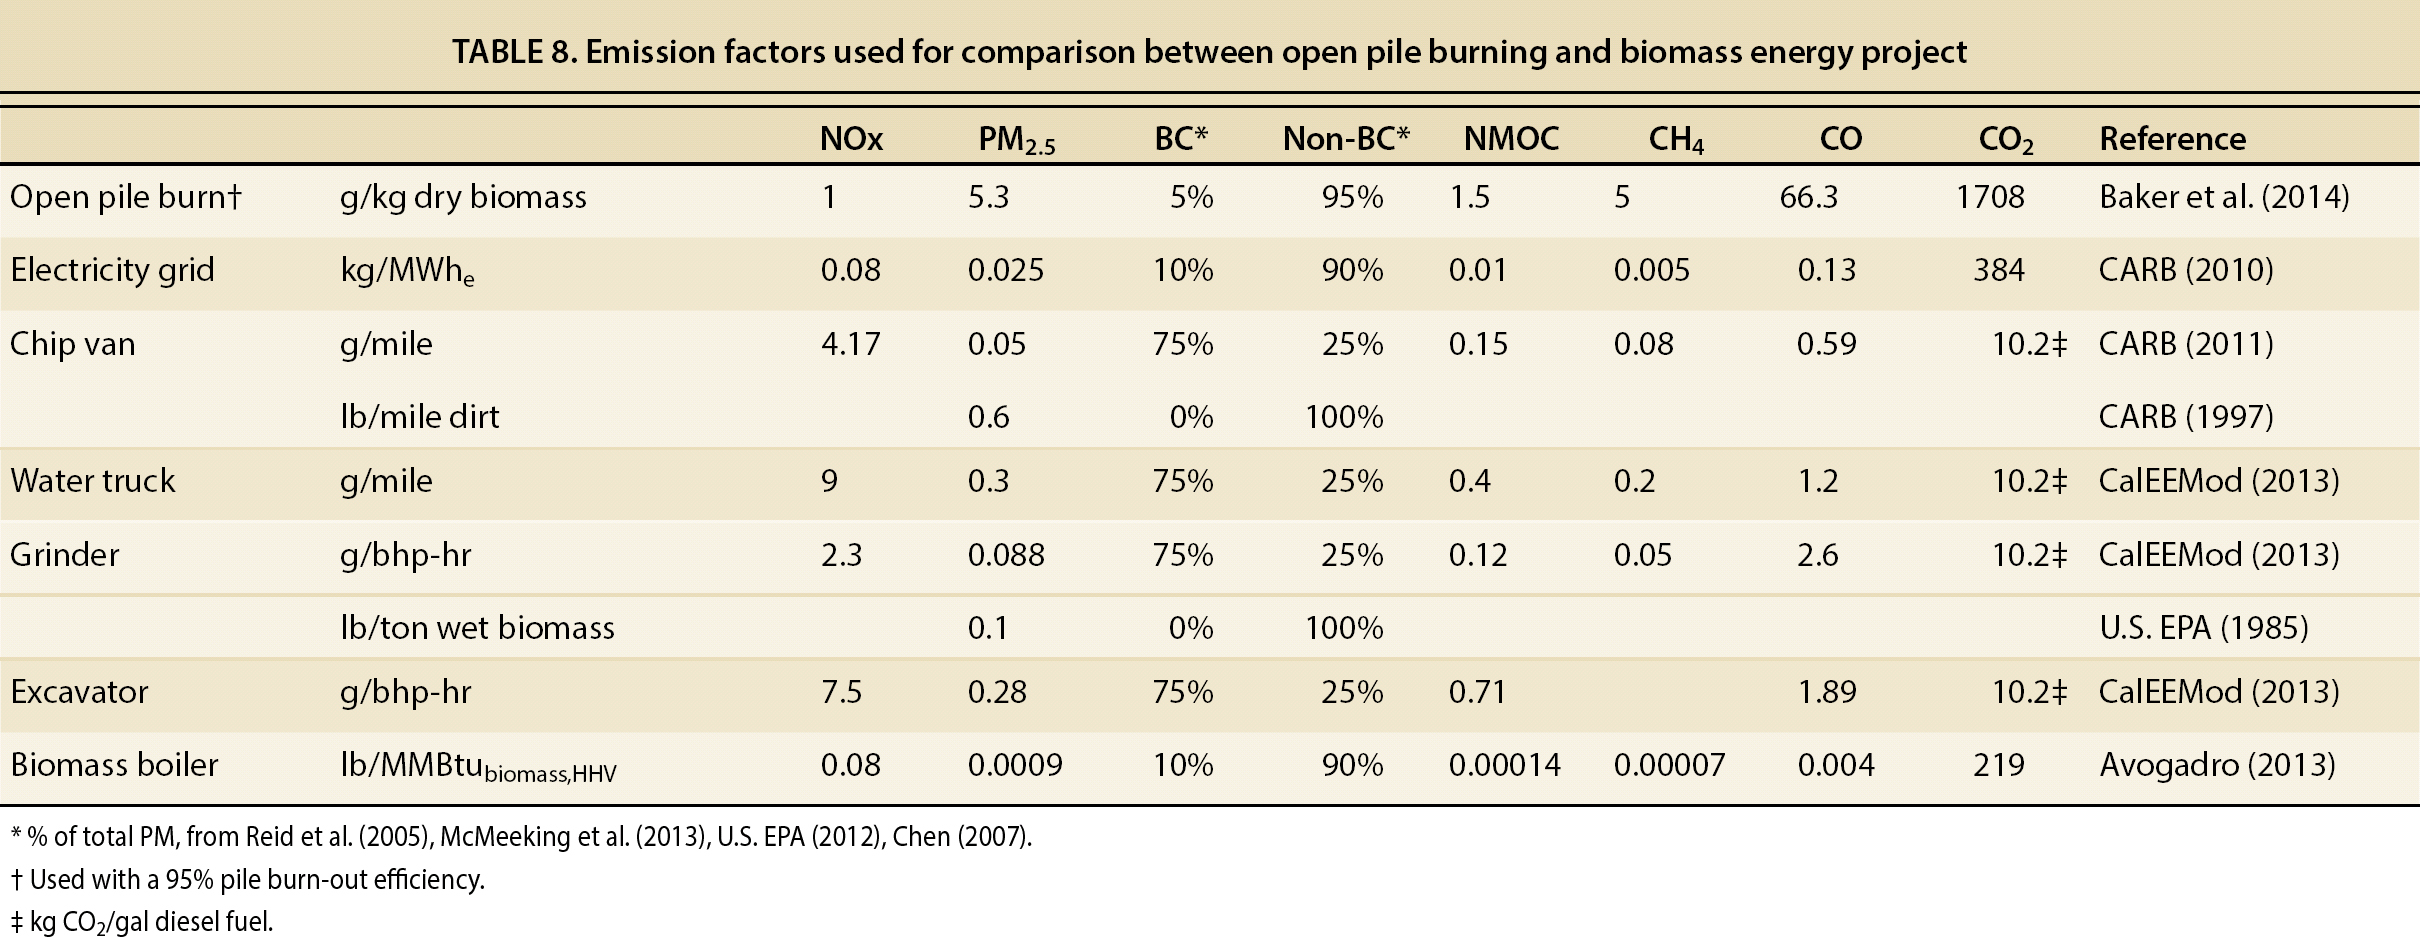
Criteria air pollutant and GHG emissions (per BDT of woody biomass) from BFRS open pile burning and the BVBP biomass energy project alternative are compared in figs. 5 and 6, respectively. GHG emissions are shown as CO2-equivalent based on Global Warming Potential factors from the Intergovernmental Panel on Climate Change (IPCC 2013). Details of the emission factors used and calculations are in tables 7 and 8.
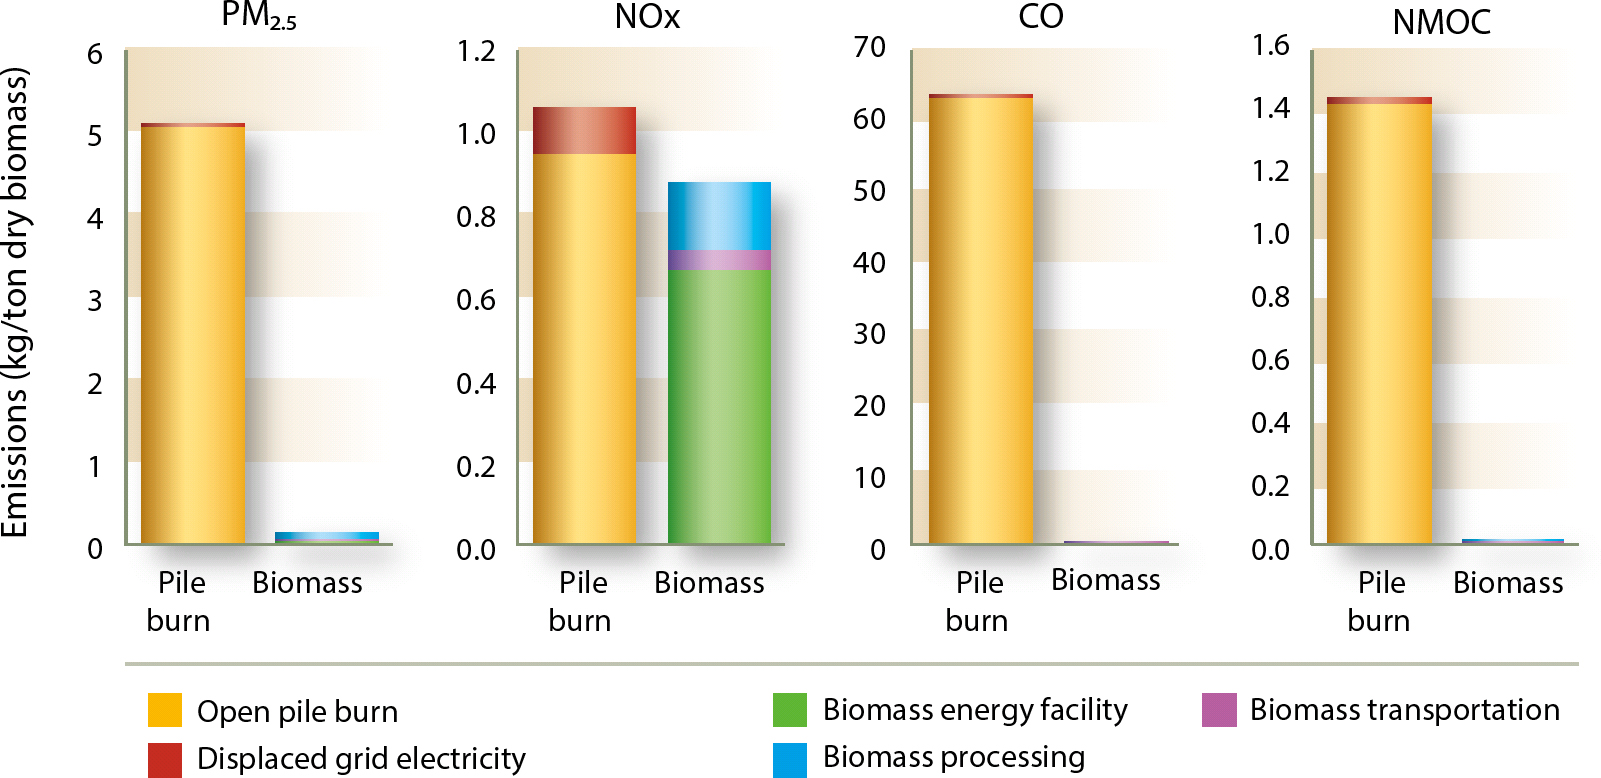
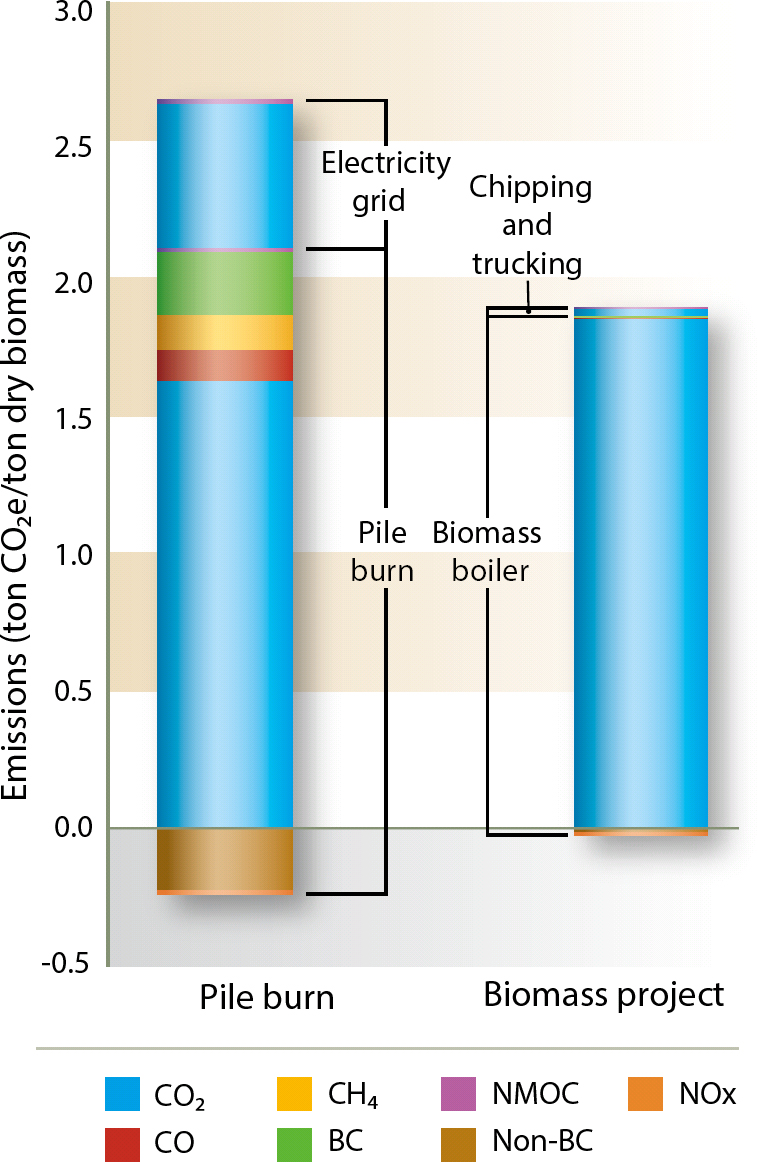
Fig. 6. Greenhouse gas emissions comparison: pile burn versus biomass energy project. (For the biomass energy project, the contribution to the CO2e total for all of non-CO2 constituents (CO, CH4, NMOC, NOx, BC and Non-BC) is included, but the bars are not visible because they are insignificant in comparison to that from CO2.)
Reductions of PM2.5, CO, NMOC and BC were from 98% to 99%, which is consistent with other findings (Jones et al. 2010; Lee et al. 2010; Springsteen et al. 2011). These results are due to the efficient combustion and controls at the biomass energy facility and engines used for processing and transport. NOx emissions reductions of only 17% result from the lower-than-typical NOx measured from the open pile burn.
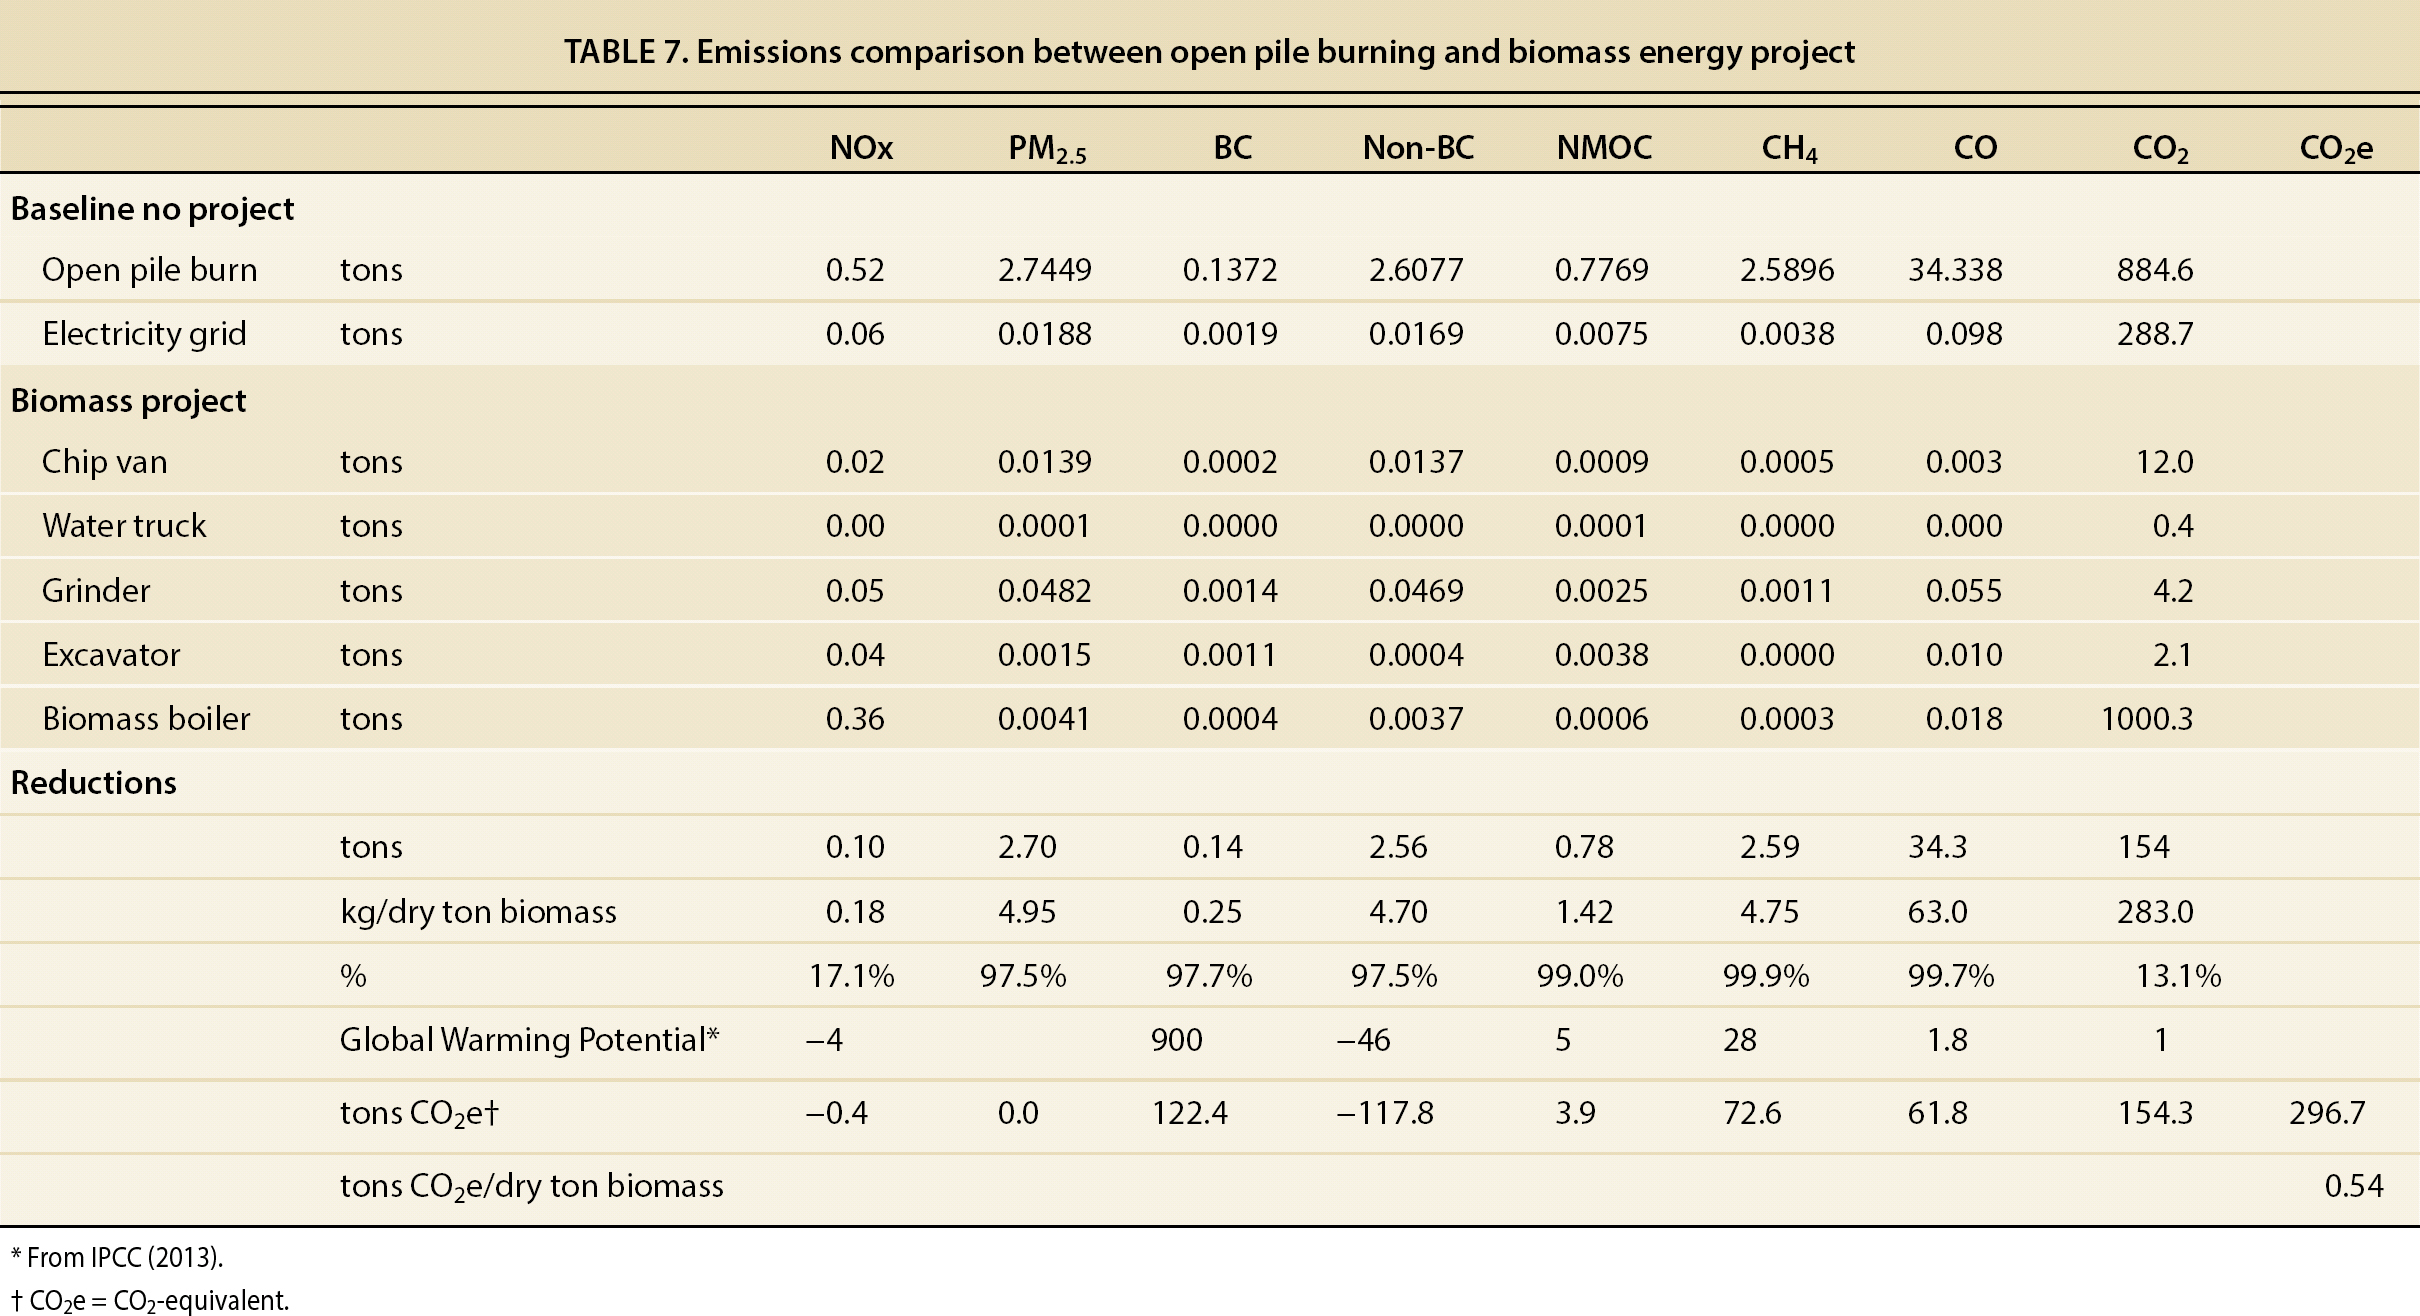
GHG CO2-equivalent reductions of 0.5 tons/BDT of biomass from the BVBP bioenergy project result from reduction in BC, CO, NMOC and CH4 compared to the pile burn; and renewable electricity that displaces fossil fuels required for equivalent power generation.
Conclusion
Energy production and reductions in criteria air pollutants and GHG emissions were quantified from utilization of forest woody biomass wastes to fuel electricity generation as an alternative to open pile burning. However, biomass energy project economics were not favorable due to inefficient processing operations and the long transport distance between biomass origin and energy facility. Expected improvements in processing and transport efficiency alone will not bridge the gap. Sales of greenhouse gas and criteria air pollution reductions as mitigation offsets to meet environmental review requirements (such as those under the California Environmental Quality Act) would help to make forest biomass projects economically viable. A potential greenhouse gas value of $20/ton CO2-equivalent (the approximate rate of credits under South Coast Air Quality Management District Rule 2702, Greenhouse Gas Reduction Program) would add $10/BDT to the biomass value and reduce the BRFS-BVBP project deficit by half. Monetizing criteria air pollutant reduction benefits could fully close the deficit. Under California's Carl Moyer Program, mitigation of NOx, NMOC and PM2.5 is valued at up to $16,000 per ton. There is a growing demand for such emissions reductions as air quality standards tighten and economic growth in rural air basins continues. For instance, new businesses and land development projects that generate emissions are often required to mitigate their impact under the California Environmental Quality Act review process or purchase emissions reduction credits to meet New Source Review requirements under the federal Clear Air Act.
A video documenting the BFRS biomass project was produced that includes interviews with a unique and diverse set of resource professionals, researchers, state and federal agency representatives, utility representatives and elected officials. The video can be viewed at http://vimeo.com/89771199 .
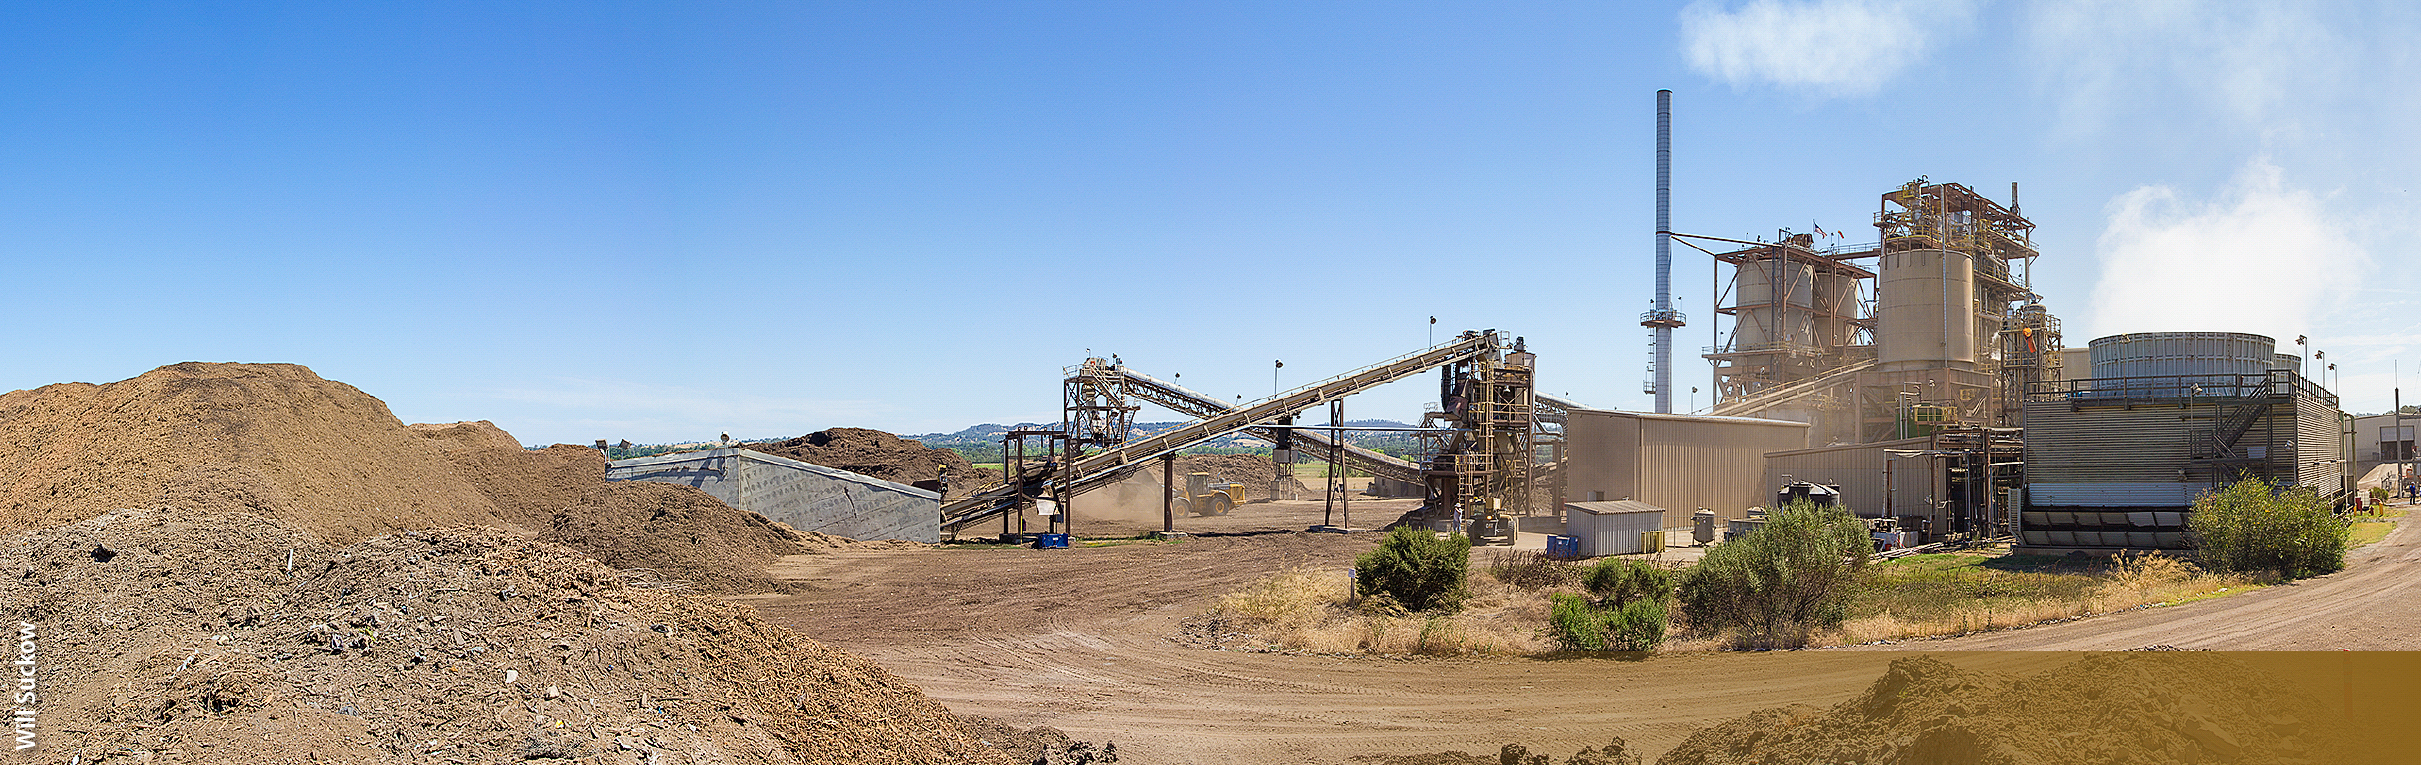
Buena Vista Biomass Power plant and mound of woody biomass in storage area.
Citations
Forest biomass diversion in the Sierra Nevada: Energy, economics and emissions

