


All Issues
Standards vary in studies using rainfall simulators to evaluate erosion
Publication Information
California Agriculture 66(3):102-107. https://doi.org/10.3733/ca.v066n03p102
Published online July 01, 2012
NALT Keywords
Abstract
Rainfall simulators are often employed to measure erosion rates, in order to estimate stream loading of sediment and nutrients in California foothill watersheds. The rainfall simulator enables the precise application of artificial rain with controlled drop sizes, intensity and duration. In addition to rain factors such as drop energy and intensity, several soil- and cover-related factors affect erosion rates. While computational models have evolved to quantify erosion based on field measurements taken by rainfall simulators, there has not been a consensus on the methodology to be deployed, especially in forested and remote landscapes. In addition, it is challenging to apply study results from small plots to entire watersheds. To guide future fieldwork on sediment loading to water bodies, we review key concerns related to rainfall simulator studies.
Full text
The ability to estimate how land-use practices affect soil erosion has become critically important. The U.S. Environmental Protection Agency, under section 303(d) of the Clean Water Act, has listed dozens of streams in California and the Western states as impaired or threatened due to excessive sediment concentrations, which adversely affect fish habitat. If erosion rates specific to site and land-use practices can be measured adequately, estimates of stream sediment loading can be developed.
The unpredictable and infrequent nature of rain makes it difficult to study its eroding effects on soils while it is raining. To overcome these difficulties, rainfall simulators can be used to apply precisely defined “storms” over frames designed to capture and enable the measurement of runoff and erosion rates. A variety of rainfall simulators have been developed over the past two decades and deployed in the field. Rainfall simulators typically use needle tanks or nozzle sprayers to apply water at desired rates and durations. Since 2000, extensive studies across the Lake Tahoe Basin have used drop-former type rainfall simulators (Battany and Grismer 2000) to help determine the impacts of road and forest management on sediment loading to the lake (Grismer and Hogan 2004, 2005a, 2005b), and researchers overseas have used rainfall simulators in similar studies.
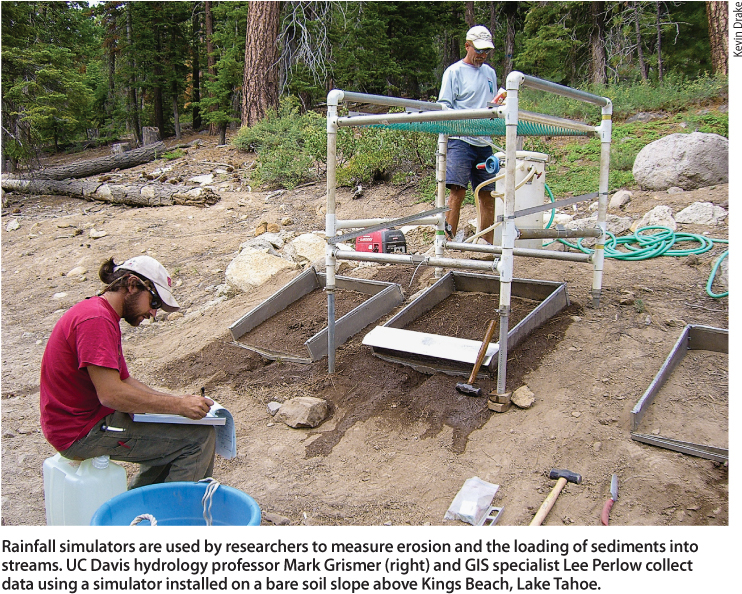
Rainfall simulators are used by researchers to measure erosion and the loading of sediments into streams. UC Davis hydrology professor Mark Grismer (right) and GIS specialist Lee Perlow collect data using a simulator installed on a bare soil slope above Kings Beach, Lake Tahoe.
A major handicap in this area of critical research, however, is that there is no standardized methodology for measuring erosion rates. This article reviews the literature on rainfall simulator techniques and their applicability to forest, rangeland and ski-run areas in the Sierra Nevada of California (the complete report is available at http://ucanr.org/u.cfm?id=48 ).
Rainfall simulator approaches
In general, rainfall runoff and erosion are initiated by the impact of rain drops on bare or nearly bare soils, which detaches and splashes soil particles and subsequently transports them downslope as part of overland flow. Net erosion rates (sediment mass/unit area) are a function of both rain splash and overland flow transport. Runoff, as overland flow, carries with it the most erodible silt and very fine sand particles from the soil surface as the water flows downhill. When rills (small streams or rivulets) form they initiate small channels, eventually forming gullies, which can result in massive soil losses. Rainfall simulators are typically used to determine inter-rill erosion rates and their dependence on rainfall and soil parameters.
European researchers have tried to develop standards for the use of rainfall simulators. Parsons and Lascelles (2006) detailed efforts to catalog the rainfall simulators in use and their specifications and performance characteristics, and to develop a standard evaluation and test methodology so that data from various studies could be compared. Facing erosion and stream sedimentation problems from vineyards and rangelands similar to those in California, researchers in Spain, including Cerdà (1997), have been interested in California rainfall simulator research. Agassi and Bradford (1999) reviewed inter-rill erosion measurement studies using rainfall simulators and found inadequate characterization of (1) the type of rainfall simulator and deployed rainfall intensities, mean drop size, drop size distribution and water quality, (2) the soil plot's physical and chemical properties and (3) the type of results obtained and how they were presented. Later, Kinnell (2005, 2006) reviewed several raindrop-affected erosion processes in the laboratory and noted that conceptual models and measurements failed to adequately characterize observed erosion processes from bare soils. Due to difficulties in comparing rainfall simulator studies across rangelands and forested areas of the Tahoe Basin (Foltz et al. 2012; Grismer and Hogan 2004), members of the Tahoe Science Consortium have recently raised concerns about the variety of rainfall simulator methods and the lack of standardization in measuring infiltration and erosion rates.
The erosion process
Raindrop energy.
A raindrop's kinetic energy (KE) is one-half of the product of its size (mass) and velocity squared. Lal (1988) maintained that kinetic energy is a major factor in the soil detachment process, and therefore that the total energy of a storm is proportional to its “erosivity.” It has been shown in statistical analyses that kinetic energy is insufficient to describe erosivity; the terms “erosivity,” or “erodibility,” in fact stem from qualitative descriptions and lack quantitative definitions based on physical processes.
Infiltration and erosion.
The impact of raindrops on bare soil compacts the surface and may detach soil particles; the soil surface may become sealed, reducing the infiltration rate. For mild bare slopes, detachment and rain splash are the dominant factors causing erosion. As the slope angle increases, runoff becomes the dominant factor. When the rainfall intensity exceeds the infiltration rate, surface water accumulates on the soil, and when surface depressions are filled, runoff can occur. Increased surface roughness due to soil textural variations, tillage, residues on the surface or the presence of living plant stems reduces the velocity of overland flow. Soil surface cover, in the form of living vegetation or residues, reduces the impact (kinetic energy) of the raindrops and prevents them from striking bare soil.
Soil cover.
The effect of plant canopy cover on reducing runoff and erosion in rangeland is attributed primarily to increased litter cover, soil macro-porosity and soil structure, rather than the direct interception of rainfall. Similarly, rock cover tends to reduce erosion rates proportionally to the area of coverage. Overland flow on a specific site is difficult to measure, and little is known about the mechanics of soil loss by this process.
Slope changes.
All other factors being equal, it has been established that erosion rates increase as slope angles increase; presumably as overland flow velocities increase, so does the erosive power and transport capacity of runoff to carry suspended sediments. Slope angle is also important to how raindrop splashes affect erosion; as steepness increases, more soil is splashed downhill. However, the runoff rate is most sensitive to slope change; beyond a soil- and cover-dependent threshold, it is the dominant erosive process.
Interrelated processes.
Erosion from soil surfaces involves interrelated processes that combine in complex spatial and temporal variations. These processes include particle (aggregate) breakdown and detachment; rain splash effects followed by particle suspension and transport as part of overland flow or wind transport; particle filtration by covers or mulch layers; and particle movement into the soil profile. These processes are affected by basic hydrologic phenomena such as precipitation form and rates, soil infiltration rates and capacity, and soil surface conditions.
In contrast, most water erosion research assumes the simplest conditions: bare soils (no cover or mulch) of known texture and bulk density, on mild slopes (< 10%) with no infiltration-limiting layer. With the exception of areas that have roads or are disturbed, such conditions are rarely found in rangelands or forests of the California foothills.
Erosion loss models
Following the Dust Bowl era and the consequent dramatic losses of soils due to cultivation and grazing, research efforts were directed at determining the primary factors contributing to soil losses from agriculture. These efforts included the development of simple-to-use equations and models for estimating erosion rates under various agricultural practices. The value of erosion models lies primarily in conservation planning, as tools to predict soil loss. Increasingly, though, they are used to develop regulatory guidelines and evaluate compliance when monitoring information is lacking.
Physically or process-based models employ mathematical representations of flows of mass, momentum and various forms of energy to describe soil-water processes. They consist of a number of linked equations with parameters that have direct physical significance and can each be evaluated by independent field measurements. In principle, physically based processes only require representative physical characteristics of the soil-water system in the model for the results to be realistic.
Universal Soil Loss Equation.
The Universal Soil Loss Equation (USLE) was codified in 1965 in the U.S. Department of Agriculture (USDA) Agriculture Handbook No. 282 and revised by Wischmeier and Smith (1978) in Agriculture Handbook No. 537. The USLE was derived from statistical analyses of natural runoff and erosion data and equivalent rainfall simulator–derived plot data largely gathered in the central United States. The authors emphasized that the USLE was an erosion model designed to predict the long-term average annual soil losses from rill and inter-rill erosion that might be expected from specific field areas under various cropping and management systems. The USLE identified six major erosion factors, the product of which represents average annual soil loss:

This simulator uses a frame with nozzles (top) to apply water at various rates and a frame on the ground to catch sediments.

where: A = estimated soil loss (tons per acre per year), R = rainfall runoff, K = soil erodibility, L = slope length, S = slope steepness, C = cover and management and P = supporting practice.

The models for analyzing rainfall simulator data are based on rainfall and soil loss rates, slope length and steepness, percentage of vegetative cover and other factors. Monitoring specialist Mike Ukraine filters samples at the Integrated Environmental Restoration Services lab in Tahoe City.
Rainfall runoff (R) is a key factor of the USLE model and is determined by local climate conditions. The erodibility factor (K) is determined from the soil type, and the management and practices factors (C and P) are estimated from tables of values associated with management and practice descriptions. The USLE equation was derived from soil loss data measured from erosion plots after about 1 year of runoff, and as such the equation predicts annual accumulated soil losses rather than individual rain event losses.
WEPP model.
Later, the Water Erosion and Prediction Project (WEPP) model was developed (Nearing et al. 1990) with the concept of developing a physically based mathematical description of erosion processes, but it also uses the equivalent of the K, C and P factors of the USLE equation. Both the USLE equation and WEPP model need estimates of inter-rill erodibility (K), which can be obtained using rainfall simulators.
Post-WEPP developments
While the WEPP model and its related equations represent accumulated research of the past several decades, they originated from Ellison's (1947) paradigm that “erosion is a process of detachment and transport of soil materials by erosive agents.” Such a view has come under criticism, because erosion processes are sufficiently complex that many questions remain unresolved, including laminar versus turbulent flows in the field; the fundamental applicability of the turbulent flow–based shear stress equations to slopes greater than 10%; the discrepancy between measured and modeled soil shear strength; and raindrop effects on steeper, relatively undisturbed forest soils. As a result, the precise definition of erodibility remains elusive (Agassi and Bradford 1999).
Owoputi and Stolte (1995) suggested that the semi-empiricism implicit in the WEPP model and related equations should be replaced by more careful definitions of the forces acting on hypothetical soil particles or aggregates. Presumably from there the forces or energy needed for aggregate breakdown could be applied to determine the extent of finer particle liberation and subsequent transport (Fristensky and Grismer 2009). Owoputi and Stolte (1995) underscored the need to account for the moisture dependence of soil strength and seepage, though in a rainfall- or runoff-induced erosion event it is likely that the surface soil layers are at or near saturation, their weakest state.
Similarly, in a thorough review of erosion induced by raindrops on mildly sloping bare soils, Kinnell (2005) claimed that current models “do not represent all of the erosion processes well.” None of the models deal with temporal changes in surface properties, and all simplify the process descriptions to a planar surface lacking the variations in microtopography or surface roughness found in even relatively smooth field soils. Grismer (2007) noted that the research briefly summarized here, and similar studies, by necessity were conducted on bare soils and as a result may not apply to duff-covered or litter- and mulch-matted range and forest soils in which the dominant sediment detachment and transport processes are perhaps better characterized as filtration.
According to Zhang et al. (2003), soil erodibility would ideally be quantitatively defined as a detachment or transport coefficient relating soil detachment rates to an appropriate form of stream power (the product of runoff velocity and land slope). A rise in stream power likely increases possible aggregate disintegration, and there may be a practical threshold of stream power effects to consider in detachment modeling (Fristensky and Grismer 2009). Thus, either the physical process description given by equations such as those in the WEPP model is inadequate, or erodibility needs greater clarification and evaluation.
Natural and simulated rainfall
The role of raindrop velocity, or energy, in the splash detachment of soil particles has been a concern for decades (Bisal 1960; Ellison 1947). Debate centers on whether raindrop size, velocity, momentum, kinetic energy or some combination of these is the key parameter in the design of rainfall simulators used for erosion studies. In addition, a threshold concept must account for the limited erosion rates encountered during low-intensity storms (for which the use of kinetic energy alone tends to overestimate erosion rates). Nonetheless, in contrast to earlier studies, recent work includes determinations of rainfall kinetic energy as a measure of total energy available for aggregate disintegration, detachment and transport. These estimated kinetic energies depend in part on drop sizes and their distribution.
The median drop size of natural rainfall varies with intensity. Several studies suggest that drop sizes of around 2.5 millimeters may be appropriate for simulated rainfall at the intensities often employed in the field. When drop size distributions are expressed as a fraction of the rain event's volume and intensity, relatively low-intensity events are dominated by drop sizes of less than 1 millimeter, while rainfall intensities between 40 and 120 millimeters (1.6 to 4.8 inches) per hour are associated with a median drop size of around 2 millimeters. Few direct measurements of kinetic energy for simulated and natural rainfall exist; rather, kinetic energies are estimated from drop sizes, assumed distributions and fall heights or terminal and nozzle velocities.
Van Dijk et al. (2002) reviewed studies of the relationship between rainfall drop sizes, intensity and kinetic energies from around the world and found that in good quality data, kinetic energy ranged from 11 to 36 joules per square meter per millimeter depth (J/m2-mm) with maximum values averaging around 29 J/m2-mm and minimum values of about 12 J/m2-mm. Particular kinetic energy values depended on location, type of storm and storm pattern. They found that high-intensity storms typical of rainfall simulator studies (> 40 millimeters per hour) result in average kinetic energies of 23 to 24 J/m2-mm.
Overlooked by van Dijk et al. (2002) were earlier studies (Madden et al. 1998) that used piezoelectric crystals to directly measure natural and simulated raindrop power (kinetic energy per unit of time). Simulated rains at intensities of 23 to 48 millimeters per hour developed powers of 200 to 1,320 joules per square meter per hour (J/m2-hr), while natural rainfall powers for 85 events ranged from around 200 to 3,000 J/m2-hr at intensities of 1 and 42 millimeters per hour, but reached as much as 6,000 J/m2-hr for short, high-intensity storm events.
What this range of kinetic energies at given intensities means with respect to the evaluation of erodibilities remains unclear. Van Dijk et al. (2002) commented, “In terms of process-based research, it appears that our knowledge of the distribution of drop size and terminal velocity in natural rainfall is well ahead of our understanding of the way in which these interact to detach and transport soil particles by splash.”
In another review, Dunkerley (2008) lamented that most rainfall simulator–based studies employ extreme rainfall intensities for the application region or duration, with an overemphasis on drop sizes, their distributions and kinetic energies. It is not clear if the variability of natural rainfall duration, intensity and drop size is critical in terms of soil detachment and erosion, if the mean or maximum kinetic energies are known or estimated.
Rainfall simulator designs
Rainfall simulators must be designed to meet competing demands: replication of natural rainfall, ease of portability across remote and steep terrain, reasonable costs of construction, and uniformity across the test plots in terms of rainfall intensity, drop size and kinetic energy. Duplicating the range of drop sizes and kinetic energies of natural rainfall has proven difficult.
Two types of rainfall simulators have emerged in field research, broadly categorized as the spray/sprinkler nozzle and the drop-former, which simulate rain intensities of 10 to 200 millimeters per hour and drop sizes of 0.1 to 6 millimeters. In terms of size, rainfall simulators range from a simple, small, portable infiltrometer with a 6-inch-diameter rainfall area (Bhardwaj and Singh 1992) to the complex Kentucky rainfall simulator, which covers a plot 14.75 feet by 72 feet (4.5 meters by 22 meters) (Moore et al. 1983).
Many original laboratory rainfall simulators were of the nozzle type, presumably due to ease of construction. Laboratory drop-former simulators emerged later in response to uncertainties associated with nozzle-generated drop sizes, distributions and intensities. In the past decade, about 40 different rainfall simulators have been used in erosion-related research, as reported in more than a dozen journals, of which around 80% were the nozzle type and the remainder variations on the drop-former type. (See full report at http://ucanr.org/u.cfm?id=48 for a summary of rainfall simulator characteristics.) Two rainfall simulators used in a variety of field environments across a range of slopes for roughly 1-square-meter plots have emerged as de facto standards: the oscillating veejet nozzle system (Paige et al. 2003) and the needle drop-former (Battany and Grismer 2000). Assuming cost and portability of the two are relatively equivalent, the differences are related to their simulated rainfall characteristics. Simple drop-former designs are commonly used where access is more difficult or water availability is limited.

Standardization of erosion studies using rainfall simulators would allow more effective comparisons and data analysis. Above, a collection frame after a simulation near Lake Tahoe.
Method evaluations.
Rainfall simulators have been widely used to assess erosion control or treatment technologies. Sutherland (1998a, 1998b) noted that the “formative years” prior to around 1990 produced a mass of information that lacked scientifically credible, standardized methods or data from actual applications. His arguments for standardized evaluation methods that have field applicability, with greater emphasis on the study of surface or near-surface processes controlling erosion, remain valid more than a decade later.
Relatively portable rainfall simulators have been more commonly deployed in the past two or three decades with corresponding plots of 1 or 2 square yards that are well suited to a wide range of field studies, particularly where access is difficult or when multiple replications are needed across a large area. They have been used to study runoff and erosion mechanisms in a wide range of environments; however, in practice these rainfall simulators necessarily fail to accurately replicate natural rainfall characteristics, due to their portability, cost design or management limitations. While runoff and erosion rates from rangeland and forest soils are generally much lower than that from bare and disturbed soils, these latter soils often comprise substantially larger areas within watersheds and as a result may contribute significant loading to streams.
However, there have been few direct field measurements of runoff and erosion rates, or modeling approaches capable of predicting these rates, from less-disturbed forest and rangeland soils (Grismer 2012). Meyer (1988) contended that simulated rainfall results only give relative, rather than absolute, erosion data, and that to correlate the simulation results to that of natural events, data from similar plots subject to long-term natural rainfall events must be available for comparison (Hamed et al. 2002). Nonetheless, rainfall simulators in the field continue to be developed and used as few replacements are available for generating physical process–based erosion information.
Field methodologies.
The area of simulated rainfall coverage is inherently limited by the rainfall simulator, slope, available water and the possibility of replication, so small field-plot erosion studies are necessarily compromised by sampling issues relative to the larger landscape. Methodological variations and sources of uncertainty regarding the comparison of results include water supply (water chemistry and soil interaction); simulated rainfall characteristics (e.g., drop size, intensity and kinetic energy); plot runoff frame size and installation; runoff sampling size, frequency and duration; the identification of plot cover, slope and surface soil conditions; the measurement of inter-rill erosion, rill erosion or combinations; plot replication or the degree to which plots represent hill slope conditions; and the interpretation of runoff sediment sampling relative to local soil, cover and climate conditions. At a minimum, each of these should be addressed in research deploying rainfall simulators to facilitate comparisons between studies.
Scalability issues
In most forested catchments, the main sources of stream sediment are erosion associated with disturbances such as dirt access roads (for logging and fire control), and log skid trails and channel incisions linked to increased overland flows following disturbances. Nonetheless, rainfall simulator erosion evaluations are conducted in the field to guide general assessments of hill slope and catchment runoff and the erosion rates associated with different soils and land uses. Scaling up to the hill slope or catchment involves at least three issues beyond the scope of small-plot rainfall simulator studies: (1) the natural heterogeneity of soil conditions (e.g., infiltration and erosion rates) across the hill slope, or plot-to-plot variability; (2) the interConnectivity between measured and nonmeasured areas, or between eroding and depositional areas; and (3) soil plot disturbance effects as a result of the rainfall simulator measurements themselves.
Le Bissonnais et al. (1998) noted the need to consider the spatial structure of the catchment, while Garcia-Ruiz et al. (2010) and others have highlighted that connectivity with fluvial channels is the most important factor linking plot to catchment studies. Both studies underscored the importance of considering various spatial and temporal scales, since it is well known that geomorphic and hydrological processes are scale dependent.
Some of the issues associated with field variability, including that introduced by experimental design of the erosion plot (Zöbisch et al. 1996), were recognized more than a decade ago (Bagarello and Ferro 1998). Unexplained variability between erosion test-plot results, even in apparently homogeneous, cultivated fields (Rüttimann et al. 1995), remains perplexing and limits the development of more generalized conclusions about runoff and erosion rates (Gómez et al. 2001). Variability of 30% to 75% between plots located on a seemingly homogeneous landscape is common (Foltz et al. 2012; Grismer and Hogan 2004; Nearing et al. 1999). At the same time, knowledge is needed about soil erosion processes occurring in field plots across a range of sizes, the threshold limits at which different processes are significant and the factors that determine natural variability (Bagarello and Ferro 2004).
Boix-Fayos et al. (2006) sought to review these issues within the following framework: “(i) temporal and spatial scales, (ii) representation of natural conditions, (iii) the disturbance of natural conditions and (iv) accounting for the complexity of ecosystem interactions.” Ultimately, the uncertainties associated with these issues are set aside so that erosion predictions can be made as part of watershed process modeling, to evaluate the effects of changing landscape conditions on watershed health and the quality of discharge water.
The research related to scaling erosion estimates from plot-based measurements to the entire hill slope or catchment is conflicting. Grismer (2012) used 1-square-meter rainfall simulator erosion test plots to relate sediment yields to soil type, condition and slope, in order to model daily sediment loads from paired 630-and 1,300-acre watersheds on the Tahoe Basin west shore. Unfortunately, actual field data on infiltration and erosion rates at different spatial scales from one to tens of meters are difficult to obtain, and little can be found in the literature (Bagarello and Ferro 2004, 2010), since most field measurements have concentrated on water erosion at the runoff plot scale (Poesen and Hooke 1997).
Key questions
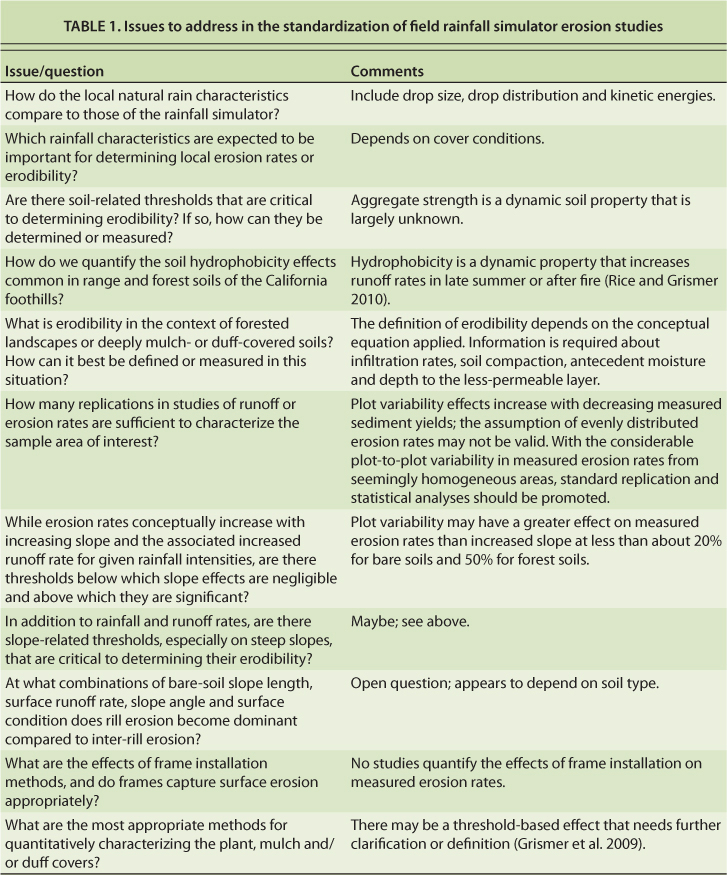
The lack of quantitative, physical-process-based information about infiltration, runoff and erosion rates from forest and range conditions suggests that rainfall simulators will continue to be used for decades to come. A standardized methodology for rainfall simulator design, runoff frame installation and the analysis of results needs to be developed and applied to all studies as they attempt to address key issues (table 1).
Citations
Standards vary in studies using rainfall simulators to evaluate erosion

