


All Issues
Community Supported Agriculture is thriving in the Central Valley
Publication Information
California Agriculture 66(1):8-14. https://doi.org/10.3733/ca.v066n01p8
Published online January 01, 2012
Abstract
Community Supported Agriculture operations (CSAs) have grown rapidly in recent years. The original model, in which members support a farming operation by paying for produce in advance and receive a share of the farm's produce in return, has been adapted, with much innovation. Since little research existed on CSAs in the Central Valley, we surveyed and carried out in-depth interviews with 54 CSA farmers and two CSA organizers in the Central Valley and surrounding foothills. Here we focus on four aspects of these CSA operations: type, economic viability, farmer characteristics and farm attributes. We found two main CSA models, box and membership/share. Fifty-four percent of the CSAs reported being profitable, and the average gross sales per acre were $9,084. CSA farmers are diverse in political orientation, yet are generally younger, better educated and more likely to be women than the general farming population. CSA farms are relatively small, with a median size of 20 acres; have a median membership of 60 (585 average); use agroecological methods; cultivate agrobiodiversity; and utilize growing practices that generally meet or exceed National Organic Program standards.
Full text
Community Supported Agriculture (CSA) connects farmers and the consumers of their products. In the original CSA model, members support a farm by paying in advance, and in return they receive a share of the farm's produce; members also share in production risks, such as a low crop harvest following unfavorable weather.

There are more than 3,500 Community Supported Agriculture operations in the United States. Farmers generally supply boxes of fresh, seasonal produce to their members weekly.
An important social invention in industrialized countries, Community Supported Agriculture addresses problems at the nexus of agriculture, environment and society. These include a decreasing proportion of the “food dollar” going to farmers, financial barriers for new farmers, large-scale scares from foodborne illness, resource depletion and environmental degradation. Together with farmers markets, farm stands, U-picks and agritourism, CSAs constitute a “civic agriculture” that is re-embedding agricultural production in more sustainable social and ecological relationships, maintaining economic viability for small- and medium-scale farmers and fulfilling the non–farm-based population's increasing desire to reconnect with their food (Feenstra 1994; Hinrichs 2000; Lyson 2004).
The first two CSAs in the United States formed in the mid-1980s on the East Coast (Adam 2006). By 1994, there were 450 CSAs nationally (Feenstra 1994), and by 2004 the number had nearly quadrupled to 1,700 (McFadden 2004). There were an estimated 3,637 CSAs in the United States by 2009 (Galt 2011). This rapid expansion left us knowing little about CSA farmers and farms and raised questions about their social, economic and environmental characteristics. Knowing these features of CSAs would allow for more-precise policy interventions to support and extend these kinds of operations, and could inform more in-depth analyses, in addition to giving farmers and the public a better understanding of them.
CSA interviews and survey
We conducted a study of CSAs in 25 counties in California's Central Valley and its surrounding foothills — from Tehama in the north to Kern in the south, and Contra Costa in the west to Tuolomne to the east. The valley's Mediterranean climate, combined with its irrigation infrastructure, fertile soil, early agrarian capitalism and technological innovation have made it world renowned for agricultural production (Walker 2004). In addition to its agricultural focus, we chose this region because we wanted to learn about how CSAs were adapting to the unique context of the Central Valley. Many of the region's social characteristics — relatively low incomes, high unemployment rates and conservative politics — differ from those in other regions where CSAs are popular, such as the greater San Francisco Bay Area and Santa Cruz (Galt 2011; Schnell 2007).
An initial list was compiled from seven websites that list CSAs in the state: Biodynamic Farming and Gardening Association, California Certified Organic Farmers, Community Alliance with Family Farmers, Eat Well Guide, LocalHarvest, the Robyn Van En Center and Rodale Institute. Of the 276 CSAs that we found, 101 were in our study area. We contacted them by e-mail and phone. It became evident that some did not correspond, even loosely, to the definition of a CSA in which members share risks with the farm and pay in advance for a full season of shares. As the study progressed, we revised our definition of a CSA to mean an operation that is farm based and makes regular direct sales of local farm goods to member households. We removed some CSAs that did not meet the revised definition, based on operation descriptions on their websites or details provided by phone or e-mail if a website was not available. Some interviews that we had already completed could not be used for our analysis because the operations did not meet the revised definition.
As the study progressed, we augmented the initial list with snowball sampling by asking participating farmers about other CSAs, which added 21 CSAs. Of these 122 farms, 28 were no longer operating as CSAs, seven turned out to be CSA contributors without primary responsibility for shares and 13 did not meet our revised CSA definition. We called the 28 CSAs no longer operating “ghost CSAs” because of their continued presence on online lists. We do not know the fate of 15 ghost CSAs, as no definite statement of closure could be found and all contact attempts failed. Of the other 13, some left farming, some were still farming but without CSAs, and one moved out of state and continues to farm. Removing all of these from the study left 74 CSAs that met our definition.
Primary data collection occurred from January 2010 to April 2011 and involved two components: a semistructured interview and a survey conducted through an online questionnaire. All 74 CSAs were contacted by phone and e-mail. Fifty-four CSA farmers and two CSA organizers, together representing 55 CSAs, agreed to participate in the study and were interviewed. In most cases, we interviewed the farmers directly responsible for the CSA operation, but two cases were different. In one, a CSA organizer worked with two farms to create an independent CSA; one of these farms also had its own CSA, while the other farm only sold through the CSA run by the organizer — these two farms and the organizer count as two CSAs. In the other case, the CSA organizer brought many farmers, none of whom have their own CSA, together to form one CSA.
Forty-eight of the 54 CSA farmers interviewed completed the survey; the others did not after repeated reminders. We did not request survey responses from the CSA organizers. We used the qualitative data from farmers and the two CSA organizers who did not complete the questionnaire, but we were unable to include their information for most quantitative data. Qualitative data was analyzed through coding responses to specific questions. We analyzed the quantitative data by creating summary statistics of various characteristics, with some bivariate statistical analysis.
Two main types of CSAs
In the interviews, we asked CSA farmers about the prices for their CSA shares, how their CSA delivery systems worked, whether they bought supplemental produce from other farms, and the extent that they used volunteers on the farm; and in the survey, we asked about the types of food and other products in their shares, minimum payment periods and events hosted at the CSAs. As a result, CSA types emerged that differed from our original conception of a CSA — that members shared risk with the farm and paid for a full season up front. None of the CSAs had a formal core member group deciding what to produce, none had mandatory member workdays, and many did not require long minimum payment periods or share production risks with members.
We found two main CSA types:
Box model.
The box model is a farm subscription. Of the 48 farms that responded to the online survey, 46 used this model. Members pay up front, though the minimum payment period varies from a week to a full season. Payments are made in advance of receiving the product, so a minimum payment period of 1 month means that the member pays for four boxes before receiving any box. The average minimum payment time was 8 weeks, while the median was 1 month. Box-model CSAs used different distribution systems, including on-farm pickup, neighborhood or institutional drop-off sites and door-to-door delivery.
The box model had three subtypes. A single-farm box CSA produces the majority of foods in its box; 34 of the 46 box-model farms were this type. Many offered other farms' produce as occasional additions, or as optional add-ons (such as fruit or eggs) for purchase.
A collaborative box CSA consists of several farms cooperatively marketing their products and managing the CSA; seven of the 46 box-model farms worked this way. These CSAs sometimes have organizers who are independent of the farms (Flora and Bregendahl 2007).
A farm-linked aggregator box CSA is a business tightly linked to a single farm that combines the farm's produce with produce consistently purchased from other farms or a wholesale market. Five of the 46 box-model farms had chosen this approach. Most required no upfront payment and allowed customers to customize the produce in their box. We did not consider nonfarm aggregators to be CSAs and therefore excluded them from our study. Nonfarm aggregators grow nothing themselves; they are retailers who purchase produce from a wholesale market or from farms not directly connected with their business. Although not included in our study, nonfarm aggregators often call themselves CSAs and place themselves on online CSA listings.
Membership/share model.
The membership/share model requires customers to make an upfront membership or share payment. It is rare; only four of the 48 CSAs operated this way. Two of the four CSAs used only the membership model; the other two combined it with the box models by offering member discounts. The membership payment is paid prior to actually picking up the produce. Members give the farmer some amount of money, which becomes credit for use at the farm's U-pick, farm stand or farmers market stall. Members do not pick up a set amount of produce but are able to pick and choose, and receive a discount by paying in advance.
With share payments, members can sign a contract to own a share of a farm animal, and the share payment covers the animal's feed. The member then purchases that animal's products. The member does not get any discount for their share but is able to gain access to locally raised and processed animal products, which are not widely available in the region. He or she is also sharing the risks associated with raising livestock with the rancher or farmer.
Innovations in CSAs
These differently arranged enterprises, all called CSAs by their operators, demonstrate a central finding: Much innovation is occurring in how farmers and consumer members connect through a CSA. Farmers have adapted the CSA model to their ambitions for their farm, to innovative products and to regional conditions. CSA farmers have different preferences for their operations. Some want to remain small, while others want to grow; these goals require different strategies. Farmers have added new products, especially meat and dairy, into their CSAs, although the processing of those products does not fit easily with handling practices developed for fruits and vegetables.
Other innovations include changing CSA payment and delivery systems so that they are more attractive and accessible to people who are not familiar with the concept and to consumers who cannot afford a large upfront cost, both of which are important realities in the Central Valley. For example, 20% of CSAs in the study had no minimum payment period, allowing week-by-week payments, which extends membership to a broader population, including those hesitant or unable to commit to extended payments.
Requiring no long-term commitment was also a common practice among meat CSAs in our sample, which often do not know exactly which products will be available and when, including both individual cuts and type of meats.
This uncertainty stems from maturation, slaughtering and butchering processes. Few slaughter and butcher facilities serve small-scale producers. Consequently, CSA meat producers compete with large-scale operations for limited processing capacity, and there is greater variability in their animals' maturation because they are raised primarily on pasture. Scheduling difficulties can result; for example, during the summer, CSA ranchers may need to schedule slaughtering months in advance, but their animals may not be ready by the scheduled date. Meat CSAs rely on committed customers who agree, typically on a monthly basis, to buy some amount of a variety of meat.
Economic viability
To understand their economic viability, we asked CSA farmers about gross annual sales and net profits in 2009, the CSA's contribution to the total economic activity of the farm, other marketing channels used and how the farmers valued their labor. In the survey, we asked about whether partners held off-farm jobs and the CSA's general profitability. We found that the CSA was a crucial direct-to-consumer marketing channel for the small- and medium-scale farmers in our study. On average, the farmers obtained 58% of gross sales from their CSA. In general, small-scale farmers were more dependent on their CSA than larger-scale CSA farmers. Most farmers also sell into other channels, including wholesale and direct-marketing venues, especially farmers markets. Some farm-linked aggregator box CSAs act as wholesale outlets for small farms with their own CSAs.
Farmers in our study commonly chose the CSA as a marketing outlet to diversify their income channels. Some had little access to organic wholesale markets, while others wanted to increase sales beyond farmers markets and other direct sales. Some newer farmers started with a CSA to help raise needed capital. As motivations for choosing a CSA, most respondents mentioned the advantages of knowing sales volumes in advance and being paid up front, before the growing season begins.
Assessing the economic viability of CSA operations is difficult because it involves both the baseline profitability of the business and the need to generate sufficient income for retirement, health insurance, college for children, land purchases and so on. In addition, farmers conceptualize profit differently. Some consider their salaries as profit, while others set aside a salary for farm partners and consider profit to exclude this salary. Not all farmers amortize their accounting, and many reinvest surpluses in the farm to make it more productive or reduce taxes. Consequently, we asked a variety of questions about farm economics.
Profitability.
Regarding profitability, 54% of the respondents indicated that their CSA was profitable, 32% broke even and 15% operated at a loss. One-third said that they paid themselves a salary in 2009, ranging from $3,600 to $100,000 annually, with a median of $60,000. The majority, however, reported living off operating surpluses, taking, as farmer 32 said, “What's left at the end of the year.”
Off-farm jobs.
Forty-two percent of surveyed farms had partners who held off-farm jobs. Although not strictly comparable, CSA operators tended to be less dependent on off-farm employment than California organic farmers generally, among whom 67.7% have farm partners working off-farm (USDA NASS 2010). However, the CSA farms were similar to U.S. non-CSA farms in having some reliance on off-farm jobs for income, and in the lack of profitability of some operations and infrequency of formal salaries.
Gross sales.
Another way we looked at economic viability was by asking about gross farm sales from all market channels (including the CSA), which in 2009 ranged from a few thousand dollars to multiple millions, with a median of $57,000. Since CSAs vary greatly in size, standardizing gross sales by farm size was important. The median gross sales per acre were $4,341 for all CSAs in our study, while the mean was $9,084. These figures for CSA farms are considerably higher than for California agriculture generally — where the mean gross sales per acre is $1,336 (USDA NASS 2010) — and almost all other kinds of organic agriculture in California (fig. 1). When we focused only on crop-oriented CSAs and looked at gross sales per acre, the average for CSAs was $13,354 and the median was $10,000 (fig. 1).

Fig. 1. Mean gross sales per acre for CSAs in the study compared with that of organic agriculture in California, and by crop type. CSAs have comparatively high gross sales per acre. Sources: (1) USDA NASS 2010, (2) Klonsky 2004, (3) authors' field work.
Farmer motivations
When we asked farmers in the interviews why they wanted to do a CSA and the general philosophy behind their farm and CSA operation, most were not interested solely in maximizing sales, profit or their salaries. When asked about their motivations and farming philosophy, CSA farmers said they loved farming, felt satisfaction in providing fresh food to their communities and educating people about food and agriculture, and wanted to make positive change. As one farmer noted, “The world's messed up, and we're fixing it — one family at a time, one farm at a time” (farmer 44). Although that sentiment was common, CSA farmers' political commitments ranged from libertarianism to socialism to evangelical Christianity to feminism. We also found a diversity of views on the CSA as a business: Many saw their CSA as promoting their deeply held values, independent of maximizing profit. For example, one newer CSA farmer said: “I really want to empower other women to work in sustainable agriculture … Almost all our applications for internships are from women, probably 75%, but there aren't that many women farmers” (farmer 56A).
CSA farmers frequently mentioned receiving nonmonetary forms of compensation: tangible benefits such as living and/ or raising children on a farm, benefiting from improvements to the property, eating well and living healthfully; and intangible ones such as the lifestyle and deeply rewarding hard work. One farmer noted: “We don't keep track of hours' cause that would be depressing from a pay standpoint. But we just love it. We probably should [do time tracking], but on the other hand, it's part of the lifestyle. It isn't jobby at all. We have what we need to get by, but we don't pay ourselves an official wage” (farmer 50).
Some farmers in our study ran their CSAs to make money, although all did so within the context of broader social and environmental commitments. As an example, farmer 39A and farmer 39B, a husband and wife team, respectively said their philosophy for the CSA was to “make money to send children to college,” and “capitalism — you have to be greedy, grubbing capitalists.” However, they went on to illustrate their underlying environmental and social commitments. When farmer 39A said, “We always try to be the top of the market in terms of quality and price,” farmer 39B added that they value growing the “most nutrient-dense food [and] finding a supportive community to reward us for doing it.” Driving home the point that their profit orientation is securely underpinned by a broader ethos, farmer 39A added, “We are also committed to offering our employees year-round employment in a toxic-free environment.”
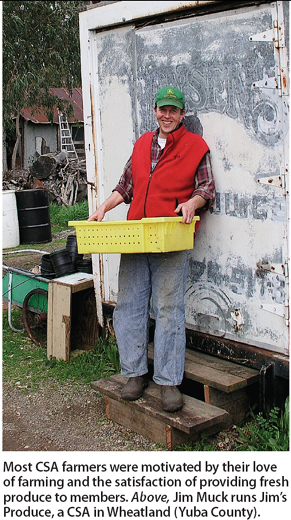
Most CSA farmers were motivated by their love of farming and the satisfaction of providing fresh produce to members. Above, Jim Muck runs Jim's Produce, a CSA in Wheatland (Yuba County).
Characteristics of CSA farmers
The survey asked for demographic information on up to six farm partners, people who are essential players in farm management or operations. The majority (69%) of CSAs studied had more than one partner; the average number was 2.7, while the median was 2. We collected data on 115 farm partners in charge of the 48 CSA farms that completed the survey.
We studied the characteristics of two categories of CSA farmers: “farmer A,” which, following Lass et al. (2003), is the partner whose information was completed first in the survey and was assumed to be closest to the USDA category of “primary operator” (we did not require respondents to identify a primary operator); and CSA farmers as a general category, for which we pooled data on all 115 CSA partners.
Age.
CSA farmers were comparatively young. On average, farmer A was 43 years old, while CSA farm partners were 42 years old. In comparison, the average U.S. farmer's age is 57 (USDA NASS 2009b).
Women.
Women made up 35% of farmer As and 40% of the farm partners. Women make up 19.2% of primary operators on California organic farms (USDA NASS 2009a) and 13.9% on farms nationally (USDA NASS 2009b). Although not directly comparable since we did not ask for a principal operator, these figures suggest that a greater proportion of women are in decision-making positions in CSAs than in organic agriculture in California and the United States.
Ethnicity.
CSA farmers in the study tended to be slightly less ethnically diverse than California farmers in general. The vast majority (87%) of CSA farmers self-identified as white, while 6% did not specify an ethnicity, 5% were Latino, 1% were Filipino and 1% were North African/Middle Eastern.
Our study population was more diverse than in CSAs nationwide, where 97% are white/non-Latino (Lass et al. 2003), but less diverse than in California agriculture, where farm operators (with up to three per farm counted in the 2007 Census of Agriculture) are 80% white, 11.8% Latino, 4.5% Asian, 2.4% Native American, 0.5% black and 0.4% Native Hawaiian/other Pacific Islander (USDA NASS 2009a).
Education.
The CSA farmers that we studied were well educated. Seventy-nine percent of farmer As held bachelor's degrees and 13% graduate degrees. For CSA farmers, 82% held bachelor's degrees and 27% graduate degrees. This is considerably higher than for California and U.S. agriculture, where 39% and 24%, respectively, of farmers have completed 4 years or more of college (USDA ERS 2011).
When asked in the interview about how they learned to farm, only 26% of farmers had completed on-farm apprenticeships or internships, despite the fact that these are offered by many CSAs. Instead, many farmers gained knowledge primarily by learning while doing; 55% said they had learned much of what they knew from farming experience or gardening with family members.
Features of CSA farms
We asked many questions about the CSA farms, including survey questions about start year, farm size, area in various land uses, number and kinds of crops and farm animals, general practices in relation to the federal organic standard, electricity generation, farm inputs, water use and land tenure. In the interview, we asked open-ended questions, including “How did you get access to the land you're currently using for your CSA?” and “What practices do you do that you think are most beneficial to the environment?” We found out that most CSAs in our study were relatively new, in existence for 5.7 years on average. CSA farms shared certain core features, especially a commitment to environmental conservation, agroecology (the application of ecological principles in agriculture) and agrobiodiversity (the support of many organisms within agricultural systems, including those directly related to food production, like crops, and others that exist on or move through the farm, such as predators). The farms were diverse across a range of characteristics, including farm size, land ownership, organic certification and membership numbers.
Agroecology.
CSA production is generally based on agroecological methods (Altieri 1995). Two-thirds of CSA farmers in our study used green manures for fertilization, a practice abandoned in the 1940s by most farmers in the United States, who rely now on synthetic nitrogen. Eighty-two percent of CSA farmers in our study used animal manures or green manures, compared with 49% of California organic growers (USDA NASS 2010), suggesting more commitment among CSA farmers to maintaining on-farm or near-farm nutrient cycles.
Agrobiodiversity.
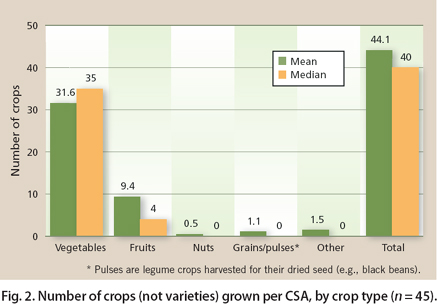
CSA farmers in our study cultivated a tremendous amount of agrobiodiversity, growing 44 crops (fig. 2) and raising three types of livestock on average. Most CSAs studied focused on vegetables, although some were exclusively focused on fruit, one on grain, and a handful on meat and other animal products. About half of CSAs studied (49%) had livestock in 2009. The most common animals were layer chickens (43%), followed by hogs and pigs (23%), goats and kids (21%) and broilers, sheep and lambs, and beef cattle (13% each).
Many CSA farms also had some land devoted to conservation plantings, such as hedgerows where birds and beneficial insects can live. As one farmer noted, “I have a very strong view that agriculture doesn't need to and shouldn't decrease the vitality, the biodiversity of the environment … [agriculture] can actually enhance it” (farmer 2). In the Central Valley, the CSA farmers' commitment to agrobiodiversity contrasts with the monocultures that dominate the landscape.
Agrobiodiversity is supported by the unique nature of CSAs. Many farmers noted that providing diversity in the box is a key strategy for maintaining CSA members, and that this had translated directly into diversity in crops and varieties on the farm.
Regarding her CSA's first member survey, one farmer noted that members wanted “more fruit and more diversity. We immediately planted fruit trees and told our members, ‘We are planting these fruit trees for you; wait 4 years for some peaches’” (farmer 1).
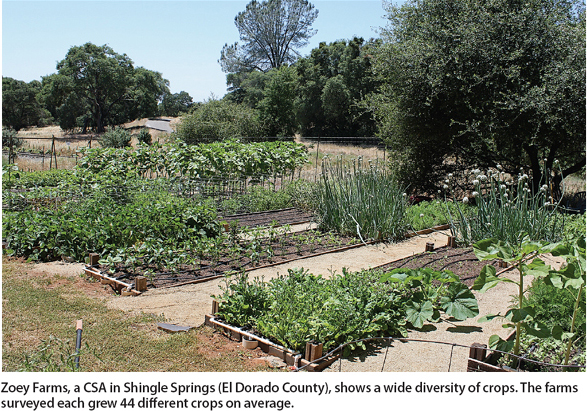
Zoey Farms, a CSA in Shingle Springs (El Dorado County), shows a wide diversity of crops. The farms surveyed each grew 44 different crops on average.
Resource use.
CSA farmers were conscious of their use of resources, including fossil fuels, farm inputs, packing materials and electricity. Twenty-two percent had on-farm renewable energy production, mostly solar, considerably higher than the 1.1% average for U.S. farms (USDA NASS 2009b).
Farm size.
While the above characteristics were widely shared, CSA farms exhibited differences in other traits, including farm size. The median CSA farm size in our study was 20 acres, while the average was 151 acres. In comparison, 20 acres is the median size of California farms, and the average is 313 acres (USDA NASS 2009a). CSA farm acreage devoted to cropland in our study ranged from under 1 acre to hundreds of acres, with a median of 6.3 acres and 41 acres on average.
Land tenure.
The land tenure arrangements that we found were diverse. Forty percent of CSA operators owned the land they farmed, 25% owned some of their land and rented the rest, and 35% rented their land. There were three main types of rental arrangements: Of CSAs that rented, 55% had an agreement at below market value due to a service provided by the farmer to family or other close relationships; 45% had leases at market value; and 10% had a sharecropping arrangement, where the farmer promised a certain percentage of their crop to the landowner (usually just a CSA share).
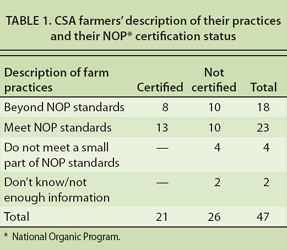
Organic certification.
Forty-five percent of CSAs in our study were certified organic, although 87% of farmers reported meeting or exceeding National Organic Program (NOP) standards (table 1). CSA farm practices described as “beyond organic” came up consistently. Beyond organic refers to methods that exceed those specified in the National Organic Program (NOP) and are seen as more true to the original conception of organic. Across both certified organic CSAs and noncertified CSAs who follow the letter of NOP rules but do not call themselves organic, many described their practices that way (table 1).
Membership.
Membership in the CSA farms that we studied ranged by several orders of magnitude (table 2), from more than 10,000 members to fewer than 10. The median CSA membership in 2009 was 60, and the average was 585. In our study, the rapid rise of CSA operations since 2000 was accompanied by an even larger growth in CSA membership (fig. 3). From 1990 to 2010, CSA membership increased by 49 times (4,900%). By decades, membership grew 3.4 times between 1990 and 2000, and 14.2 times from 2000 to 2010. Farmers noted a membership boom between 2005 and 2008, but between 2008 and 2009, at the height of the Great Recession, 22 farms reported gaining members, six maintained members and eight lost members (fig. 4). Many farmers who experienced membership declines noted the difficult economic situation as the likely reason. From 2008 to 2009, the median annual growth rate for those that experienced membership growth was 50%, while the median loss rate was 24% for CSAs that lost members.
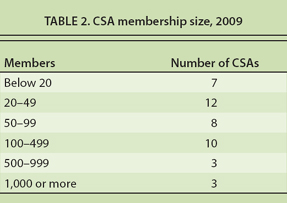

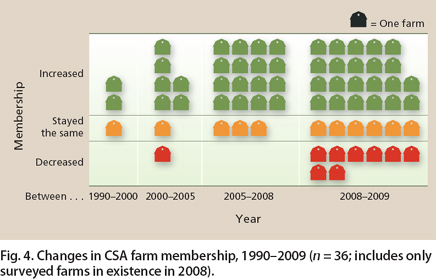
Fig. 4. Changes in CSA farm membership, 1990–2009 (n = 36; includes only surveyed farms in existence in 2008).
Multiple benefits of CSAs
Community Supported Agriculture appeals to an increasing number of people. In recent decades, CSA farm and member numbers have grown rapidly in the United States (Galt 2011) and in California's Central Valley and foothills. CSA numbers in our study area grew from a few in the early 1990s to 74 in 2010. The loss of 28 CSAs found in our initial online search, which were actually defunct when contacted, merits further research. Membership growth has similarly exploded: CSA membership in our sample increased from less than 700 in 1990 to almost 33,000 expected members in 2010. CSA membership characteristics also deserve further study.
The CSA expansion has been accompanied by innovation in CSA types. The CSA concept appears to be both robust and flexible, and different CSA operations are using it to address different challenges. The motivations of farmers for creating CSAs are diverse; ideological predispositions vary greatly, as do farmer attitudes around CSAs as a business and their practices for paying themselves. The diversity of CSA types, and the loose adherence to many of the features of the original concept of CSA, brings into question whether the original model met the needs of the California population. Expanding market opportunities for CSA farmers could involve further adaptations to reach consumers not commonly involved, such as participants in USDA's nutritional assistance programs, including the Special Supplemental Nutrition Program for Women, Infants and Children (WIC) (see page 15 ).
Despite the diversity of types we identified, CSAs in our study retained a number of core characteristics. Namely, the vast majority of CSA farmers in the Central Valley cultivated high levels of agrobiodiversity, were committed to agroecological practice and embodied an ethic of reducing off-farm resource use. CSA farmers in our study were also dedicated to enhancing the environment on and off their farms and to providing healthy food to their communities. Our study also revealed that CSAs in the Central Valley and surrounding foothills share characteristics with CSAs nationwide: Smaller-scale CSA farmers are more dependent upon the CSA as a market outlet; CSAs are less dependent upon off-farm work than U.S. agriculture generally; CSA farmers are younger, less diverse ethnically, more likely to be women and more formally educated than the general farming population; and CSA farming practices demonstrate strong commitments to environmental ethics (Anderson-Wilk 2007; DeLind and Ferguson 1999; Lass et al. 2003).
CSAs are an increasingly important form of direct marketing, crucial for smaller farms. The gross sales per acre of CSAs were considerably higher in our study than of almost all other agricultural endeavors, even in California where gross sales per acre are high. Although most CSAs are profitable, CSAs are like other forms of U.S. farming in often requiring farm partners to work off farm. Even though a CSA is hard work, farmers tend to find it rewarding. The vast majority were happy with their work and continued to view the CSA as a viable option for small- and medium-scale farmers.
Overall, CSAs provide an increasingly important marketing option for Central Valley and foothill farmers. However, the extent to which existing and new CSAs will be able to expand the movement and collectively increase their market share, rather than increasingly compete with one another for a limited number of members, remains to be seen. With the numerous economic, social and environmental benefits of the CSA model and its growing popularity, it would seem wise to explore the creation of policy instruments, informational clearinghouses, and additional UC Cooperative Extension efforts to support the needs of CSA farmers and members.
Citations
Community Supported Agriculture is thriving in the Central Valley

