


All Issues
Accuracy of cotton-planting forecasts assessed in the San Joaquin Valley
Publication Information
California Agriculture 58(3):164-168. https://doi.org/10.3733/ca.v058n03p164
Published July 01, 2004
PDF | Citation | Permissions
Abstract
In the first evaluation of its kind, we found that the UC Cooperative Extension (UCCE) 5-day degree-day forecast for cotton-planting conditions performed well in Bakersfield and Fresno when compared with the actual, observed temperatures from 1998 to 2002. In most cases, the forecast provided timely advice during the critical cotton-planting period. On average, only 7% of the forecasts failed to predict unfavorable conditions. Better-than-expected weather occurred 9% of the time when unfavorable conditions were forecast. On average during the 22 planting days of March (beginning March 10, the first allowable planting date in the San Joaquin Valley), 2.5 days (11%) were incorrectly forecast to have better-than-unfavorable planting conditions. In April, the cottonplanting forecasts were more reliable, with only 1 day out of 30 (3%), on average, that may have required replanting because of unpredicted, unfavorable conditions.
Full text
Cotton production requires a relatively long period (190 to 210 days) of warm temperatures. The highest cotton yields occur when cotton is planted early under favorable conditions. Many factors influence the success of any particular cotton-planting decision, including soil temperature, seed vigor, air temperature, planting depth, soil moisture, level of soil-borne diseases, fungicide seed treatments and soil salinity.
Planting cotton involves risk. If several cold or wet days follow planting, then plant populations may be too low, requiring growers to replant. It would seem that cotton growers could reduce their risk by waiting to plant until later in the spring, when conditions are warmer, but this approach does not work. Spring weather is variable in any given year, with favorable planting periods scattered throughout March and April. If growers delay, there may not be enough good planting days left in April. Waiting until later to plant also reduces the time needed for plant growth. An earlier planting adds no additional cost and may mean earlier fruiting and increased yields.

The National Weather Service collects data at a series of weather stations in California, to produce air-temperature forecasts that are used by UC Cooperative Extension to calculate “degree-day” forecasts for cotton growers in the southern Central Valley.
Historically, in California and across the U.S. Cotton Belt, soil temperatures at planting have been a primary tool for timing cotton-planting decisions. Since soil temperatures vary greatly throughout the day and with soil depth, the time and method of taking soil temperatures has been standardized. The accepted standard for planting cotton in California is at least 58°F soil temperature measured at 8 a.m. at a 6-inch depth in the center of a cotton bed (Johnson Hake et al. 1996). Until the late 1980s, cotton growers primarily evaluated soil moisture and soil temperatures in the seed bed, then planted during warmer and drier periods of weather with good soil temperatures, and avoided periods when cold weather was predicted soon after planting. With the advent of degree-day forecasting in the late 1980s, growers began timing their planting using this new tool as well.
Degree-days and cotton planting
Cotton is an important crop in California, grown on 870,000 acres—primarily in the southern San Joaquin Valley—for a total value of $658 million in 2002 (CDFA, 2003). In 1987, UC Cooperative Extension (UCCE) introduced a cottonplanting tool using a 5-day degree-day summation (Kerby et al. 1989). This tool provides an indication of the risk to germinating cotton seed based on forecasted air temperatures. Sometimes called heat units, degree-days are the integration of time and temperature above the known developmental baseline temperature of an organism for each day. One degree-day is 1 day (24 hours) during which the average air temperature is 1 degree above the baseline temperature (also known as the “lower developmental threshold temperature”) that is associated with consistent growth for the organism. The 5-day degree-day forecast for cotton planting was developed to quantify the effects of expected weather in order to increase the chances of a successful planting.
Farm Advisor Kater Hake and Specialist Tom Kerby developed this forecasting tool during the mid-1980s (Kerby et al. 1989). It combined a relationship between air temperature and quality of seed on stand establishment, and utilized knowledge of cotton's decreased yields due to chilling injury. The degree-day summation uses a basal developmental threshold of 60°F (cotton growth occurs at 60°F and above) and a single triangle calculation (to estimate air temperature for each hour of the day); it accumulates degree-days based on forecasted high and low temperatures during the 5 days following planting. These researchers established four categories for predicting planting conditions (and hence cotton establishment) based on the forecasted degree-days (table 1A). For example, ideal planting conditions are when the degree-day summation for the 5-day period beginning on the day of planting is greater than 20 degree-days.
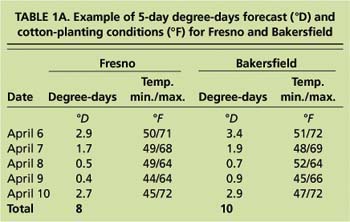
TABLE 1A. Example of 5-day degree-days forecast (°D) and cotton-planting conditions (°F) for Fresno and Bakersfield
For many years, the National Weather Service (NWS) in Hanford calculated the cotton 5-day degree-day forecast for Bakersfield and Fresno. This information was broadcast daily over the National Oceanic and Atmospheric Administration (NOAA) Weather Radio throughout the San Joaquin Valley during the cotton-planting season. When the NWS stopped providing the forecast of cotton-planting conditions, UC cotton advisors and specialists asked the UC Statewide IPM Program (UC IPM) to calculate the 5-day degree-day summations.
In March 1997, the UC IPM information systems group began posting the 5-day degree-day forecasts on the UC IPM Web site ( www.ipm.ucdavis.edu ) each day during cotton-planting season. The page includes a table displaying the forecasts of maximum and minimum air temperature for the next 5 days (including the day of posting) for Bakersfield and Fresno, the daily degree-days calculated from the forecasts, and the total degree-days for the 5-day period, as well as information on how to use the planting forecast. The air-temperature forecasts used in the calculations are generated by the Hanford office of the NWS as part of their standard forecasts for Fresno and Bakersfield. Since the UC IPM Web page is usually prepared after the minimum temperature has occurred, the observed lows for the morning (as reported for the Fresno and Bakersfield airports) are used as the minimum temperatures for the first day of the period. The page is updated each day from March 10 through April 30. (March 10 is the first allowed planting day to provide for a pink bollworm host-free period.)
In 2000, a survey of cotton growers' IPM practices (Brodt et al. 2003) found that 87% used the degree-day forecast in their cotton-planting decisions. This usage was reflected in the number of contacts recorded for the forecast Web site. During the 2000 planting season, the site was accessed 6,343 times (Strand 2000). In addition to this direct access, many consultants and pest control advisors provide this information to clients. This survey provided evidence that the cotton 5-day degree-day forecast is commonly used by California growers to help make planting decisions.
UC IPM resources
The UC Statewide IPM Program Web site has a degree-day calculator that lets any user accumulate degree-days for specific pests, plants and thresholds. The program can use data stored in UC IPM's extensive weather database, or weather data entered by the user.
The weather database holds temperatures, rainfall, solar radiation, relative humidity and wind data for more than 150 California stations that report daily, in addition to 150 long-term climate stations. About 120 of the daily stations, most in agricultural locations, are from the California Department of Water Resources CIMIS (California Irrigation Management Information System) program ( www.cimis.water.ca.gov ).
Growers can get the forecast of cotton-planting conditions from the UC IPM Web site at www.ipm.ucdavis.edu/WEATHER/ or use their local forecast in conjunction with the degree-day calculator.
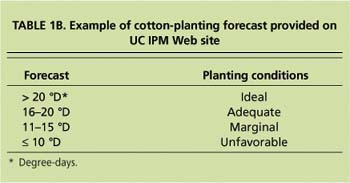
The purpose of our study was to evaluate the accuracy and reliability of the planting forecasts for Bakersfield and Fresno compared to observed airtemperature data for 1998 through 2002. For each date's planting-conditions forecast, the total degree-days for that date and the next 4 days were calculated and the resulting planting-conditions category was determined (table 1B). For comparison, we used data from the 5-day summations of degree-days calculated with the UCIPM degree-day calculator, using daily maximum and minimum air temperatures measured by NWS Automated Surface Observing Systems at the Fresno and Bakersfield airports. This data is routinely reported to NOAA's National Climatic Data Center (NCDC), then retrieved and stored on the UC IPM Web site as Fresno.C and Bakrsfld.C (NCDC station numbers 3257 and 0442, respectively). Although data from weather stations located on agricultural sites is available on the UC IPM Web site, the airport stations were selected for this study because the NWS verifies the accuracy of their Fresno and Bakersfield forecasts against measurements at these two locations. The observed category for cotton-planting conditions (tables 1A and 1B) was determined from the 5-day degree-day summation.
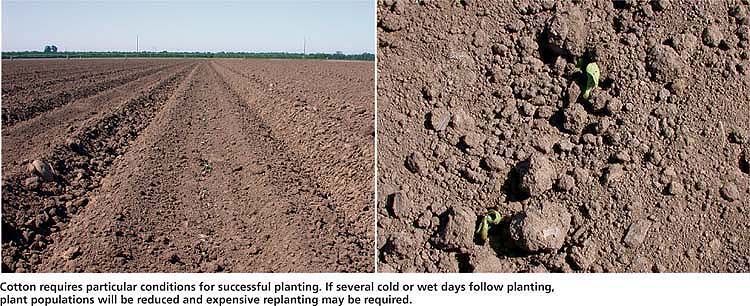
Cotton requires particular conditions for successful planting. If several cold or wet days follow planting, plant populations will be reduced and expensive replanting may be required.
During this 5-year period, 516 maximum and minimum air-temperature forecasts (four forecasts were missing) were used to determine the forecasted category for cotton-planting conditions. Then these were compared to the actual (described here as “observed”) air-temperature data and resulting planting-conditions category for the dates. A chi-square test was applied to the different forecast-to-observed comparisons, to test for goodness-of-fit or independence.
Accuracy of the forecasts
Predicting the weather at any time of year can be a challenge, but predicting 5 days of maximum and minimum air temperatures in the spring can be particularly difficult due to the variable nature of weather at that time. Fortunately, the 5-day degree-day forecast must only predict the correct planting-conditions category, a five or 10 degree-day range (table 1B), rather than be strictly accurate to the actual degree-day total. This is particularly helpful when the 5-day degree-day forecast is unfavorable (10 degree-days or less) or ideal (more than 20 degree-days).
Over the 5 years, accuracy for the Fresno and Bakersfield locations was similar, differing only by 1% or 2% within each category, so the following analysis is based primarily on averages of the two locations. The 5-day degree-day forecasts predicted the correct category (based on comparison with observed temperatures) 75% of the time (table 2). The forecasts significantly overestimated the suitability of conditions for planting (P = 0.0011, n = 84 of 516 total), yet underestimated the planting-conditions category only 57% as often (n = 48 of 516 total). The forecasted planting-conditions category was one higher or lower than the observed category 20% of the time, while it was two categories lower or higher in only 5% of the cases. During the 5-year period, it was never three categories higher or lower.
These numbers give a measure of the overall accuracy of the 5-day high and low temperature forecasts, while taking into account that the cotton-planting forecast needs only to fall within a five degree-day range to be very useful to cotton farmers. The more often the forecast and observed degree-day summations are in the same category, the more useful it is for a grower making planting decisions. Forecasting the correct planting-conditions category 75% of the time provides a very useful tool.

TABLE 2. Five-year (1998-2002) comparison of forecast versus observed 5-day degree-day cotton-planting conditions for Bakersfield and Fresno, March 10 through April 30
When the forecast underestimated the observed category, actual air temperatures and resulting planting conditions were more favorable than predicted. This occurred in 9% of the forecasts. If the forecast indicated unfavorable or marginal planting conditions, this error would probably result in delayed cotton plantings. However, delaying planting by a few days is not a serious error, especially if planting can be resumed during better-than-expected conditions.
When the forecast overestimated the planting category, conditions were less favorable to cotton planting than predicted. This error is potentially more serious than underestimation and occurred 16% of the time. The most serious error occurred when the predicted category was in the marginal or adequate categories, but the observed category was unfavorable. This error occurred in 7% of the cases during the 5-year period. If cotton was planted under these conditions, it would likely need to be replanted, resulting in potentially lower yields due to a shorter season, and additional management expenses such as irrigation, plant growth regulators and late-season insecticides. For example, most San Joaquin Valley cotton is planted in April and it can take from 10 to 20 days after the first planting to make a decision about whether to replant. Each day's delay after April 15 can result in a 1% to 2% yield reduction per day (Johnson-Hake et al. 1996; Wright et al. 1998).
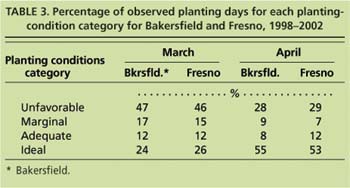
TABLE 3. Percentage of observed planting days for each planting-condition category for Bakersfield and Fresno, 1998-2002
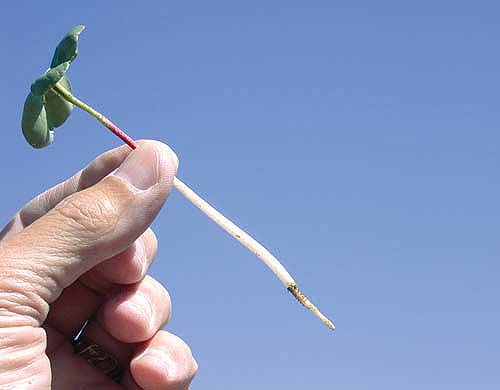
Young cotton plants need the right combination of soil temperature, seed vigor, air temperature, planting depth, soil moisture and other factors to thrive.
Degree-day distribution
On average at both locations, most of the observed 5-day degree-day totals during the planting period fell into the extreme categories of unfavorable or ideal (table 3). Averaged over both locations, for 72% of the days in March and 82% of the days in April, the observed degree-day totals were in these extreme categories. Observed totals for only 28% of the March planting days and 18% of the April planting days were in the adequate and marginal categories. April had more than twice the ideal planting days compared with March, and the distribution of the categories significantly differed between the months (X2 = 48.4, P < 0.0001).
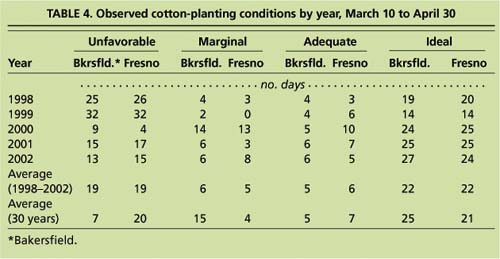
As expected with variable spring weather, there were significant year-to-year variations (X2 = 85.7, P < 0.0001) in the distribution of observed degree-day categories. The total number of days in the unfavorable category varied from 4 days in Fresno to 32 days in both Bakersfield and Fresno over the 5-year period (table 4). The ideal category had a smaller range of 14 days for both Bakersfield and Fresno to 27 days for Bakersfield, with an average of 22 days per year. The average degree-day distribution between the four categories for this 5-year period was similar to the 30-year averages for the Bakersfield and Fresno NOAA stations (table 4), except for the unfavorable and marginal planting conditions for Bakersfield.
Unpredicted unfavorable weather
The most serious error occurred when the forecast failed to predict unfavorable planting conditions. There was no significant difference (P = 1.0000) between the errors for Bakersfield and Fresno. These errors averaged 3.5 days per year (table 5).
There was significant (X2 = 66.9, P < 0.0001) year-to-year variability (table 5). The forecast failed to predict the occurrence of unfavorable planting conditions on only 1 day in Fresno during the 2002 planting period, compared with 7 days in Bakersfield in 2000.

TABLE 5. Number of days when better-than-unfavorable planting conditions were forecast, but unfavorable conditions were observed
On average over the 5 years, 2.5 and 1.0 of the days predicted for better-than-unfavorable planting conditions in March and April, respectively, were actually unfavorable planting days (table 5). Because there are only 22 potential planting days in March (March 10 to 31) but 30 days in April, a potential March planting day is three times more likely than one in April to be forecast for better-than-unfavorable, but have unfavorable planting conditions (X2= 19.5, P < 0.0001). Planting on days with incorrectly forecast better-than-unfavorable conditions can require subsequent replanting and increase production costs, while eroding grower confidence in the forecast.
The planting-condition categories take into account the effects of seed quality on cotton stand establishment (Kerby et al. 1987). With highquality seed, planting during cooler conditions is less risky than when seed quality is marginal. Also, the cost of replanting when this error occurs may be more than offset by the higher yields typically obtained with successful earlier planting.
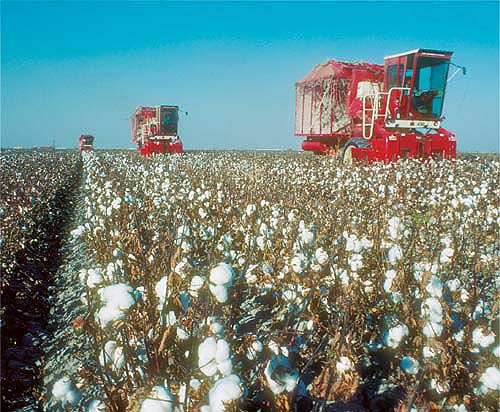
In California, cotton is planted between March 10 and the end of April to maximize yield and provide for an as-early-as-possible harvest, above. In the 5 years studied, the 5-day degree-day forecast was a reliable predictor of actual cotton-planting conditions.
By planting only on days in March with ideal category forecasts, growers can avoid negative results from the forcasts' tendency to overestimate conditions, since unfavorable conditions were never observed when the forecasts were in the ideal category. Over the 5-year period, on 25% of the potential planting days in March there were ideal planting conditions.
In April, planting cotton during unpredicted unfavorable conditions—and then having to replant—is more expensive, due to increased production costs and lower yields. Ten to 20 potential growing days may be lost while the grower decides whether replanting is necessary. Fortunately, on average, this situation occurred on only 1 out of 30 days in April.
Accuracy of cotton-planting forecasts assessed in the San Joaquin Valley

