


All Issues
Drip irrigation evaluated in Santa Maria Valley strawberries
Publication Information
California Agriculture 58(1):48-53. https://doi.org/10.3733/ca.v058n01p48
Published January 01, 2004
PDF | Citation | Permissions
Abstract
About 4,000 acres of strawberries are grown in the Santa Maria Valley using drip irrigation. In order to help growers irrigate more effectively, we conducted studies to determine crop evapotranspiration; irrigation system performance; patterns and levels of soil salinity; soil moisture content around drip lines; and irrigation water quality. We also developed canopy growth curves. Results at 13 sampling locations showed maximum canopy coverage of less than 75%. Crop evapotranspiration ranged from 12.2 inches to 15.6 inches. Irrigation-system evaluations revealed that most of the distribution uniformities were greater than 80%, considered acceptable. The electrical conductivities of the irrigation water ranged from 1 deciSiemens per meter (dS/m) to 2.36 dS/m; levels over 1 dS/m could result in yield reductions in strawberries. However, 79% of the samples had electrical conductivities equal to or less than 1.5 dS/m. Levels of soil salinity in the vicinity of drip lines ranged from 1 dS/m to 3.5 dS/m. This information can help growers calculate crop water needs and estimate irrigation set times.
Full text
About 4,000 acres of strawberries are grown in the Santa Maria Valley, a small, triangular valley about 25 miles long and 10 miles wide located along the central California coast between San Luis Obispo and Santa Barbara. Strawberries in the valley are irrigated solely by drip irrigation. As is often the case in California, the urban sector competes with agriculture for water in the valley, generating interest in reducing agricultural water use. Despite the use of drip irrigation, there is still uncertainty about the precise amount of irrigation water needed for strawberry production, including for leaching of salts and crop evapotranspiration (ET), as strawberries are sensitive to salinity and water stress.
Since 1995, we have conducted studies on drip irrigation of strawberries in the Santa Maria Valley. In order to help strawberry growers irrigate more effectively, these studies included estimating crop evapotranspiration (ET, the amount of water evaporated from plants and soil), assessing irrigation water and soil quality, evaluating drip-irrigation systems and determining patterns of salt and water around drip lines.
The Santa Maria Valley's climate is cool, with summer morning fog and moderate wind in the afternoon. The average annual rainfall is about 12 inches, most of which occurs between December and March. Little or no rainfall occurs during the summer and early fall. Soil textures consist of loamy sand and sandy loam throughout much of the valley with some clay loam near the coastline.
The sole source of irrigation water in the Santa Maria Valley is groundwater. Aquifers are recharged by percolation from the Santa Maria River and rainfall. The water quality is moderately saline with electrical conductivities (EC) generally ranging between 1 deciSiemens per meter (dS/m) and 1.5 dS/m; its major chemical constituents are calcium, magnesium and sulfate.
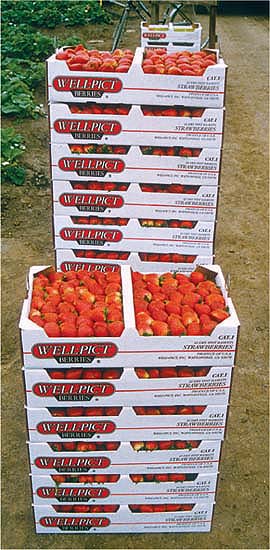
Strawberry planting occurs near the end of October. Harvesting starts during the last week of February and generally continues until July. Initially, growers used 40-inch bed spacings (22-inch bed width) with one drip line and two plant rows per bed. However, during the mid-1990s many switched to 64-inch bed spacings (42-inch bed width) with two drip lines and four plant rows per bed. The advantages of wider beds include larger plant populations and higher raised beds, which aid in harvesting. Plastic mulch is used on all beds. Valleywide fresh-market yields were 31,311 pounds per acre in 1999 and 27,720 pounds per acre in 2000, while the processed strawberry yields were 27,060 pounds per acre in 1999 and 35,520 pounds per acre in 2000 (Santa Barbara County Agriculture Commissioner's Report 2000).
Glossary
DAP: days after planting
DOY: day of year
dS/m: deciSiemens per meter (an indicator of salinity)
DU: distribution uniformity
EC: electrical conductivity
ECe: EC of saturated soil extracts
ETc: crop evapotranspiration
ETo: reference crop evapotranspiration
Kc: crop coefficient
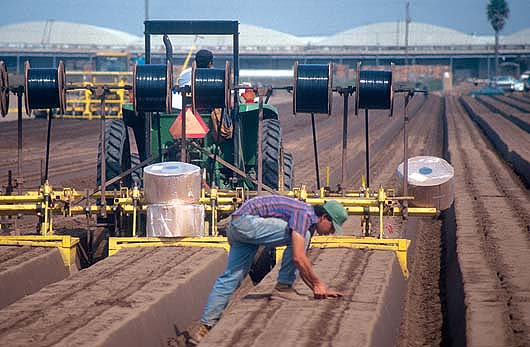
Irrigation studies were conducted on strawberries in the Santa Maria Valley — on the Central Coast north of Santa Barbara — to help growers water their crops more efficiently. Above, strawberries here are typically planted in 64-inch beds with two drip lines and four plant rows per bed. Fertilizer is applied at the same time.
Strawberry fields in the Santa Maria Valley are normally split into drip-irrigated sections of 1 acre to 5 acres. Drip-line lengths range between 200 feet and 325 feet. High-flow, 4-mil drip tape with emitters spaced every 8 inches is installed 1 inch to 3 inches deep. Drip tapes are replaced each year.
Canopy coverage and water use
Estimating crop water and leaching requirements on farms is best done with differentially irrigated plots to develop relationships between crop yield, applied water and soil salinity. This approach was not feasible in the valley because of grower concerns about yield reductions in a crop with high cash value and high production costs. We estimated crop ET or water use by first developing relationships between canopy coverage and days after planting (DAP) at 13 locations in 1999 and 2000. We then developed a relationship between canopy coverage and crop coefficient (Kc) and then determined crop coefficients with time of year. Crop coefficients are the ratio of the actual crop evapotranspiration to a reference crop evapotranspiration (normally grass). They are used to convert the reference crop ET obtained from California Irrigation Management Information System (CIMIS) weather stations to the actual crop ET.
The relationship between canopy coverage and DAP is called a canopy growth curve. Canopy coverage is defined as the percentage of soil area shaded by the plant's leaves at midday. Crop ET is directly related to canopy coverage. The canopy growth curve coupled with the relationship between canopy coverage and crop coefficient was used to develop crop coefficients during the irrigation season. To determine canopy coverage, images were made every 2 weeks with a digital infrared camera suspended 12 feet directly above the bed of the crop. The images were downloaded into a computer, and canopy coverage was calculated using software supplied by the camera manufacturer.
For canopy coverage values greater than 30%, we used the relationship between crop coefficient and canopy coverage as developed by Grattan et al. (1998); for values under 30% we used a computer model to calculate ET (Hsiao and Henderson 1985). The model's results were necessary because Grattan's relationship did not include canopy coverages less than about 30%; extrapolating Grattan's relationship for values less than 30% resulted in negative crop coefficients.
In addition, applied water and soil moisture content were measured at some of the same locations as the canopy measurements. A flow meter was installed at the beginning of each drip line to measure cumulative inflow. GroPoint dielectric soil moisture sensors were installed about 6 inches deep with two sensors at a location, one in the plant row on each side of the drip line. Data loggers were connected to each sensor for continuous measurement of soil moisture content.
Prior to the evapotranspiration study, drip-irrigation systems were evaluated to determine their uniformity of applied water. Uniformity reflects the evenness of the applied water throughout a field and is directly related to maximum potential irrigation efficiency of a properly irrigated field, so that, for example, the least watered part of the field receives the desired amount of water needed for crop production. Measurements were taken in July, near the end of the growing season. The discharge rates of two adjacent emitters in selected fields were measured every 25 feet to 50 feet along two drip lines, one located near the manifold inlet and the other located near the end of the manifold. We calculated the distribution uniformity (DU) by averaging the low quarter of all the discharge rates and dividing by the average discharge rate.
Patterns of soil moisture content and soil salinity around drip lines were also determined at some of these earlier sites in June and July; these measurements can help growers assess the impact of irrigation management practices. Soil samples were taken at depth intervals of 3 inches for the first foot and then at 6-inch intervals. Samples were taken at five locations across the narrow beds (40-inch spacing) and at seven locations across the wide beds (64-inch spacing). Gravimetric soil moisture contents and the electrical conductivity of saturated extracts (ECe) were obtained for the samples. Soil salinity was expressed as EC of the saturated extract. Contours of equal moisture contents and equal ECs were drawn using SURFER (Golden Graphics, Golden, Col.). In addition, irrigation water samples were obtained at 34 locations and analyzed for EC and concentrations of soluble salts.
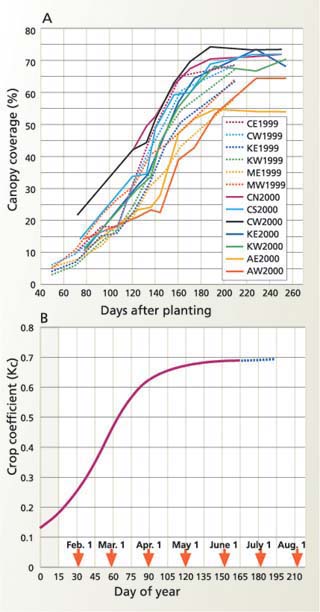
Fig. 1. (A) Canopy coverage versus days after planting at 13 locations and (B) average crop coefficients versus day of year for the Santa Maria Valley. Dotted line indicates uncertainty in data due to plant aging and damage.
Canopy coverage, ET, applied water
We found considerable variability in canopy coverage among the sites (fig. 1A). The rapid canopy-growth stage generally started between 50 and 75 DAP and continued up to about 160 DAP, after which the growth rate decreased. The sites had different growth curves with maximum canopy coverages at several locations between 70% and 75%. At these locations, canopy coverage based on the bed width (about 44 inches) plus canopy overhang was about 98% to 99%, indicating that a 70% to 75% canopy coverage based on the bed spacing (64 inches) is the maximum possible. Maximum coverages were between 60% and 75% except at AE2000 (54%), for unclear reasons.
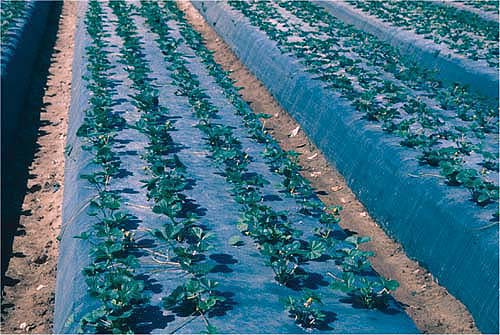
The authors determined crop evapotranspiration, patterns of soil salinity, soil moisture content, irrigation water quality and other irrigation variables. They also estimated canopy coverage, the percentage of soil area shaded by the plant's leaves at midday. Above, young strawberries are grown in black plastic mulch.
Crop coefficients expressed as a function of canopy coverage are considered more universal than those expressed on a time basis. However, growers are not likely to use crop coefficients based on canopy coverage because it is difficult and time consuming to estimate canopy coverage. Growers are more likely to use crop coefficients expressed on a time basis, such as day of year (DOY) or DAP. Therefore, we developed time-based crop coefficients using the canopy growth curves of locations with the highest maximum canopy coverages, on the assumption that maximum yields occur with maximum canopy growth. We found smaller maximum canopy coverages at some sites, but did not use them to develop crop coefficients because the impacts on yield were unknown.
The crop coefficient increased rapidly with DOY up to about the first of April (fig. 1B). Thereafter, crop coefficients increased more gradually to the maximum coefficient of about 0.69. However, near the end of the crop season, growers experienced reduced crop ET due to plant aging, and a decrease in plant height and plant damage due to harvesting. The crop coefficient curve on figure 1B is shown as a dashed line during the late growth stage, indicating that crop coefficients may need to be decreased to reflect reduced ET.
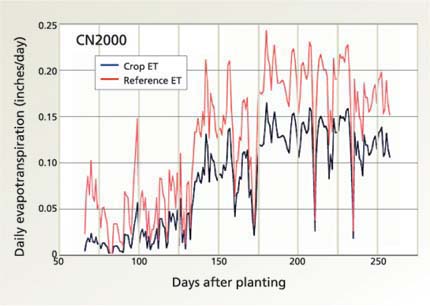
The daily crop ET for site CN2000, for example (fig. 2), was less than 0.05 inches per day up to about 135 DAP. After 135 DAP, both crop ET and reference crop ET increased with maximum values between about 170 DAP and 230 DAP, then decreased. Maximum daily crop ET rates were about 0.14 inches per day.
The calculated season crop ET was determined from Jan. 1 to about mid-July for all locations (table 1). Seasonal ET ranged from 12.4 inches to 15.6 inches in 1999 and from 12.2 inches to 15.5 inches in 2000. As expected, locations with higher seasonal crop ET also had the highest canopy coverages. The AE2000 site, which had the smallest seasonal ETc, also had the smallest maximum coverage, about 54%. It would have been useful to compare yields with seasonal ETc but yield data was unavailable.
Cumulative applied water exceeded seasonal ETc at all 2000 sites except KE2000 and KW2000 (table 1). At these sites, the grower intentionally used deficit irrigation to reduce excessive canopy growth, which he said was a problem with his variety. Nonetheless, maximum canopy coverage was nearly 70%. Data on applied water was not available in 1999 because despite the use of filters, silt in the irrigation water caused the flow meters to malfunction, jamming the metering mechanism.
Drip system performance
With one exception, distribution uniformities (DU) of the drip-irrigation systems ranged from 81% to 96% (table 2). These high values reflect the short drip lines, which ranged from 190 feet to 350 feet, and the new drip tape used each year. The average drip-line discharge rates ranged from 0.5 gallons per minute [gpm] per 100 feet to 0.75 gpm per 100 feet due to high-flow emitters and spacing of emitters on the drip tape. Interestingly, the drip system with the lowest DU also had the lowest drip-line discharge rate.
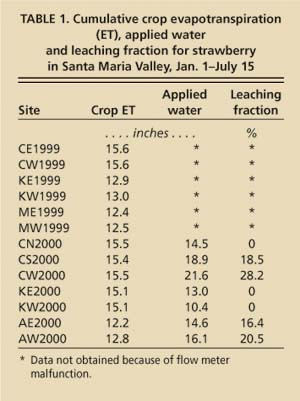
TABLE 1. Cumulative crop evapotranspiration (ET), applied water and leaching fraction for strawberry in Santa Maria Valley, Jan. 1-July 15
DU largely depends on pressure variations along drip lines and manifolds, and whether any emitters are clogged. An analysis of variance was conducted to determine the statistical significance of differences in discharge rates between adjacent emitters, and along and between drip lines. For most locations, the differences were statistically insignificant. However, at site CT2, differences between drip lines and adjacent emitters were highly significant, causing an unacceptable DU of 60%. Although we found several significant differences between drip lines and emitters among sites, they appeared to have little effect on the DUs of these systems.
Soil moisture content
Patterns of soil moisture around the drip line at one location in a sandy loam soil showed a vertical elongation of wetting under the drip tape typical in sandy soils with drip irrigation (fig. 3A). Most of the lateral wetting occurred over an interval of about 6 inches from the drip line. Similar behavior was found at most other locations. However, at one location considerable drying occurred throughout the soil profile, particularly at depths less than about 12 inches (fig. 3B). At this site, the interval between irrigations may have been too long. This information can help growers understand how water is distributed around the drip lines and the levels of soil moisture found under drip irrigation.

Fig. 3. Pattern of gravimetric soil moisture content (%) around the drip lines (A) just after an irrigation and (B) after several days of drying. Contour lines show equal soil moisture content. The color scale shows soil moisture content associated with colors between the contour lines.
Salinity
Salt in irrigation water is the main source of soil salinity, which is detrimental to salt-sensitive crops such as strawberry. Analyses of the irrigation water revealed an average EC of 1.43 dS/m (data not shown), but ranging from 1 dS/m to 2.36 dS/m. The higher values occurred at locations 3 miles to 5 miles west of the city of Santa Maria, near a waste treatment plant. However, the EC of 79% of the water samples was equal to or less than 1.5 dS/m. These waters were classified as a calcium/magnesium/sulfate water. Concentrations of calcium were slightly greater than magnesium, while sulfate dominated the anion concentrations. The relationship between total dissolved salts (TDS) in parts per million and the water EC in dS/m was: TDS (ppm) = 742 x EC (dS/m)(1)
The coefficient of determination was 0.97. This equation differs from that developed by the U.S. Salinity Laboratory, which used a generic constant of 640.
We found that soil salinity was least below the drip lines and decreased with depth, indicating leaching beneath the drip lines (fig. 4A, B). Maximum levels of soil salinity occurred midway between the drip lines and near the bed edges. ECe values throughout the soil profile were smaller in figure 4B than 4A, suggesting that more leaching occurred at the figure 4B site. EC values for the irrigation water were similar for both sites. In general, ECe values near the drip lines ranged from 1 dS/m to 3.5 dS/m for depths less than about 12 inches (the approximate root depth). Some ECe values near the drip lines were similar to EC of the irrigation water. This reflects the high-frequency irrigation used in drip irrigation and method of determining ECe, which involves adding distilled water to dry soil until a saturated paste forms.
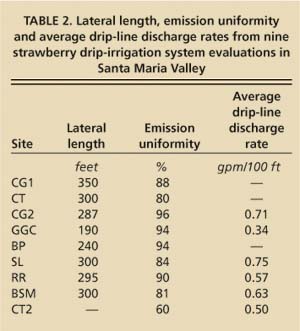
TABLE 2. Lateral length, emission uniformity and average drip-line discharge rates from nine strawberry drip-irrigation system evaluations in Santa Maria Valley
Levels of soil salinity around the drip lines were relatively high, indicating possible impacts on yields.
At locations where soil salinity near the drip lines exceeds a threshold value, yield reductions could occur. In this case, the threshold value of about 1 dS/m is the maximum root-zone salinity that can occur in strawberries without yield reductions. Under drip irrigation, it is difficult to define the root zone around the drip line, but most of the roots are likely to occur near the drip line. Salinity measurements near the drip line provide information on the potential salinity hazard as related to crop yield.
Based on estimates of crop ET and applied water measurements, leaching fractions ranged from 0% to 28.2% for the 2000 sites (table 1). These values reflect a fieldwide leaching fraction (leaching is the only way to control salt in the root zone). However, actual leaching fractions vary greatly with distance from drip lines. The relatively low ECe levels found below the drip lines indicate that leaching is greater than at other horizontal distances from the drip line (fig. 4B).

Fig. 4. Pattern of soil salinity, expressed as the EC (dS/m) of saturated extracts, around drip lines for sites with relatively (A) low and (B) high leaching. Contour lines show equal ECe (dS/m). The color scale shows ECe associated with colors between contour lines.
Irrigation water management
Water management in drip-irrigation systems involves determining an irrigation frequency and the amount of water to apply. The irrigation frequency should be small enough to prevent excessive soil moisture depletion near the drip line, which could reduce crop yield. Intervals between irrigations were determined from the soil moisture data and ranged from 1 day to as much as 10 days. For the 2000 sites, the average interval between irrigations was 3 days to 4 days.
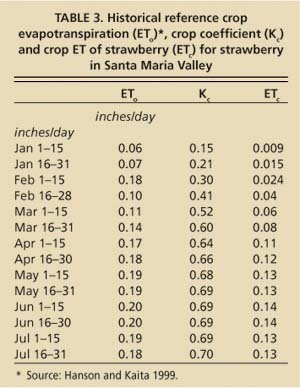
TABLE 3. Historical reference crop evapotranspiration (ETo)*, crop coefficient (Kc) and crop ET of strawberry (ETc) for strawberry in Santa Maria Valley

The maximum canopy coverage for strawberries in Santa Maria Valley was 70% to 75%, with rapid growth until about 160 days after planting.
The amount of water applied during an irrigation should equal the crop ET between irrigations plus that needed for inefficiencies in the irrigation system. The irrigation set time, or duration of the irrigation, depends on the amount of applied water and the application rate of the irrigation system. We developed a simple equation for estimating the irrigation set time using values of historical reference crop ET (table 3) in the Santa Maria Valley (except near Guadalupe). In this equation, I is days between irrigations, q is drip-line discharge rate (gpm/100 feet), and Ts is the irrigation set time (hours). An irrigation efficiency of 85% was assumed for this calculation (based on DU data): Ts = 6.52 x ETc x I/q(2).
For example, to calculate the irrigation set time needed during the first part of June (daily ETc = 0.14 inches per day) for an irrigation interval of 3 days and drip-line discharge rate of 0.6 gpm/100 feet: Ts = 6.52 x 0.14 x 3/0.6 = 4.6 hours.
Irrigating in Santa Maria Valley
Canopy coverage measurements made over a 2-year period revealed a maximum possible coverage between 70% and 75%, achieved at most locations. Rapid canopy growth generally occurred up to about 160 DAP. The crop coefficient curve (fig. 1B) showed crop coefficients increasing rapidly with time to about April 1. We found a maximum coefficient of about 0.69. This time-based relationship is unique to the Santa Maria Valley, or areas with similar climates. Areas with considerably different climates may have different canopy growth curves.
An analysis of nearly 1,000 evaluations of irrigation systems (Hanson et al. 1995) found that properly designed and maintained microirrigations systems should have DUs of at least 80%, which this study showed to be feasible and practical. The drip systems used for strawberry production generally meet this minimum standard (table 2).
The effect of ECe values found at our study locations on crop yield is unclear. Salt tolerance of some crops is greater in cool, humid climates than in hot, dry climates. Also, under the gypsiferous water and soil conditions of the Santa Maria Valley, threshold salinity values may be 1 dS/m to 3 dS/m higher than the normal threshold value at field capacity (Maas 1990). These possibilities suggest that the levels of soil salinity in the vicinity of the drip lines may not significantly affect crop yield.
In our study, applied water generally exceeded crop ET. For those locations with maximum canopy growth, the amount of applied water appears to be sufficient to meet both crop ET and leaching needed for maximum growth. However, relationships between yield and applied water are needed to determine the effect of the irrigation management on crop yield.
The information developed in these studies allows strawberry growers to calculate crop water use between irrigations and to estimate the amount of time needed to supply the desired water. These studies also show that levels of soil salinity under drip irrigation can become relatively high, raising the possibility of crop yield reductions.
Drip irrigation evaluated in Santa Maria Valley strawberries

