


All Issues
Can almond trees directly dictate their irrigation needs?
Publication Information
California Agriculture 57(4):138-144. https://doi.org/10.3733/ca.v057n04p138
Published October 01, 2003
PDF | Citation | Permissions
Abstract
Many of California's fruit and nut growers have already embraced more efficient irrigation systems (drip and microsprinkler) and adopted scientific irrigation-scheduling methods that closely match net applied water to evapotranspiration (ETc). Further improvements in irrigation efficiency may be possible by using regulated deficit irrigation (RDI) to purposely stress trees at specific times of the season. Tree-based RDI triggers for irrigation scheduling, such as stem water potential (SWP) and maximum daily trunk shrinkage (MDS), as opposed to soil and atmospheric measurements, have the major advantage of being directly linked to crop productivity. The current state of the art in plant-based scheduling is SWP and MDS, but adoption is hampered by the lack of field studies validating its effectiveness. We conducted an experiment in a commercial almond orchard to evaluate the suitability of MDS measurements as indicators for RDI management. Small, electronic sensors affixed to the tree trunks continuously recorded diameters from which MDS values were gleaned and used to schedule two RDI treatments. We found that with the less severe RDI regime, less water was applied relative to the cooperator's nearly fully irrigated trees with no significant reduction in kernel size or other important almond parameters. In fact, the RDI regimes accelerated hull-split, decreased kernel water content and increased the nut-kernel percentage at harvest — all desirable almond results. We have demonstrated, for the first time in California, that RDI can be successfully scheduled based entirely on continuously recorded, tree-based electronic data. We believe that MDS measurements have some operational advantages over SWP, including lower labor costs and the ability to be directly incorporated into remotely operated, electronic controllers.
Full text
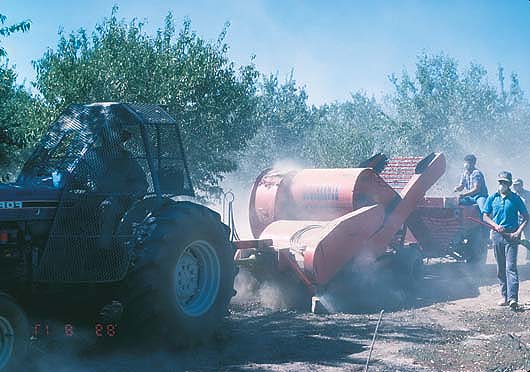
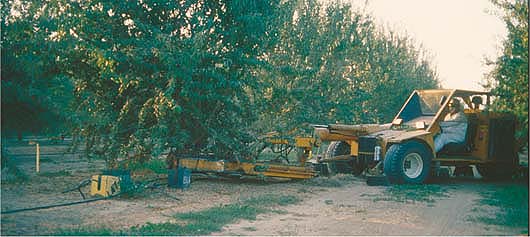
In addition to saving water, regulated deficit irrigation (RDI) -aided by measurements of minute fluctuations in tree trunk diameters — can provide benefits to almond growers such as accelerated hull-split and consequently, an earlier harvest. Additionally, it may be possible to replace the current method of ground drying with on-the-tree drying. Windrowing nuts on the ground and mechanical pickup, left, can create dust, which is considered a health risk.
AS its population grows and environmental concerns increase, California is likely to be 2 million acre-feet (650 billion gallons) short of water annually in the immediate future for an average rainfall year (DWR1998). For drought years, the gap between supply and demand will be even greater. Given the economic and environmental constraints to developing new water supplies and that agriculture uses 75% to 80% of the state's developed water, agriculture is currently perceived as a water source for the municipal and environmental sectors. Subsequently, growers face increasing pressure to reduce water use. We believe that this will drive the adoption of improved and innovative water-management practices.
Glossary
Glossary
ETc:: crop evapotranspiration
LVDT:: linear variable differential transformer
MDS:: maximum daily trunk shrinkage
RDI:: regulated deficit irrigation
SWP:: stem water potential
VDP:: atmospheric vapor pressure deficit
California growers seeking higher profits have been converting from low-value field crops to high-value permanent crops, especially almonds, pistachios and high-quality wine grapes. While the former were irrigated with conventional systems such as flood, furrow and border strip, much of the permanent crop acreage is now irrigated with drip and microsprinkler systems. The traditional on-farm approaches for minimizing water losses associated with irrigation — deep percolation below the root zone and end-of-field runoff — involve both irrigation systems and irrigation scheduling. If properly designed, maintained and managed, water losses should be very low with drip and microsprinkler systems. Improved irrigation scheduling means better matching irrigation amounts to crop evapotranspiration (ETc). The development of the CIMIS (California Irrigation Management Information System) network of automated weather stations and the availability of other irrigation management information on the Internet has made developing accurate irrigation schedules much easier for California orchardists. As a result, opportunities for tree growers to save water in the traditional areas of reducing application waste and more closely matching net applied water to ETc are becoming more limited.
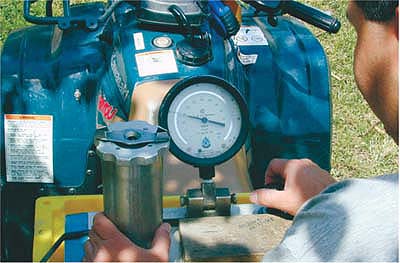
Mario Salinas assesses tree water status manually with midday pressure-chamber readings. This method, while yielding state-of-the-art data, is labor intensive, must be conducted during a midday time window, and cannot be directly linked with irrigation controllers.
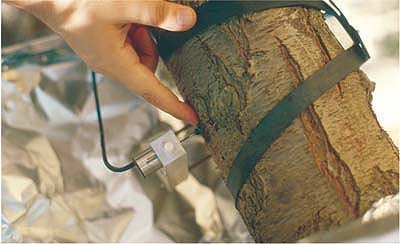
Linear variable differential transformers (LVDTs) continuously recorded the diameter of primary tree scaffolds. Maximum daily trunk shrinkage (MDS) data was used as a water-stress indicator to schedule regulated deficit irrigation (RDI).
Tree water status indicates stress
It has long been recognized that the tree itself is the best indicator of its water status (energy level). Since water status directly controls many physiological processes, such as vegetative and reproductive growth, this information can be highly useful in irrigation scheduling. On the other hand, both ETc and soil water measurements are only indirectly related to tree water status. Research over the last 2 decades has shown that careful management of water deficits (referred to as stress) in trees can have beneficial effects on crop production, such as lower hydration with prunes (Lampinen et al. 1995), reduced hull rot in almonds (Teviotdale et al. 2001) and better peel quality in citrus (Goldhamer and Salinas 2000). This type of water management is now termed regulated deficit irrigation (RDI).
By definition, RDI reduces ETc below potential levels leading to water savings, ideally without a negative impact on orchard profits. Reducing ETc below potential levels has the added advantage of decreasing agricultural consumptive use, although water saved by reducing irrigation-system losses does not necessarily result in net water savings because of reuse. Plant-based stress indicators for use in RDI are superior to those that use ETc or soil-based measurements simply because they are more directly coupled to plant performance. What is needed is an accurate, convenient and inexpensive measurement of tree water status.
Shackel et al. (1997) demonstrated that midday stem water potential (SWP), a direct measure of tree water status, can be used for tree-based irrigation scheduling. However, measuring SWP is done manually with a pressure chamber, requiring trips to the field and significant labor if frequent readings are needed. Since SWP measurements must be taken during about a 2-hour period midday, the number of fields that can be monitored is limited. Operator error of the chamber can also introduce some uncertainty.
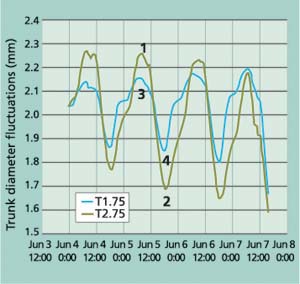
Fig. 1. Continuous recording of trunk-diameter fluctuations over a 4-day period for two sensor-based irrigation treatments. Values are means of four sensors, one each on four trees per treatment. Maximum daily trunk shrinkage (MDS) is calculated as the difference between maximum trunk diameter in early morning and minimum trunk size in late afternoon. For June 5, this would be the difference between 1 and 2 for T2.75, and 3 and 4 for T1.75.
Goldhamer et al. (1999) showed that continuous recordings of trunk diameter with electronic sensors can be used to calculate maximum daily trunk shrinkage (MDS; fig. 1) and demonstrated that this indirect indicator of stress is well correlated with SWP in peach trees. In addition to being automated with consequent low labor requirements, electronic measurements can be directly incorporated into remotely operated electronic irrigation controllers. Recently, we proposed a set of protocols to schedule irrigation in orchards using trunk diameter measurements (Goldhamer and Fereres 2001a). This paper reports on an experiment conducted in a commercial almond orchard to test these protocols and compare MDS performance as a stress indicator with SWP.
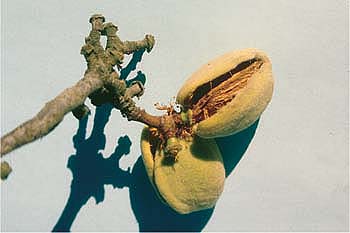
An added benefit of the RDI regime is an accelerated rate of hull-split compared with the more fully regulated trees. This results in drier kernels at harvest and potentially allows for drying nuts on the tree rather than the orchard floor. Harvesting directly from the tree, as is done with pistachios, would eliminate problems associated with ground drying.
San Joaquin Valley research.
This work took place in a mature almond orchard in western Kern County. The trees (Fritz cultivar) were 6 years old and grown in a well-drained, clay loam soil with a root zone extending to about 6 feet. A buried-drip irrigation system was used with 18-inch-deep lateral lines located 5 feet on either side of the tree row (21-feet-by-24-feet spacing). This resulted in 20 1-gallon-per-hour emitters per tree and an application rate of 0.06 inches per hour. The system was operated two or three times per day. The orchard contained three blocks, each about 10 acres, and the irrigation for each block could be operated independently.
Weather effects.
In addition to reflecting tree water status, both SWP and MDS are influenced by weather conditions. The hotter and drier the atmosphere, the greater the SWP and MDS value under conditions found in most irrigated orchards. Some reference or baseline number that reflects the water status response of a fully irrigated tree to weather conditions is required to interpret SWP and MDS measurements for irrigation scheduling. Both SWP and MDS of fully irrigated trees correlate well with atmospheric vapor pressure deficit (VPD; Shackel et al. 1997; Fereres and Goldhamer 2003). It is therefore possible to develop a baseline relationship between air VPD and the MDS or SWP values of fully irrigated trees. Armed with this information, one can calculate “signals” for MDS or SWP as the measured value divided by the baseline value calculated for the VPD at the time the measurement was taken. The MDS and SWP signals should reflect only tree water status; a signal of 1.0 indicates no irrigation-related stress while progressively higher signal values denote escalating stress levels.
Trunk diameter fluctuations
Our irrigation protocols require manually adjusting irrigation rates based on how the MDS signals change over time. We proposed that if the MDS signal does not reach a target value (referred to as a threshold) for 3 consecutive days, the irrigation rates are lowered by 10%. Similarly, if the MDS signal exceeds the threshold for 3 consecutive days, irrigation rates are raised by 10%. The MDS signals ideally oscillate around the target threshold values over the season.
We evaluated two MDS signal thresholds. The first had a value of 1.75, which we believed would result in mild stress that presumably would have little effect on production, while the second had a more severe stress threshold level of 2.75. Each of these treatments (T1.75 and T2.75) was established in respective irrigation blocks. Within each block, four trees were instrumented with linear variable differential transformers (LVDTs; Model 2.5 DF Solartron Metrology, Bagnor Regis, U.K.) installed on the southwest primary scaffold; these sensors measure minute changes in trunk diameter. The LVDTs were mounted on holders built of aluminum and INVAR — an alloy comprised of 64% iron and 35% nickel that has minimal thermal expansion. The sensors were covered with silver foil to provide constant shade. Trunk diameter measurements were recorded every 30 seconds by a data logger that was programmed to report 20-minute means. These values were automatically downloaded daily to a desktop computer in our laboratory with a cellular phone and modem located at the field site. If the MDS signals indicated that a change in the irrigation rate was required, a phone call was made to the grower/cooperator. In-line water meters were used to measure water applied to the experimental trees.

Fig. 2. Example of the interactive nature of irrigation schedule protocols where (A) MDS signals consistently above or below the target threshold triggered increases (up arrows) or decreases (down arrows) in (B) rates of applied water.
We developed a relationship between MDS and mean daily VPD using MDS values from fully irrigated trees in the T1.75 block collected in April and May, prior to the onset of the irrigation treatments in early June. Mean daily vapor pressure and relative humidity were taken from a CIMIS automated weather station located 6 miles from the experimental site to calculate VPD. The linear regression between MDS and VPD during this period (MDS = 0.0744VPD + 0.0148; R2 = 0.77) was used to determine the reference or baseline MDS value required in the MDS signal calculation for the two irrigation regimes.
SWP measurements.
Midday shaded leaf water potential (1 p.m. to 2 p.m.) was monitored every weekday with a pressure chamber (Model 3005 Soil Moisture Equipment, Santa Barbara). Two single leaves close to the trunk on each of the four instrumented trees per treatment were covered with a moist cloth just prior to excision. We have previously shown that measurements taken in this manner are nearly identical to SWP (Goldhamer and Fereres 2001b). Similar to the relationship developed between MDS and VPD, we calculated the linear regression between the SWP of fully irrigated trees early in the season and atmospheric VPD at the 2 p.m. measurement time (SWP = -0.0554VPD — 0.448; R2 = 0.76). The SWP signal was calculated by dividing the actual SWP measurement by the reference SWP value determined with this equation.
Harvest data.
On Sept. 30, the four instrumented and monitored trees plus six trees of the same size randomly located within each block were mechanically shaken, and on Oct. 9 they were individually harvested to estimate yield. Ten trees in a third 10-acre block (the Ranch) adjacent to the two experimental blocks, which had been irrigated by the grower/cooperator based primarily on SWP, were also harvested. A 5-pound nut sample was collected from each tree. The percentage of nuts that had fully split hulls (more than 50% of the suture line separated) was determined. The kernels were separated from the shells and hulls to determine the kernel percentages on a fresh and oven-dry weight basis. Nut loads were determined by multiplying the fresh nut yields per tree by the percentage of kernels in the corresponding 5-pound sample. Prior to tree shaking, 50-nut samples were randomly collected from the four instrumented trees in T1.75 and T2.75 on Sept. 14,19 and 27. Four Ranch trees were also sampled on these dates. These samples were composited and analyzed for hull-split and kernel hydration.
Interactive MDS scheduling.
Figure 2 shows a representative example of how applied water was managed via the MDS signals and its impact on subsequent signals for T2.75 from late July to early August. Following 3 days where the MDS signal was above the 2.75 threshold (July 25 through July 27), applied water was increased by 10%. This resulted in the MDS signal decreasing to about 2.45 from July 29 through July 31, triggering a 10% decrease in the rate of applied water to 0.18 inch per day from 0.16 inch per day (fig. 2). This did not achieve the desired increase in MDS and the applied water rate was again decreased 10% on Aug. 4. This resulted in a sharp increase in the MDS signal to 3.36 by Aug. 5, well above the 2.75 signal threshold.
Trunk vs. stem water signals
Observed MDS ranged from 0.1 to 0.9 millimeters (mm) depending on evaporative demand and treatment, but the T2.75 MDS was always greater than that of T1.75, except for a few days at the beginning and end of the study period (data not shown). The evolution of the MDS signal demonstrates that the signals of the two treatments went above their respective thresholds between 12 and 15 times during the period and every time, a 10% upward adjustment of the irrigation application rate was made (fig. 3A). This increase in applied water in T1.75 sometimes alleviated all stress, as evidenced by the MDS signal approaching a value of 1.0. In fact, the T1.75 signal dipped slightly below 1.0 for a few days in both mid-July and late August. We attribute this to the uncertainty that results from the scatter in the experimental points that we used in determining the baseline MDS equation.
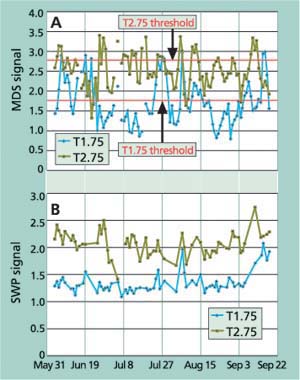
Fig. 3. Signal values over time for (A) maximum daily trunk shrinkage (MDS), and (B) stem water potential (SWP).
Prior to harvest, machines shake nuts to the ground where they dry for 7 to 10 days before being picked up. While on the ground, nuts are subject to ant damage as well as contamination by soil-borne pathogens.
Measurements of SWP ranged from -0.7 to -1.4 megaPascal (MPa) in T1.75, varied between -1.3 and -1.5 MPa for T2.75 on most days, but reached -1.7 MPa just prior to tree shaking (data not shown). The SWP signal pattern with time (fig. 3B) is similar to the companion MDS signal pattern (fig. 3A) with two important differences. First, T1.75 and T2.75 oscillated around 1.2 and 2.0, respectively, much lower than the mean MDS signal oscillations. This is consistent with our previous finding that the MDS response to stress is more sensitive than the corresponding SWP response (Goldhamer et al. 1999). Second, there was much less variation in the SWP signal over time for both irrigation treatments as compared with MDS signal values.
The differences in variability around the mean values for the season can be quantified by calculating the coefficient of variation for the MDS and SWP signals from June 4 to Sept. 18. The mean coefficients of variation for T1.75 and T2.75 were 0.255 and 0.127 for the MDS and SWP signals, respectively, clearly showing less SWP variability. Again, this is primarily due to the more sensitive stress response of MDS compared with SWP. Nevertheless, the MDS signal deviations both above and below the target thresholds were greater than desired. Our protocols were designed to be interactive and triggered by the MDS signals. Scheduling adjustments were made manually, and the only management variable was a fixed 10% change in irrigation duration. We believe that a more detailed, mathematical analysis of how the MDS signals change over time should produce algorithms that would allow an electronic controller to better detect trends and react accordingly. This would likely involve changing irrigation timing and durations by a variable percentage. The development of this type of software should result in MDS signals that oscillate more closely around the target threshold.

We chose the term “signal" to refer to plant water-status indicators in irrigation management rather than “relative SWP” or “relative MDS,” in order to teach this concept. We equate the analysis of the water-status indicators to how radio performance is quantified. With a radio, the waves are transmitted from a tower and picked up by the radio as a signal, and background interference is considered noise. Overall performance is indicated by the signal-to-noise ratio; the higher, the better. Sensitivity is defined as the ability of the radio to detect the waves (resolution).
In this analogy, the SWP and MDS measurements are transmitted from the tree. Dividing this data by reference values gives the signal strength, while the noise is the variability in tree-to-tree measurements, and sensitivity is defined as the ability of MDS and SWP to detect stress. As with the radio, the signal-to-noise ratio is the best indicator of how well the water-status indicator is performing. While the MDS signals are higher than those of SWP, MDS noise (tree-to-tree variability) is also higher. This is, in part, because the LVDT measurement is taken on a very small part of the trunk (about 1 square millimeter) where anatomical differences in the configuration of bark and phloem tissue can influence readings. On the other hand, SWP is taken from nontranspiring leaves, presumably giving a representative measure of the entire tree canopy. Nevertheless, the signal-to-noise ratio for almond trees has been shown to be higher for MDS (Goldhamer and Fereres 2001a). Increasing the number of sensors could reduce noise but also increase costs.
Water, crop quality and yield
Applied water.
Applied water in T1.75 and T2.75 differed markedly over the entire experimental period (fig. 4). Maximum water application rates were 0.31 inches per day for T1.75 in early July and 0.19 inches per day for T2.75 in late July. Applied water rates in T1.75 were similar to ETc, with the exception of early in the experimental period and in late July. At the end of the experimental period (Sept. 18), a total of 33.8 inches and 20.7 inches of water was applied to T1.75 and T2.75, respectively, for a difference of 13.1 inches or 38.8% (table 1). Estimated cumulative ETc at this time was 40.9 inches.
Hull-splitting, kernel hydration.
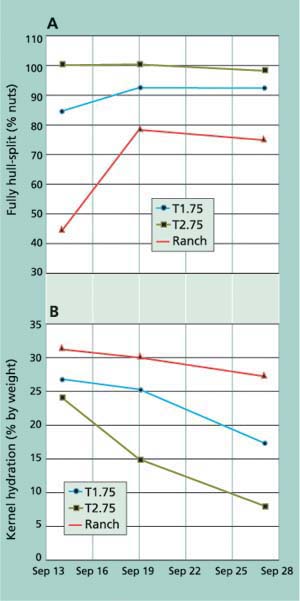
The water stress induced by the scheduling treatments hastened fruit maturation, as shown by the hull-splitting data generated by the 200-nut composite sample collected from the four trees in each irrigation regime. By Sept. 14, only 44.5% of the Ranch nut hulls had fully split as compared to 84.5% and 100% for T1.75 and T2.75, respectively (fig. 5A). The accelerated hull-splitting allowed the kernels to dry more rapidly in the irrigation treatments. This lowered the kernel hydration of T1.75 and T2.75 in the last half of September versus the Ranch (fig. 5B). Just prior to tree shaking, kernel hydration was 8.0% in T2.75 and 17.3% in T1.75, while it was 27.3% in the Ranch.
The accelerated hull-splitting in the irrigation treatments allowed more in-tree kernel drying as compared with the on-the-ground kernel drying required at the Ranch. This lessens the time required between shaking and nut pickup, reducing potential fire ant damage (Zalom and Bentley 1985). Besides ant damage, the windrowing of nuts on the ground and pickup operations create dust, which is considered a health risk. By allowing for more effective on-the-tree kernel drying, accelerated hull-splitting makes it more feasible to harvest nuts without first drying them on the orchard floor (as is done with pistachios). Additionally, on-the-tree drying eliminates potential food safety concerns associated with ground drying, including salmonella contamination caused by contact with manure fertilizers and aflatoxin resulting from fungal diseases. (The California almond industry is well aware of these potential health-related concerns and has taken action to prevent their occurrence.)
Yield.
Mean nut loads in the 10 harvested trees varied by up to 11.9% for the two irrigation treatments and the Ranch (data not shown). Fruit load is determined by the stress history of trees rather than current-year irrigation treatments. We wanted to minimize the effects of fruit load in comparing the impact of this single season of stress on the size of fruit components (kernels, shells). We therefore chose five trees each in our irrigation treatments and the Ranch that gave us mean fruit loads varying by less than 1%. Individual fresh and dry nut (hull, shell and kernel) weights for T2.75 were 9.0% and 10.7% lower, respectively, than T1.75, which was not significantly different from the Ranch (table 1). Similarly, individual fresh and dry kernel weights of T2.75 were lower than T1.75 by 9.8% and 11.5%, respectively. Again, there were no significant differences between T1.75 and the Ranch. At harvest, T2.75 and T1.75 had significantly more fully hull-split nuts compared with the Ranch; 95.2%, 89.8% and 82.2%, respectively. Both irrigation treatments resulted in nuts with a significantly higher dry-kernel percentage than the Ranch (table 1). We previously observed lower kernel percentages in response to preharvest water stress (Teviotdale et al. 2001). We cannot explain at this time why the kernel percentage response to preharvest stress was different in these experiments.
Tree-based stress monitoring
In this study, we showed that an indirect measure of tree water status (MDS), which is highly correlated to the directly measured SWP (and, in turn, important physiological processes), and gleaned from trunk-diameter monitoring, could be used to schedule irrigations in a mature almond orchard. The MDS signal thresholds for the irrigation regimes were chosen to produce constant stress levels throughout the season, rather than to maximize yields. While significant water savings (40%) were achieved with T2.75, the impact of a single year's water deficits on almond production may not be indicative of the long-term response of the orchard. Previous research (Goldhamer and Smith 1995; Goldhamer and Viveros 2000; Esparza at al. 2001) showed that water stress at harvest or immediately after can reduce the subsequent season's fruit load, which was not the case with preharvest water deficits similar to those found in the current study.
Numerous RDI studies in a variety of tree crops where target stress levels are varied over the season have shown that seasonal ETc can be reduced without reducing fruit yield or quality (Goodwin and Jerie 1992; Caspari et al. 1994) and in some cases, actually improves yield components (Lampinen et al. 1995; Goldhamer and Salinas 2000). Indeed, Teviotdale et al. (2001) showed that mild water stress imposed about a month prior to almond harvest can significantly reduce almond hull rot, a fungal disease that can cause shoot dieback, but lamented the fact that monitoring tree stress with a pressure chamber was cumbersome for most growers. At that time, target values were based on predawn leaf-water-potential measurements, which have now been replaced by the more convenient SWP. We believe that MDS monitoring has the potential to be even more expedient. While this study used a scheduling protocol designed for high-frequency drip irrigation, we have developed similar protocols for lower frequency systems, such as micro-sprinklers, that are also based on signals and thresholds (Goldhamer and Fereres 2001a).
As water scarcity increases, irrigators will seek more advanced, sophisticated means of managing water, including new techniques that can be automated and adjusted to individual needs. Tree-based RDI triggers for irrigation scheduling, such as SWP and MDS, as opposed to soil and atmospheric measurements, have the major advantage of being directly linked to crop productivity and may also be tailored to specific orchard needs. The MDS signal is a more sensitive stress indicator than SWP and has numerous operational advantages, including lower labor costs and the capacity to be directly incorporated into remotely operated electronic controllers. Therefore, it may be a superior indicator for use where RDI and/or precise irrigation scheduling is needed. We envision an MDS-controlled irrigation regime where signal thresholds vary over the season to take advantage of the beneficial aspects of stress in almonds, such as the control of hull rot, accelerated fruit maturation and on-the-tree drying, in addition to water savings.

Can almond trees directly dictate their irrigation needs?

