


All Issues
Soil type affects accuracy of dielectric moisture sensors
Publication Information
California Agriculture 54(3):43-47. https://doi.org/10.3733/ca.v054n03p43
Published May 01, 2000
PDF | Citation | Permissions
Abstract
Several types of dielectric soil moisture sensors were evaluated at various locations in California. The TRASE and ThetaProbe devices were reasonably accurate over a range of soil textures. In silt loam and silty clay soil types, the Enviroscan readings were inaccurate. The Aquaterr meter, which provides a qualitative measurement of soil moisture content, responded to changes in soil moisture content for several different soils, but little response occurred in one sandy soil.
Full text
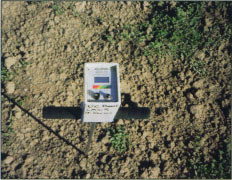
Theta Probe
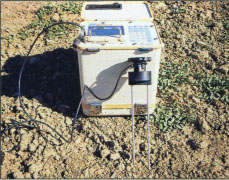
TRASE
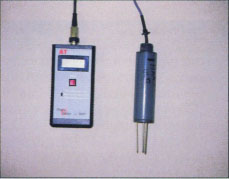
Aquaterr
Dielectric soil moisture sensors determine soil moisture content by measuring an electrical characteristic of soil. The dielectric constant is about 1 for air, 3 to 5 for soil particles and about 80 for water. The relatively large constant of water means that the dielectric constant of bulk soil is higher when the soil contains more moisture.
Most dielectric sensors are classified as capacitance or frequency-domain-reflectometry (FDR) sensors and time-domain-reflectometry (TDR) sensors (White and Zegelin 1995). Capacitance sensors consist of two electrodes separated by a dielectric. Placing the electrodes in the soil results in the soil becoming part of the dielectric. A high-frequency electrical pulse applied to the electrodes causes a resonant frequency, which is measured by the instrument. This frequency changes as the dielectric constant of the soil changes.
TDR sensors require two to four waveguides installed in the soil parallel to each other. An electrical signal applied to the waveguides travels along their length and is reflected back. The travel time is related to the dielectric constant of the soil. A calibration equation relates the dielectric constant to soil moisture content.
We evaluated four dielectric instruments for their appropriateness for irrigation scheduling. They were assessed for their accuracy in determining soil moisture content, ease of operation, ease of installation and cost.
Dielectric devices evaluated
One dielectric device, the TRASE TDR instrument, was evaluated at six sites in the San Joaquin Valley. These sites and their average respective sand, silt and clay percentages are Sandy Loam-WAL (70-29-1), Sandy Loam-PE (67-29-4), Loamy Sand-GR (82-17-1), Silt Loam-WA (19-62-19), Silt Loam-CO (19-52-29) and Silty Clay-WB (19-46-35). Letters at the end of the texture classification indicate the site location.
The TRASE (Soil Moisture Equipment Co., Santa Barbara, CA) device is a TDR instrument that requires two steel rods or waveguides driven into the soil parallel to each other, connected by cable to the instrument. Two sets of rods were used for this study, with one set measuring the 0-to-12 inch depth interval and the other measuring the 0-to-24 inch depth interval. The instrument measures an average moisture content over the respective depth intervals.
In addition, we evaluated an Aquaterr Moisture Meter (Aquaterr Instruments, Fremont, CA), an Enviroscan system (Sentek Ltd., Australia), and a ThetaProbe (Delta-T Devices, England) at a number of locations. The Aquaterr meter is a steel rod containing electrodes at its tip. The rod is pushed into the soil to the desired depth and a reading obtained. Instrument readings are related to a qualitative degree of soil wetness by a color-coded chart. Soil textures at the evaluation sites were Silt Loam-CA, Sandy Loam-DF, Loam-DR and Silty Clay-WB.
The Enviroscan system is a capacitance instrument consisting of a series of sensors installed in a PVC access tube. The sensors are connected to a data logger, which allows very frequent measurements to be made. Measurements were made at depths of 4, 12, 20, 28 and 36 inches every 60 minutes. We took measurements near Silt Loam-WA, Silty Clay-WB and Silt Loam-CA.
The ThetaProbe consists of four electrodes, each 2.25 inches long, attached to a plastic cylinder. A hole is augered to the desired depth of measurement and the electrodes are pushed into the bottom of the hole. The sensor is connected to a handheld meter. We took measurements at Silt Loam-CA, Sandy Loam-DF, Sandy Loam-SM, Sandy Loam-DF, Loam-DR, Clay-TB, Silty Clay-WB and Loam-BL.
The dielectric instruments are promoted as measuring volumetric soil moisture content, except for the Aquaterr meter. Therefore, to determine their accuracy and response to changes in soil moisture content, we compared the readings of the dielectric instruments using their factory calibrations with measurements of soil moisture content. Two methods were used for measuring soil moisture content. TRASE and Enviroscan readings were compared with soil moisture contents measured with a neutron moisture meter (NMM) calibrated for each site. The TRASE device was installed along a transect about 6 feet long at each site, with the NMM access tube installed in the middle. Measurements were made twice a week during our study. NMM measurements were made 6, 12, 18 and 24 inches deep. We compared Enviroscan readings with soil moisture contents measured with NMM about 2 feet away.

Fig. 1 TRASE readings versus neutron moisture meter (NMM) measured soil moisture contents for three locations
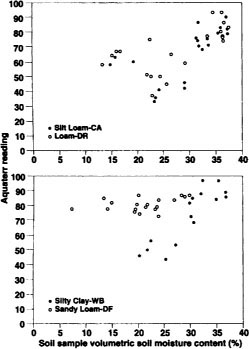

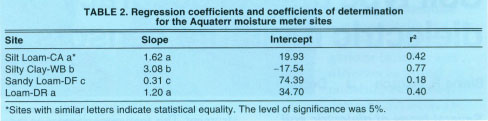
TABLE 2 Regression coefficients and coefficients of determination for the Aquaterr moisture meter sites
We compared the readings of the ThetaProbe and Aquaterr meter with soil moisture contents obtained from soil sampled about 1 to 2 inches from each instrument. Soil sample volume was about 60 cm3, about the volume sampled by the two dielectric instruments.
Although it might be preferable to compare TRASE and Enviroscan readings with moisture contents determined from soil samples, this approach would require frequent removal and reinstallation of access tubes and waveguides for each set of measurements due to disruption of the soil in the immediate vicinity of tubes and waveguides. Removing and installing these access tubes / waveguides is difficult and time consuming. Therefore soil sampling was not practical for these devices because of the number of sampling sites and the frequency of measurements.
One concern about using the NMM is that it samples a much larger volume of soil compared with the dielectric sensors. The NMM horizontal zone of influence can range from about 6 inches in a wet soil to about 27 inches in a very dry soil. The few studies on the zone of influence of dielectric sensors show a zone about 1 to 2 inches for TDR sensors and about 4 inches for the Enviroscan device. (Baker and Loscano 1989; Paltineanu and Starr 1997). However, the results of this research and that conducted by Frueh and Hopmans (1997) suggest that differences in zones of influence were not a major factor where the NMM is calibrated for the site-specific conditions.
TRASE readings
We compared TRASE TDR readings with the NMM soil moisture contents averaged over the depth intervals of 0 to 12 and 0 to 24 inches. The data revealed strongly linear relationships between TRASE readings and soil moisture contents for each depth interval at Sandy Loam-WAL and Loamy Sand-GR (fig. 1). Similar behavior occurred at Sandy Loam-PE. More scatter existed in the readings for Loamy Sand-GR, which were slightly above the 1:1 line.
At Silty Clay-WB (fig. 1), a reasonably linear behavior occurred for the 12-inch interval with some deviation from a 1:1 line. Similar behavior was found at Silt Loam-CO. At Silt Loam-WA, little correlation occurred between TRASE readings and soil moisture contents. No readings could be made for the 0-to-24-inch interval at the fine-textured sites because of excessive signal attenuation in this soil. This attenuation prevented detection of the travel time at which the reflected signal occurred.
Correlation coefficients between instrument readings and soil moisture contents exceeded 0.88 for Sandy Loam-WAL, Sandy Loam-PE, Silt Loam-CO and Loamy Sand-GR (0-to-24-inch interval). Coefficients of the linear regression equations (table 1) generally differed statistically from those of the 1:1 line for Sandy Loam-PE, Loamy Sand-GR, Silty Clay-WB and Sandy Loam-WAL (12-inch interval). Coefficients of determination exceeded 0.88 except for the 12-inch interval at Loamy Sand-GR. The regression equations generally were statistically different for each site, but the slopes of these equations generally were statistically equal.
Aquaterr meter
Aquaterr meter readings plotted against soil moisture contents showed that, with one exception, Aquaterr readings responded to changes in soil moisture content, although considerable scatter occurred in the data (fig. 2). At Silt Loam-CA and Loam-DR, outliers appeared to exist in the drier ranges of soil moisture, while at Sandy Loam-DF, we found little change in Aquaterr readings with soil moisture contents. The reasons for this behavior are unclear.
Regression coefficients and coefficients of determination showed considerable variation among the four sites (table 2). Except for Silt Loam-CA and Loam-DR, regression equations and their slopes were statistically different for each site. Coefficients of determination ranged between 0.18 and 0.77.
Enviroscan
We compared NMM and Enviroscan readings with depth on two measurement dates at locations Silt Loam-WA and Silty Clay-WB (fig. 3). This approach was used because Enviroscan readings could not be directly compared with NMM readings due to different depths of measurements. Each set of data consists of readings in a relatively wet soil and in a relatively dry one. These data show that the Enviroscan readings generally were much greater than the NMM readings. Most of the Enviroscan readings were at least 1.5 times greater than the NMM values. The ratio of Enviroscan reading to NMM reading increased as soil moisture content decreased. However, at each location, the ratio for the shallowest measurement depth ranged only between 0.9 and 1.16. Similar behavior occurred at Silt Loam-CA.
The ability of the Enviroscan device to estimate changes in soil moisture content was determined by calculating the ratio of the change in Enviroscan readings to the ratio of the change in NMM moisture content for four or five time intervals between irrigations. At Silt Loam-WA, the average ratio was 0.95, with values ranging from 0.77 to 1.25. At Silty Clay-WB, readings were taken at two locations. At one location, the average ratio was 1.52, with values ranging from 1.02 to 1.98. At the second location, the average ratio was 1.59, with values ranging from 0.49 to 2.12.
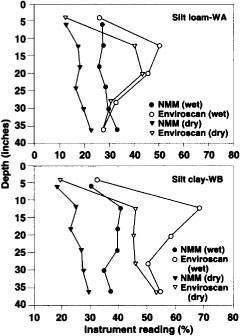
Fig. 3 Comparison of Enviroscan readings and NMM soil moisture contents with depth of soil profile at two locations for both wet and dry soil.

Fig. 4 ThetaProbe readings (A, B) and linear regression equations (C, D) versus soil sample moisture contents for several locations.

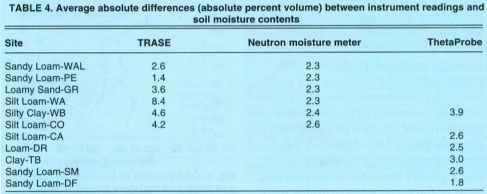
TABLE 4 Average absolute differences (absolute percent volume) between instrument readings and soil moisture contents
ThetaProbe
ThetaProbe readings plotted against soil sample volumetric soil moisture contents showed a strong linear response to soil moisture content, with data points relatively close to a 1:1 line except for Silty Clay-RO where ThetaProbe readings underestimated soil moisture at high moisture contents (fig. 4). We could not measure at lower moisture contents because of potential damage to the electrodes when pushed into drier soil. Data of the sites with sandy soil (Sandy Loam-DF, Sandy Loam-SM) better fit the 1:1 line compared with the data of the other sites. The better the fit to a 1:1 line, the more accurate the sensor.
Regression coefficients showed similar slopes and intercepts for the finer-textured soils (Silt Loam-CA, Loam-DR, Clay-TB and Silty Clay-WB), statistically different from a 1:1 line (table 3). Similar coefficients also occurred among the sandier sites that were statistically similar to a 1:1 line. Coefficients of determination ranged between 0.64 and 0.91.
Error analysis
The error values the TRASE and ThetaProbe instruments are the average of the absolute differences between instrument readings and soil moisture contents (table 4). Errors were slightly smaller in the sandy soils for the TRASE instrument. TRASE errors at these sites were statistically similar to the error in the NMM calibration curves. (Errors for the NMM were the average of the absolute differences between soil moisture contents of soil samples used to calibrate the NMM and the predicted soil moisture contents obtained from the NMM calibration equations.) Thus differences between TRASE readings and NMM soil moisture contents may be explained to a large degree by the error in the NMM calibration.
We did not do an error analysis for the Aquaterr and Enviroscan instruments. The Aquaterr device provides a qualitative indicator of soil moisture content only, while depths of measurement differed slightly between the Enviroscan and NMM. In both cases, an error analysis would be inappropriate.
Soil type affects readings
It should be understood that these results are specific to soil type, clay type and soil salinity. Similar comparisons conducted under different conditions may have different results.
The ThetaProbe and TRASE instruments were the most accurate over a wide range of soil conditions. However, the TRASE device would not read over the 0-to-24 inch interval in the finer-textured soils because of excessive signal attenuation. The Aquaterr meter provides a qualitative reading only, and also requires some field calibration.
The Enviroscan device was not accurate in the soil types at the evaluation sites. Research in Washington also revealed Enviroscan readings to be higher than soil moisture contents (Leib and Matthews 1999). However, USDA researchers in the eastern United States reported excellent agreement between Enviroscan readings and soil moisture contents (Paltineanu and Starr 1997).
Reasons for the different responses are not clear, but may involve factors such as clay type and soil salinity. However, the Enviroscan instrument reasonably estimated changes in soil moisture content at one site, while it overestimated changes at another site.
A particular advantage of the Enviroscan is its ability to make continuous measurements with time. In spite of any inaccuracies, continuous measurements can identify behavior in soil moisture content that may not be readily evident from intermittent measurements. Field observations and calibration, however, are necessary to interpret the Enviroscan readings relative to crop water needs.
The TRASE, ThetaProbe and Aquaterr meter are relatively easy to install in a wet soil, but can be difficult to install in a relatively dry soil. The Enviroscan instrument requires carefully installed access tubes. Special installation equipment supplied by the manufacturers is recommended. Technical support from the manufacturer is needed to set up the Enviroscan system.
The ThetaProbe and Aquaterr meter were easy to operate, by simply pushing a button and reading the instrument. The TRASE was more difficult to operate. It required selecting the appropriate screen display and entering the waveguide length. The Enviroscan system requires downloading the data stored in its datalogger into a computer and then displaying the data using manufacturer-supplied software.
The Aquaterr meter is the least expensive (about $500), followed by the ThetaProbe ($850 for a minimum kit). Minimum costs for the other instruments range between $8,000 and nearly $14,000.
Soil type affects accuracy of dielectric moisture sensors

