


All Issues
In a study of avocado trees, using less fertilizer more often can reduce nitrate leaching
Publication Information
California Agriculture 46(3):19-20.
Published May 01, 1992
PDF | Citation | Permissions
Abstract
Fertilizing avocado trees in smaller amounts more frequently can reduce nitrate leaching into the soil and thereby decrease contamination of ground wafer.
Full text
Increasing contamination of ground water by nitrates has been a long-standing problem in the United States, and in California it has been listed as one of six major water quality problems by the State Water Resources Control Board. In 1985, the U.S. Geological Survey found that more than 10% of the 2,732 water wells sampled in the state contained nitrates at concentrations exceeding the federal drinking water standard of 10 milligrams per liter (mg/L) nitrate-nitrogen (nitrate-N).
Sources of nitrogen in soil include onsite domestic waste disposal systems (e.g., septic tanks and cesspools), dairies, animal feedlots and sewage effluent used for irrigation. In farming, applying fertilizers is a major contributor to the total load of nitrogen in the soil. Since the 1960s, one study found, increased use of nitrogen fertilizers has been accompanied by increased levels of nitrates in ground water.
Ideally, only the amount of fertilizer that can be used by the plant is applied, leaving no residual to move below the root zone. However, in most cases, the plant does not assimilate all of the applied nitrogen; some does move below the root zone. Nitrogen in the soil that is not returned to the atmosphere in the form of nitrogen gas or ammonia is generally converted by bacteria into the nitrate form. Nitrate is very mobile; with sufficient water in the soil it can move readily through the soil profile. Careful management of nitrogen and water applications should minimize the amount of nitrogen moving below the root zone, thereby also minimizing potential nitrate contamination of ground water.
The purpose of our project was to study the influence of nitrogen and irrigation management on the movement of nitrate in the soil below the root zone of mature avocado trees. This is part of a larger study investigating the effects of low-volume trickle and drip irrigation and fertilizer management on avocado yield and quality. This report offers the results of studying the influence of different levels of nitrogen applications and irrigation levels on nitrate-N concentrations in soil water.
Methods
Trials were conducted near Corona, California in an orchard of mature Hass avocado trees. Three different irrigation levels were maintained in the orchard: 80, 100 and 120% of the crop evapotranspiration (ETc) level. The ETc) is calculated using the formula:
ETc = ETo x Kcwhere ETo is the reference evapotranspiration and Kc is the crop coefficient. The evapotranspiration value is the amount of water required by the plant for proper growth and is calculated based on several variables including temperature, relative humidity, wind speed and solar radiation. Local reference evapotranspiration (ETo) values were obtained on a weekly basis from a California Irrigation Management Information System (CIMIS) station in Riverside.
Because ETo is calculated as the amount of water required by 4- to 6-inch-tall fescue, it must be modified for the particular crop of interest using the crop coefficient, Kc. The Kc was estimated based on soil matrix potentials observed during 4 years of study. The Kc used to calculate the water needs of the trees varied monthly, ranging from 0.35 in January to 0.55 in June and July. At the experimental site, irrigation efficiency is 92%. Calculation of ETc—the amount of water required by the avocado tree—was based on the above formula. Assessments of whether trees were receiving proper amounts of water were made by checking soil moisture with tensiometers and a neutron probe.
Water was applied with low-volume sprinklers that deliver 6.2 gallons per hour. The experimental rows of approximately 20 trees receiving treatment were bordered on each side by nonexperimental guard rows.
Soil-water solution samplers made of polyvinylchloride (PVC) with ceramic cups at the end were placed 5 feet deep in the soil. Twenty-seven solution samplers were installed at random trees distributed among the three irrigation treatments as follows: 80% ETc, 9 samplers; 100% ETc, 7 samplers and 120% ETc, 11 samplers. Samples were obtained by placing a suction on the tube and extracting the soil water sample. Any very dry soil necessitated allowing the suction to remain for up to 48 hours before it was possible to extract an adequate amount of water for chemical analysis.
Concentration of nitrate-N in the soil water was monitored for four fertilization cycles. The first samples were collected 5 days before the first nitrogen application to obtain information on the baseline levels of nitrate-N in the soil water. Fertilizer application dates and amounts follow: February 28, 1989, 1.5 lb N per tree; June 14, 1989, 0.75 lb N per tree; October 17, 1989, 0.75 lb N per tree; and June 29, 1990, 0.375 lb N per tree.
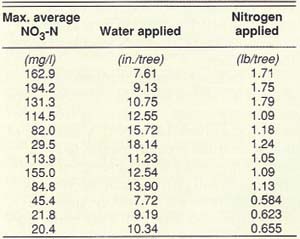
TABLE 1. Peak concentrations of nitrate-nitrogen leached below the rootzone for twelve irrigation-fertilizer treatment combinations
Soil-water samples were collected every 1 to 2 weeks at as many sites as it was possible to obtain water. In each case, the level of nitrate-N in the soil water was allowed to return to baseline pre-fertilization levels before applying fertilizer. The urea fertilizer was broadcast manually and evenly within the sprinkler application area.
Irrigation water was collected periodically and analyzed to determine the concentration of nitrate-N. All nitrate analyses were performed by the University of California Diagnostic Laboratory at Riverside, using a continuous flow system analyzer.
Nitrate dispersion at each sample collection site was calculated using the computer program CXTFIT (by M. Th. van Genuchten and W. J. Alves of the U.S. Salinity Laboratory) that was modified to include a delta function input. The spatial analyses were performed using the geostatistics software package GEOPACK developed by S. R. Yates at the U.S. Salinity Laboratory in Riverside.
Results
The volume of water moving past the 5-foot sampling depth was not determined; hence, calculation of the total mass of nitrogen moving below the root system was not possible. Most of the results, therefore, are discussed in terms of the concentration of nitrate-N leaching below the root zone.
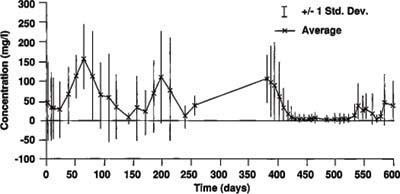
The measured concentrations of nitrate-N in the soil water at 5 feet below the soil surface varied considerably from site to site on a given day (fig. 1). Variations of this magnitude are not unexpected in a field setting and may be a function of differences in soil properties at the various sampling locations. Therefore, the influences on one another of the sampling sites’ spatial orientations were investigated. Spatial analyses of the data indicate that the distance between sampling locations correlates with observed patterns of nitrate-N movement.
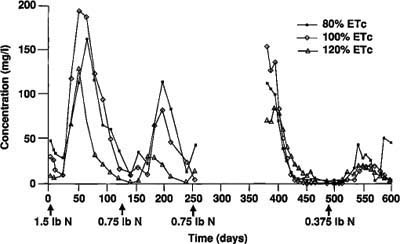
Average nitrate-N concentrations in the soil water for all three irrigation treatments over the four fertilization cycles are shown in Figure 2. Obviously, the amount of applied fertilizer and the maximum nitrate-N concentration in the soil water are related; however, the relationship between the irrigation treatment and nitrate-N concentration is not as clear. Two-way analysis of variance was performed to determine the source(s) of variation in the observed results. Maximum nitrate-N concentrations at each sampling site for each fertilizer application were used. Results of this analysis showed that both fertilizer application cycle and irrigation treatment were significant (p ≤ 0.001 and p ≤ 0.01, respectively) sources of variation in maximum nitrate-N levels.
The data were also analyzed to determine whether a linear relationship between the maximum nitrate-N concentration and irrigation treatment and/or fertilizer application existed. For this analysis, it was necessary to determine the exact amounts of water and nitrogen applied to the trees during each fertilization cycle. Because the irrigation water contained a relatively high concentration of nitrogen (average 13 mg/L), the contribution of the irrigation water to the total nitrogen loading was included in the analysis. Table 1 shows the data used to conduct the regression analysis.
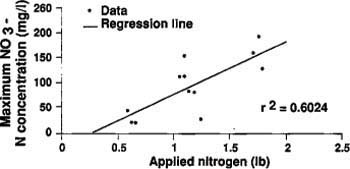
Results of the multiple regression analysis showed that there is a strong linear relationship between the maximum nitrate-N concentration and the amount of applied nitrogen, with the correlation being significant at the p ≤ 0.0025 level. Approximately 60% of the variation in maximum nitrate-N concentrations could be explained by the amount of applied nitrogen. The relationship between the amount of applied water and the maximum nitrate-N concentration was much weaker: the correlation was significant at the p ≤ 0.18 level. Adding applied water as a source of variation in the maximum nitrate-N concentration resulted in an increase of r2 (the correlation coefficient) from 0.6062 to 0.6778. In other words, the amount of applied nitrogen can account for 60% of the variation in nitrate-N concentration, and the amount of water applied only accounts for 7% of the variation in nitrate-N concentration. The relationship between applied nitrogen amount and maximum nitrate-N concentration in the soil water is depicted in Figure 3.
Data were also analyzed to discover whether any differences in the dispersion of the nitrate-N occurred as a result of the different treatments. Dispersion can be defined as the spreading out of the nitrate-laden water as it moves through the soil profile around the soil particles, diluting the nitrate. Two-way analysis of variance was used to calculate whether the different irrigation treatments or the fertilizer application cycles (i.e., the amount of applied nitrogen) were significant sources of variation in the dispersion at different sampling sites. Results of the analysis showed that neither irrigation level nor amount of applied fertilizer was significantly correlated with nitrogen dispersion (p ≤ 0.20).
Discussion
This study shows that the concentration of nitrate leaching below the root zone of mature avocado trees is strongly correlated with the mass of applied nitrogen. Smaller, more frequent applications of fertilizer apparently minimize the potential for nitrate leaching — and contamination of ground water. A new study is assessing the effects of smaller, more frequent fertilizer applications through the irrigation system on the leaching of nitrate and the yield of avocados.
The relationship between the applied water and nitrate leaching is not as apparent. In this study, no correlation was found between the amount of applied irrigation water and the leaching of nitrate below the root zone. It may be that the differences in the amounts of applied water in the three irrigation treatments were too small to significantly affect the concentration of nitrate-N leached.
One observation clearly demonstrates the role of applied water in nitrogen leaching. Fertilizer (0.75 lb N) was applied to trees October 17, 1989. Soon after, the soil became too dry to obtain samples of soil water. When irrigation was started again in spring and it became possible to obtain samples, concentrations of nitrate-N in the soil water were high (fig. 2). In fact, they were higher, on average, than the measured nitrate-N concentrations from the previous application of 0.75 lb N. The relatively high nitrate-N concentrations measured after spring irrigation probably resulted from the accumulation over the dry winter of leached nitrate in the soil.
Another observation concerned extreme variations in measured nitrate-N concentrations at the 27 sites in this orchard. This high variability in a field setting illustrates the need for large numbers of replicates in any study of this nature. In this study, the variability between sites was determined by the sampling location in the plot. In other words, sites close to one another had similar patterns of nitrate leaching. As distances increased between sites, the differences between the calculated dispersion of the nitrate-N also increased.
In a study of avocado trees, using less fertilizer more often can reduce nitrate leaching

