


All Issues
Global warming and the Sacramento-San Joaquin Delta
Publication Information
California Agriculture 44(3):16-18.
Published May 01, 1990
PDF | Citation | Permissions
Abstract
The likelihood of global warming and its potential consequences are major concerns to global climate researchers, government officials, and members of the public. Conferences, workshops, and various publications have considered the effects of higher global temperatures on ocean levels, rainfall, and other climatic variables.
Full text
Even a small rise in ocean levels would bring more flooding to Delta islands, and require new strategies for levee management.
Opinions differ as to the nature and magnitude of the results of global warming, but the issue bears careful study and planning to prepare for any deleterious effects. One small aspect of global warming might be the flooding of part of the central Sacramento-San Joaquin River Delta. We base our analysis of a 1-foot rise in ocean levels on a stochastic simulation model of flooding and the associated costs of current flood control policy for 46 islands in the Delta. Through the model, we analyze the costs of flood damage, reclamation, and maintenance under the policy of restoring and preserving the islands for agriculture.
A brief discussion of possible climatic changes will establish the environmental background for the analysis, and will be followed by an outline of the model employed here. Finally, we will compare the costs of three flood control policies under current climatic conditions to the costs of flood control with a higher ocean level. We do not consider the probability of climatic change here, leaving that aspect instead to atmospheric scientists. Our focus is on the consequences of global warming, should the change occur.
Changing ocean levels
In June 1989, the Intergovernmental Relations Committee of the California Energy Commission presented an interim report, “The Impacts of Global Warming on California.” The committee noted that “using the most current understanding of the earth's climate, scientists have developed complex global climate models that predict significant climatic warming will result from increased concentrations of greenhouse gases.” The group cautioned, however, that other scientists have questioned “whether the globe faces much, if any, warming.” If warming should eventually occur, the committee foresaw a high risk that California will face temperature increases of 2.7° to 8.1°F by the mid 2000s and the likelihood that a temperature rise of 0.9° to 3.6°F may already be inevitible.
According to the committee, a temperature increase of 5.4°F (the midpoint between 2.7° and 8.1°F) would cause (1) increased winter streamflows and decreased spring streamflows, (2) increased ocean levels (between 1.6 and 4.9 feet) because of thermal expansion and glacial melting (this rise would follow the atmospheric warming by several decades), and (3) reductions in coastal and Delta natural habitats and a tripling of the size of the San Francisco Bay system. This change would be associated with flooding of lower-elevation lands that now support commercial, agricultural, and residential development.
Higher ocean levels would cause increased salinity in the Delta, a region that now supplies large quantities of water for human consumption and commercial use. Furthermore, the committee predicted that an ocean level rise of 3.2 feet would increase the pressure on Delta levees, many of which are now in mediocre condition at best, by 65%.
Economic model of Delta flooding
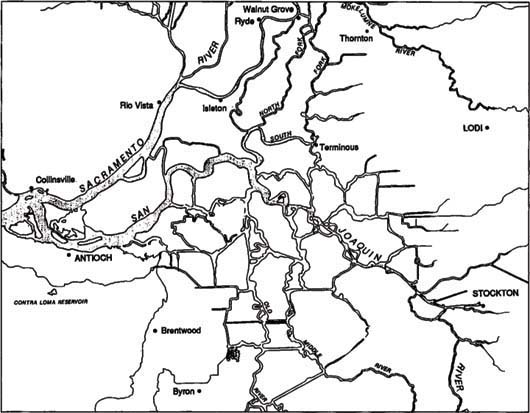
The Sacramento-San Joaquin Delta includes about 738,000 acres and channels the flow of five major riversMdashthe Sacramento, San Joaquin, Old, Middle, and MokelumneMdashto the northern end of the San Francisco Bay. Its major islands and tracts are protected by 1,100 miles of levees, including project levees built and maintained by the U.S. Army Corps of Engineers to assure high-quality protection against floods, and privately owned and maintained nonproject levees. The latter group takes in about two-thirds of the Delta levees and poses the greatest threat of failure.
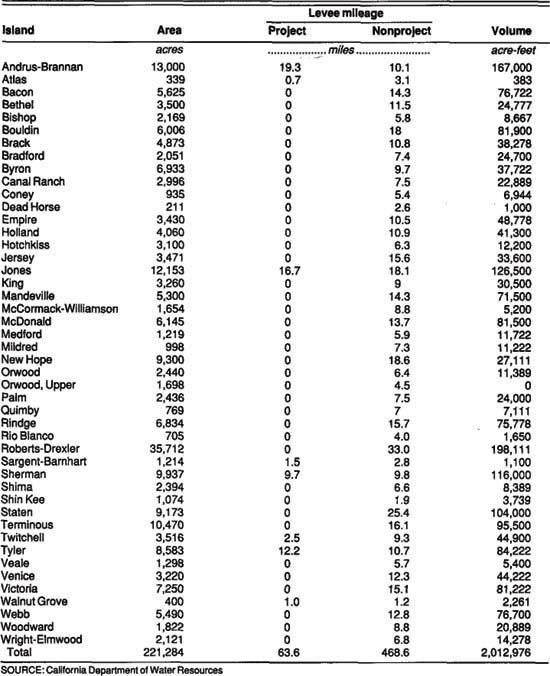
The systems model we used in our study simulates floods and their associated costs for 46 islands or tracts in the central Delta (see map). The islands were selected because each is protected mostly by nonproject levees, would sustain considerable damage and require considerable reclamation expenditures in the event of a flood, or is at or below mean sea level.
The islands range from 211 acres (Dead Horse) to 35,712 (Roberts-Drexler), have a combined land value of more than $515 million, and annually produce nearly $80 million in agricultural commodities. The included islands, their sizes, and the mileage of their levees are given in table 1. The volume figures in the table show how much water (in acre-feet) it would take to flood the low-elevation islands to sea level. This measurement helps estimate how much it would cost to dewater flooded islands and how much fresh water would be needed to “flush” out a flooded island in the summer to prevent saltwater intrusion.
Floods on Delta islands are either overtopping floods (the water level in the river channel exceeds the height of the levee for a sustained period) or stability failures (the river level is below that of the levee, butthe levee ruptures). From 1950 to 1986, there were 23 floods among the 46 islands in the study area–15 stability failures and 8 overtopping floods. The occurrence of each type was closely related to the physical condition of the island and to the water level of the river.
The islands in the central Delta have a mostly peat-based soil, which is subject to oxidation, water seepage, and land subsidence of as much as 3 inches per year. Over time, land subsidence reduces the inner island backing for the levees, increasing the effective water pressure from the river. In addition, many nonproject levees are either built over the peat soil or are themselves made up at least partially of peat, and thus more prone to structural failure.
The water level in the river channels, however, is the major driving force for flooding. More water on the exterior side of the levees adds to the hydrostatic pressure, making the levees more susceptible to failure, and the higher the water, the greater the odds of an overtopping flood.
Simulation process
To prepare for the simulation, we established the annual maximum water levels at several locations in the Delta. Historical data indicate that the water levels at different points on the five rivers are interdependent and can be described by various probability distributions. In the stochastic simulation, the computer generates water levels at random such that, over many simulations, the generated values follow the historically observed probability distributions. By obtaining many simulated observations, the model can calculate the means and variances of the other primary variables we wish to study.
Because the likelihood of overtopping floods and stability failures depends on the water level, the probabilities for a given island's flooding are determined after the water level has been set for that particular island. For stability failures, that probability also increases with the thickness of the island's peat. Again, a random drawing determines whether a simulated flood occurs, given the above probabilities. If a flood occurs, the model calculates the costs of damage and reclamation. If there is no flood, the model must determine whether the island reclamation district will undertake maintenance operations for that year (a random variable), and, if so, what will be the maintenance cost per mile of levee (also a random variable). Data from the California Department of Water Resources were used to estimate the probability distributions underlying the maintenance decision and cost process.
Flood costs
To determine our cost figures for property damage, we consulted with agricultural commissioners, county assessors, and realtors, and updated the costs estimated in previous studies by the U.S. Army Corps of Engineers. Damage costs include the destruction of residences, mobile homes, commercial buildings, building contents, farm equipment, agricultural production, public facilities, utilities, and other physical properties.
Besides these damage costs, floods cause expensive damage and interrupt service on federal and state highways that cross the Delta islands (for example, Interstate 5 and State Highways 4,12, and 160). We drew our costs for these effects from “Flood Protection of State Highways in the Sacramento–San Joaquin Delta,” a publication by the California Department of Water Resources (December 1987). The costs of emergency services (evacuation and supplies) were estimated by updating U.S. Army Corps of Engineers figures.
Floods on Jones, Roberts-Drexler, Sargent-Barnhart, Woodward, Orwood, and Upper Orwood islands may also damage the East Bay Municipal Utilities District's (EBMUD) Mokelumne Aqueduct, which transports water to the San Francisco Bay Area. Not every flood on these islands will cause the aqueduct system to fail, so the simulation process again randomly determines whether such damage and service disruption occurs, and then assesses the cost. It bases this determination on whether a stability failure occurs near the point where the aqueduct intersects the island levee, or whether the protective railroad embankment on these islands fails, damaging the aqueduct.
Flooding also necessitates such reclamation activities as repairing breached levees, dewatering the inundated island, cleaning and releveling the island, and, in the case of a summer flood (with low river flows), flushing fresh upstream water through the flooded island to prevent saltwater intrusion. The costs of levee repair and dewatering vary from flood to flood and island to island, and are treated as random variables within the constraints of particular probability distributions; the other costs were estimated based on interview with farmers and land restoration firms.
As indicated above, if there is no flood, the simulation process determines whether the levees receive maintenance operations and what those costs will be.
All these costs are then summed for all the islands for each year. After many repetitions, the model calculates average annual costs and their variances. Similarly, the simulation process can be continued into the future, say for 50 years, and the costs discounted by an interest rate to yield the present value of the cost of retaining a particular policy toward the Delta. This lumpsum value can be compared to the costs of alternative policies, such as constructing better protective levee systems, changing California's reclamation policy, or altering the use of Delta islands.
Simulation results
For this analysis, policy alternatives were evaluated for two environmental conditions. The two situations were (1) the current physical and environmental conditions and (2) global warming with a 1-foot rise in ocean levels. All other climatic dimensions were unchanged. Admittedly, this is a conservative vision of global warming, but our goal is to investigate an isolated effect of global warming, even if only part of the forecast rise in ocean levels should take place.
The flooding impact of a 1-foot rise in ocean level is profound. Given the current pattern of randomly fluctuating river levels, the oceanic rise would put the islands much more frequently in the highest risk level for flooding.
For example, if we relate the river level to certain levee height requirements estimated for each island by the U.S. Army Corps of Engineers, we find historically that when this measure has exceeded a given level, the frequency of overtopping floods has significantly jumped. Past river levels exceeded the critical measure 31.5% of the time. A permanent 1-foot increase in the river levels would increase that figure to 61.3%. The probability (averaged over all water levels) of an overtopping flood on an island in any year would nearly double, from 0.0047 to 0.0091.
The impact of a 1-foot rise on the likelihood of stability failures is slightly more pronounced. Increased pressure on the levees would lead to an increased probability (averaged over all water levels) that an island would suffer stability failure, from the current 0.0088 to a projected 0.0182.
Using the simulation procedure, we can estimate the effect these increased chances of flooding would have on the costs of three alternative flood control policies for the Delta. The three alternatives are (1) the past policy, whereby all flooded islands are reclaimed (this is the basis of the original systems model); (2) a modified policy, whereby the 13 islands that either have population centers, are crossed by major highways, or are crossed by the EBMUD aqueduct are reclaimed if flooded, but the other 33 islands are not; and (3) the extreme policy, whereby no flooded island is reclaimed.
Alternative 1. Under past environmental conditions, the Delta has averaged 0.62 floods per year (about 31 per 50-year period), with an average annual total cost of $18.2 million in 1986 dollars. The higher probability of flooding associated with global warming would more than double the average number of floods per year to 1.32 (about 66 per 50-year period), with an expected annual cost of $34 million (a cost increase of 86%).
Using a 10% discount factor, the present value of a 50-year stream of costs for these floods is $334.1 million with higher ocean levels, compared with $177.9 million under current climate conditions. The implication of such a sizeable growth will be discussed below.
Alternative 2. Reclaiming only 13 islands (Andrus-Brannan, Bethel, Byron, Bouldin, Jones, New Hope, Palm, Roberts-Drexler, Sherman, Terminous, Victoria, Walnut Grove, and Woodward) would result in mixed costs: lost property and land for the unreclaimed islands, and damage and reclamation costs for the 13 restored islands. Maintenance still can be performed on any unflooded island. The present value of this policy offers a better mechanism for comparison than the average cost per year, because costs associated with flooded but nonreclaimed islands tend to cluster in the earlier part of a 50-year period, and do not repeat over the entire horizon, as do costs for the reclaimed islands.
For the current climatic environment, the present value of costs for this policy is $175.3 million. The comparable figure for a 1-foot higher ocean level would be $298 million, a jump of 70%. Over 50 years, an average of 15 islands would flood and remain unreclaimed under current conditions, compared with slightly more than 22 islands, given higher water levels.
Under current market-value conditions, the costs of partial reclamation are about the same as those of total reclamation. However, the higher likelihood of flooding associated with increased ocean levels makes the partial reclamation policy slightly cheaper.
Alternative 3. The economic interpretation of a policy stipulating that no flooded island be reclaimed is more difficult. Although the first two alternatives include the costs of temporarily closing major highways and the EBMUD aqueduct, the permanent closure of either function would create costs well above those estimated here. New, permanent highway routes would have to be developed for vehicles that now move across the Delta, and that would increase transportation costs. EBMUD would also need to find new aqueduct sources and routes.
However, the simulation results suggest that given current climate conditions, a policy of nonreclamation would “lose” about 21 islands over a 50-year periodMdashislands representing some 44% of the total value of the 46 islands studied (excluding highway and aqueduct costs). The 1-foot increase in ocean levels would result in loss of about 31 islands, at nearly 65% of the value of the 46 islands.
Conclusions
The rise in ocean level we postulate here as a result of global warming is relatively conservative. We have considered neither the potential changes in rainfall and snowpack meltdown nor changing water quality that might result from such a climate change. As a result, the total impact of global warming on the Delta could easily exceed the results given here.
However, based on the simulated effects of just minimal climatic changes, the increased flooding associated with global warming and changing ocean levels should be considered in policy decisions relating to the Delta. Proposed policy changes that in the past may have been economically marginal may become feasible under more adverse flooding conditions.
For example, the costs of flood protection proposals advanced in the early 1980s by the U.S. Army Corps of Engineers might exceed the present costs of the above three alternatives, given current environmental conditions. But should conditions change, such plans might prove more attractive. Similarly, economic evaluations of alternative uses for the Delta islands, such as water storage or aquaculture, should consider the potential for long-run climate change. Physical changes to the Delta should be planned with the understanding that they may have to withstand the environmental changes brought about by global warming.
Further reading
“Global Climate Change and Its Effects on California: Research Needs and Recommendations,” a University of California Workshop Executive Summary, published by UC Davis (July 1989).”
“An Economic Analysis of Flood Control Policy in the Sacramento-San Joaquin Delta,” a detailed presentation of the model development and cost estimations by the author of this article, published by the UC Water Resources Center (June 1989).
Global warming and the Sacramento-San Joaquin Delta

