


All Issues
Immigration reform and California agriculture a year later
Publication Information
California Agriculture 44(1):24-27.
Published January 01, 1990
PDF | Citation | Permissions
Abstract
A February 1989 survey indicated the 1986 law had not yet affected crop production, wages, or employment.
Full text
The Immigration Reform and Control Act (IRCA) of 1986 prohibits U.S. employers from knowingly hiring illegal or unauthorized alien workers, grants legal status to some unauthorized aliens who have lived or worked in the United States, and includes special provisions to assure agriculture of an adequate labor supply.
We conducted a survey designed to obtain data on employment, wages, and production practices in 1988, a critical period for assessing the effect of immigration reform on the California farm labor market. The survey covered the period just before the December 1, 1988, imposition of sanctions against employers who knowingly hire illegal immigrant workers in perishable agriculture.
Earlier studies assessed the effects of IRCA in California (see California Agriculture, May-June and November-December 1988). Information gathered in this survey is intended to delineate the structure and functioning of the labor market before employer sanctions took full effect and provide a benchmark against which effects of IRCA can be gauged when followup data become available.
A 46-question survey booklet was mailed in February 1989 to a random sample drawn from a file of approximately 15,000 California farm employers maintained to generate the wage and employment estimates published in the U.S. Department of Agriculture quarterly Farm Labor. This list is derived primarily from employers whose Standard Industrial Classification codes for paying unemployment insurance taxes are 01 (crops), 02 (livestock), and farm-oriented 07 (agricultural services). Almost 2,500 surveys were mailed, but about 200 were returned by the post office, and about 250 were returned but not completed because, for example, the recipient hired no labor in 1988 or had sold the operation. The response rate was about 25% of the remaining 2,050 surveys, quite high in light of the detailed questions asked about a sensitive subject. The analysis in this paper is based on 300 fairly complete responses from 500 employers.
Respondents were reasonably representative of California agriculture. The average respondent paid $168,000 in wages in 1988, compared with $156,000 in 1987 for all agricultural employers who paid unemployment insurance (UI) taxes in California (Employment Data and Research Report 882, 1989). In 1988, about 51% of total employment on responding farms was in the San Joaquin Valley; UI data indicate that 42% of 1987 annual average employment was in the San Joaquin Valley. About 42% of survey employment was on grape farms; UI data show 18% of average annual crop employment on such farms. Survey respondents appear to reflect the regional distribution of farm employment better than the commodity distribution.
Employee legal status
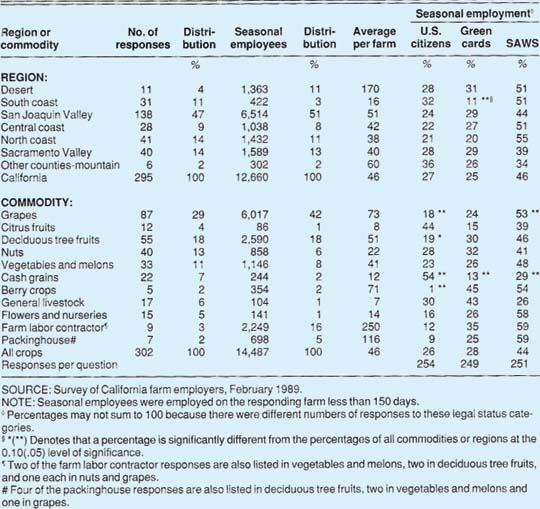
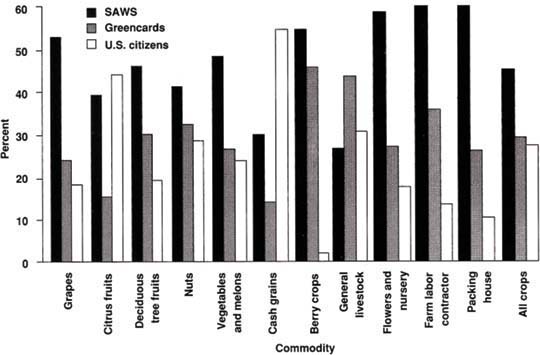
Employers were asked to report the legal status of their seasonal workers. It may have been hard for farmers to ascertain the legal status of employees in 1988 if they did not complete 1-9 employment verification forms. However, 85% of the respondents did estimate how many of their seasonal workers were U.S. citizens, green-card immigrants, “special agricultural workers” (SAWs), and in other categories. SAWs (persons who applied for legal status on the basis of farm work done as illegal aliens in 1985-86) were 46% of all seasonal workers in 1988 (table 1). The percentage of SAWs was above average in the north coast region (55%) and below average in the Sacramento Valley and other (primarily mountain) regions; however, these differences between regions are not statistically significant. The share of SAWs was significantly below average on grain farms (29%), and significantly above average in grape operations (53%) (fig. 1).
Employers who reported a low proportion of SAWs probably had relied more on U.S. citizen and legal immigrant workers before 1988. On grain farms, a lower number of SAWs was associated with a higher number of U.S. citizens. This same inverse relationship between SAWs and U.S. citizens was reported by berry farmers, where a majority of seasonal employees were SAWs and almost none were U.S. citizens.
This straightforward interpretation of SAWs reflecting a previous dependence on illegal alien workers may be misleading if newly legalized workers began to change their behavior in 1988. For example, a higher percentage of SAWs in 1988 could reflect relatively better wages and working conditions if SAWs had several job options.
The legal status distribution reported in the 1989 survey most closely reflects the perceptions of grape and tree fruit employers and farm labor contractors (FLCs) in the San Joaquin Valley. Over half of the seasonal workers distributed across these legal status categories were in the San Joaquin Valley, and about 90% worked on grape and tree fruit farms or for labor contractors.
Turnover and responses to IRCA
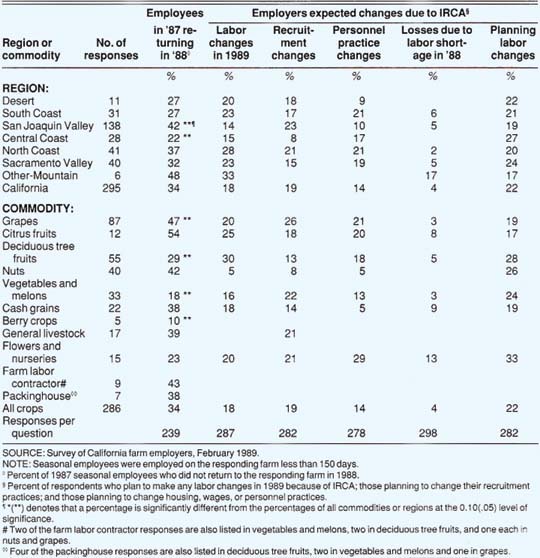
The survey asked employers how many of their seasonal workers in 1988 had worked for them in 1987. Overall, only onethird of the seasonal workers in 1988 had worked on the responding farm in 1987. The proportion of returning workers was significantly below average in the central coast region and significantly above average in the San Joaquin Valley (table 2). The share of returning workers was significantly above average in grapes and below average in berry crops, vegetables and melons, and tree fruits. Packinghouses are sometimes considered preferred $eLmployers because they offer inside work and, often, employee benefits. Surprisingly, however, farm labor contractors reported a higher proportion of returning seasonal workers than did packinghouses.
By legalizing so many workers, the SAW program may have increased farm worker mobility. The extension of legal status to half of the farm work force and the high turnover among seasonal employees suggest that, if the employer sanctions in IRCA are successfully enforced, farmers will have to make major changes in their employment and/or production practices to adjust to a smaller and more legal work force, or they will have to obtain new immigrant workers.
Most employers did not expect to make any changes in 1989 that would affect their labor needs. Only 18% of the respondents planned to make such changes in their major commodity, and there was no consistent pattern in these expected changes. Deciduous tree fruit farms, for example, had a lower-than-average proportion of returning seasonal employees and the highest share of respondents who expected to make changes that would affect their labor needs because of IRCA. Berry crops, on the other hand, had the lowest percentage of returning workers, yet none of the responding farms expected to make changes in 1989 that would affect their labor needs.
Employers were asked whether the changes planned because of IRCA would increase or decrease their labor needs. Most of the handful who planned to make changes reported that their labor needs would decrease because fewer acres would be planted, there would be less pruning, more machinery would be used, or more employees would be hired through labor contractors. In most instances, labor savings were expected to be in the 5% to 10% range.
There has been speculation that farm employers will change their personnel policies because of IRCA. For example, employers might encourage local or settled workers to be available for seasonal jobs by developing seniority systems, providing housing, or increasing wages and benefits. However, fewer than one-fifth of the respondents planned to change their recruitment practices. Even fewer planned to add employee benefits, provide housing, or make other changes that might reduce employee turnover from year to year. The personnel change mentioned most often was the intention to turn more seasonal employment over to labor contractors.
Employment
Employers were asked to report their total number of employees in 1988 and then to report separately the seasonal workers who were employed less than 150 days on their farms in 1986, 1987, and 1988. Respondents employed an average of 53 persons in 1988, including 46 seasonal workers. The distribution of seasonal workers between regions and commodities was stable between 1986 and 1988. About half of the total and seasonal employment was in the San Joaquin Valley, where employers reported an average of five regular and 51 seasonal employees. Farms in the desert counties had the largest work force, and those in the south coast the smallest.
Grapes accounted for almost half of total employment and over half of all seasonal employment; grape growers averaged six regular and 73 seasonal employees perfarm. Vegetable farms, nurseries, and livestock ranches had about equal proportions of regular and seasonal employees. Berry crops had the highest proportion of seasonal workers; 96% of the berry employees were employed on responding farms less than 150 days in 1988.
About a fifth of the respondents reported hiring workers through labor contractors or custom harvesters in 1988, usually to harvest crops or to prune trees and vines. In the San Joaquin Valley, 42% of the respondents used labor market middlemen, while in the desert region, only 9% did. About twothirds of the citrus farms hired labor through contractors, but none of the berry or livestock farms or nurseries did.
Most workers employed on responding farms were seasonal employees. For every regular employee, there were 3.4 seasonal employees. Seasonal employment increased about 20% between 1986 and 1988. This increase was most noticeable in the mountain region, where seasonal employment doubled. Most of the additional seasonal workers, however, were hired by San Joaquin Valley grape operations.
Hourly wages
Employers reported the average hourly wage paid to seasonal workers in 1986, 1987, and 1988 (table 3). After July 1, 1988, this was just over $5 hourly, the same average wage reported since the early 1980s in wage surveys. Average hourly wages for seasonal employees in 1988 ranged from a low of $4.58 in the San Joaquin Valley (significantly below the average for all other regions) to $5.47 in the north coast. Average hourly wages increased 8% between 1987 and 1988 and 13% between 1986 and 1988. Wages increased most in the Sacramento, south coast, and mountain regions. The smallest wage increase were in the desert and central coast regions, which have traditionally higher than average wages.
Wages were also reported by major commodity, and the commodity tabulation also indicates an average wage of just over $5 per hour. There was a similar 13% wage increase between 1986 and 1988, but almost no increase in livestock wages. Nursery wages, which were the lowest in 1986, rose 21% by 1988, but nurseries in 1988 continued to report the lowest average wages. Citrus growers reported the highest wages for seasonal employees in both 1986 and 1988, as well as an above-average rate of increase. However, there were relatively few seasonal employees on responding citrus farms.
About half of the respondents reported that they increased wages for regular and seasonal workers on July 1, 1988, when the California minimum wage rose from $3.35 to $4.25 per hour. Significantly fewer respondents raised wages for employees hired through labor contractors. Only 21% raised FLC wages after July 1, 1988, perhaps because growers and FLCs had already signed contracts to have work done at wages prevailing before the minimum wage was raised. Alternatively, the ample supply of workers in 1988 may have made wage increases unnecessary. FLC wage increases were most frequent in the San Joaquin Valley and in citrus.
About 42% of the respondents paid piecerate wages. One-third of these employers raised these rates an average of 17% when California's minimum wage increased on July 1, 1988. However, most piece-rate employers did not raise these wages in 1988. The most common rate reported, picking raisin grapes in the San Joaquin Valley, paid an average of 16 cents per 22-pound tray in 1988.
Payroll data
Most respondents provided payroll data that allowed us to analyze costs of payroll taxes for Social Security, workers compensation, and unemployment insurance, and of employee benefits such as health insurance, vacation pay, and pension contributions. Employers who provided complete information reported that payroll taxes averaged 16% and employee benefits 7% of total payroll costs. The respondents who produced crops paid about $32 million in wages in 1988, or about 1.5% of the crop wages reported to unemployment insurance authorities.
We calculated the relative costs of payroll taxes and employee benefits. For example, on grape farms, payroll taxes were 20% of total payroll costs and employee benefits were 8% of their $116,000 average payrolls. Only livestock farm employers paid more for employee benefits than for payroll taxes. Respondents producing crops reported that payroll taxes typically cost twice as much as employee benefits. For example, vegetable and melon farm employers reported that payroll taxes were 13% and employee benefits were 7% of payroll costs. In deciduous tree fruits, payroll taxes cost six times more than employee benefits.

For seasonal employees, payroll taxes were 19% and employee benefits only 2% of the average $58,000 payroll. Most respondents reported that they offered seasonal employees no benefits; if they offered them benefits, the cost was low. Our results suggest that seasonal employees are not usually offered health insurance, paid vacations and holidays, and pensions, especially in citrus, tree fruits, nuts, cash grains, berries, and nurseries.
A regional analysis of payroll taxes and employee benefit costs indicates that benefit costs are higher than average in the central and south coasts, where previously unionized vegetable farms are concentrated, and lowest in the north coast and mountain counties. Desert and central coast respondents had the highest average payrolls, and north coast and mountain counties the lowest.
A similar payroll cost ananlysis in 1987 indicated that payroll taxes were 12% of payroll costs and employee benefits were 7%. This finding suggests that payroll taxes have increased much more rapidly than employee benefit costs in California agriculture.
According to the Bureau of Labor Statistics, which periodically analyzes the cost of payroll taxes and employee benefits, nonfarm payroll taxes in 1988 were 9% and employee benefits were 18% of total payroll costs. This means that California farm employers spend almost as much as nonfarm employers for nonwage payments. However, in agriculture, payroll taxes are more than twice as much as employee benefits, while in nonfarm labor markets, employee benefits are more than twice as much as payroll taxes.
Conclusions
Our survey of California farm employers in February 1989 indicates that 1986 immigration reforms have not yet had any significant effects on crop production, wages, or employment. Employers reported that nearly half of their 1988 seasonal workers were illegal aliens in 1985-86 who had applied for legal status under the special agricultural worker program. These employers reported that they were making few efforts to retain these newly legalized SAWs with changes in wages, benefits, or personnel practices. Instead, many employers expected to hire more workers through farm labor contractors, if immigration reforms eventually shrink their traditional seasonal work forces.
Responding employers hired an average of 53 employees, including 46 seasonal employees who were paid an average $5.15 hourly after California's minimum wage was raised to $4.25 on July 1, 1988. About half of these employers raised wages to their own employees on July 1, 1988, but fewer raised the wages of workers hired through labor contractors.
Employers reported that almost onefourth of their $168,000 average wage bills were spent on nonwage payments for payroll taxes and employee benefits. Although these nonwage payments were about as much in agriculture as they are in nonfarm labor markets, the payroll tax and employee benefit shares are almost reversed: California farmers reported that payroll taxes were 16% and employee benefits 7% of total payroll costs, while U.S. nonfarm employers reported that payroll taxes were 9% and employee benefits 18% of total payroll costs. Seasonal workers received almost no employee benefits: for seasonal workers, payroll taxes were 19% and employee benefits 2% of the average $58,000 seasonal employee payroll.
Farm labor contractor activity may be a useful indicator of IRCA's effectiveness. FLC activity has been associated in the 1980s with the employment of recent and often unauthorized alien workers, so expanding activity during the 1990s would suggest that FLCs are not having difficulty finding such workers. If FLC activity contracts and worker turnover from year to year decrease, then farmers would be adjusting to a smaller and more legal farm work force by hiring more workers directly rather than through intermediaries.
Immigration reform and California agriculture a year later

