


All Issues
Improvements to the soil nitrate quick test for California small grains
Publication Information
California Agriculture 76(2):93-99. https://doi.org/10.3733/ca.2022a0009
Published online August 01, 2022
PDF | Citation | Permissions
NALT Keywords
Abstract
Small-grain crop growers need to match their crops' nitrogen (N) needs with fertilizer applications. This can be challenging because small grains are grown under diverse conditions and their growing season interacts with unpredictable precipitation. Resulting conditions can lead to nitrate-N leaching and runoff losses. More widespread and accurate soil N testing could help growers improve N fertilizer use efficiency, reduce the risk of N loss, and fulfill regulatory requirements. Soil samples from across California small-grain growing regions were tested with a soil nitrate quick test as well as standard laboratory procedures. The quick test is inexpensive and easy to use, and it provides rapid results. A correction factor was developed to convert the quick test values to lab and fertilizer equivalents. The correction factor is based on site-specific soil bulk density and the extracting solution used. An interactive webtool was developed that integrates this information for users. The quick tests provide accurate, real-time estimates of soil nitrate-N in the field to help improve fertilizer use efficiency and reduce N losses.
Full text
Nitrogen (N) fertilizer is important for crop production, but applying excessive amounts wastes resources and has negative environmental consequences. Many winter small-grain crops are rainfed and grown in areas with unpredictable precipitation patterns. Excess precipitation can cause nitrate to leach into groundwater (Poch-Massegú et al. 2014) and run off into surface water, contaminating drinking water and aquatic ecosystems (Cameron et al. 2013). Regulatory programs, such as California's Irrigated Lands Regulatory Program, require growers to report their N efficiency practices and account for N inputs and sources on their farms, including soil available N in the root zones (Central Valley Regional Water Quality Control Board 2018). Testing for soil N is an important but often underutilized practice (Central Valley Regional Water Quality Control Board 2018). More widespread and accurate use of soil N testing could reduce input costs and increase yields and quality of crops while reducing N losses.
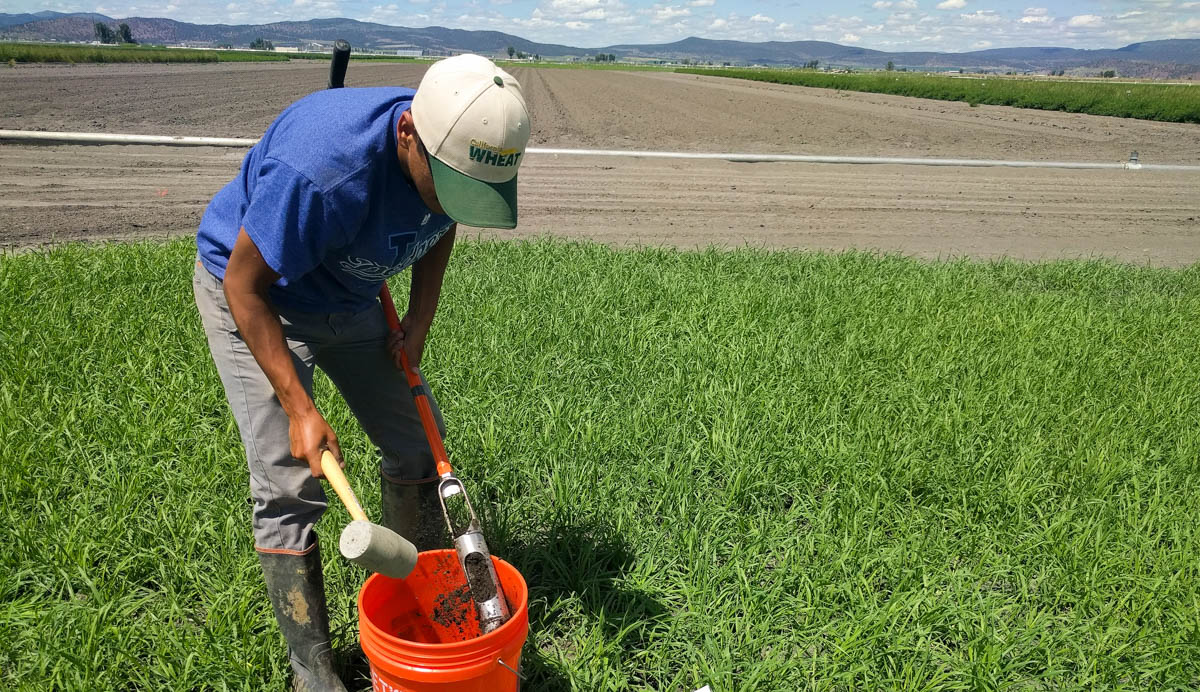
Researchers collecting soil samples from a small grain field in the Delta region. UC researchers modified the soil nitrate quick test to help simplify interpretation and increase the accuracy of its results, which could help growers improve fertilizer use efficiency. Photo: Taylor Nelsen.
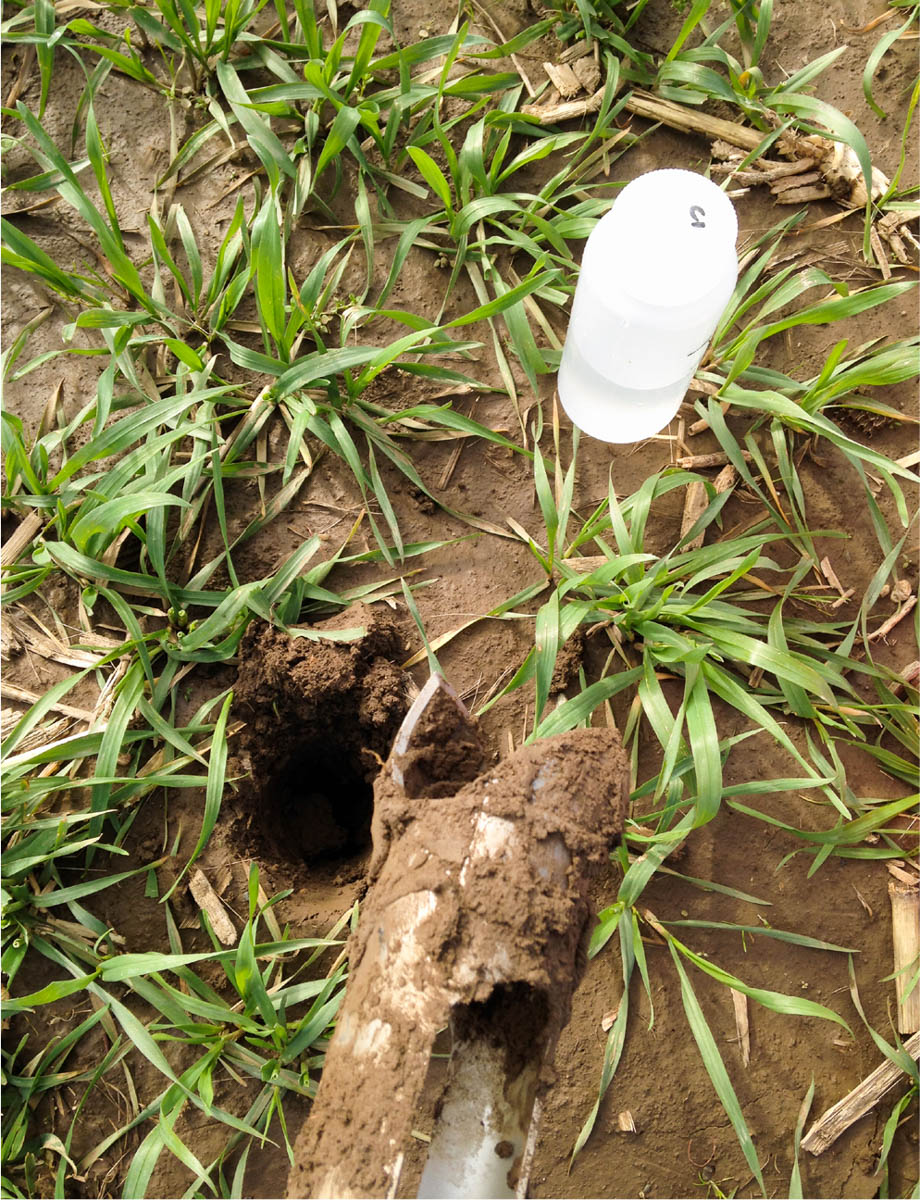
Taking a soil sample at a depth of 1 foot (0-12 inches) with an open auger in moist soil and getting ready to preform a nitrate quick test on the field-moist samples. Photo: Taylor Nelsen.
The soil nitrate quick test can be conducted in the field with relatively simple procedures and easily obtained materials, and its nitrate-N results correlate with results obtained by lab analysis (Breschini and Hartz 2002; Hartz et al. 1994; Hartz et al. 2000). This test is a more accessible and inexpensive alternative to laboratory soil N testing and it detects nitrate-N, which is typically the most plant-available form of soil N. The soil nitrate quick test is one of many types of on-site field nitrate tests that have been tested and are available for nitrate-N determination (Tully and Weil 2014). Nitrate moves easily within the soil-water-plant continuum, and concentrations of soil nitrate-N can change quickly in a field along with changes in soil moisture and plant demand. Therefore, the soil nitrate quick test has been especially recommended to inform in-season fertilization management decisions (Lazicki and Geisseler 2016).
Current recommendations for conducting a soil nitrate quick test are based on Hartz et al. (1994) and utilize a 3:1 ratio of a calcium chloride (CaCl2) solution to a homogenized soil sample. Factors such as soil texture (sand, loam, clay) and soil moisture (wet, dry) are used to correct soil nitrate quick test values to soil nitrate-N lab equivalents according to an empirically derived linear equation. Users employ a chart to self-identify their soil properties and convert their soil nitrate quick test value to a soil nitrate-N lab equivalent via a linear constant (Hartz 2010; Smith and Cahn 2019).
Based on more than 300 soil samples taken from 19 site-years across the small-grain growing regions of California, the original method reported by Hartz et al. (1994) has been modified and updated. Changes include: (1) expressing quick test as lab-equivalents via log-linear rather than simple-linear relationship (and then transforming the result back again for ease of interpretation), (2) incorporating statistical uncertainty into the estimation and reporting of quick test values, shown as a margin of error, (3) for the correction factor, using bulk density as a continuous variable rather than using broad categories of soil textures and (4) providing distinct estimates for quick tests conducted with or without calcium chloride in the shaking solution. In addition, a web-tool was developed from these data. This tool provides automated conversion of soil nitrate quick test values to nitrate-N fertilizer equivalent in pounds per acre based on map-enabled, site-specific soil information for California small-grain fields. These updates are intended to simplify interpretation and improve the precision of the soil nitrate quick test, thereby expanding its use in California agriculture.
Soil sampling methods
Samples were taken from the top foot (0 to 12 inches) of the soil profile from 19 different site-years that approximate the range of soil types and associated bulk densities for California small-grains crops (fig. 1). Sampling was conducted according to the principles outlined in Geisseler and Horwath (2016). A total of 327 soil samples were taken and analyzed between 2014 and 2019. Individual locations were often sampled multiple times within a season as soil nitrate levels changed or if there were known fertility gradients. Soil samples were placed in a paper bag and air dried until reaching equilibrium. They were then crushed into small pieces (< 0.2 inches). A separate set of equivalently sampled soils (n = 27) were taken from 10 site-years to compare soil nitrate quick test results using field-moist samples versus soils air dried in the lab.
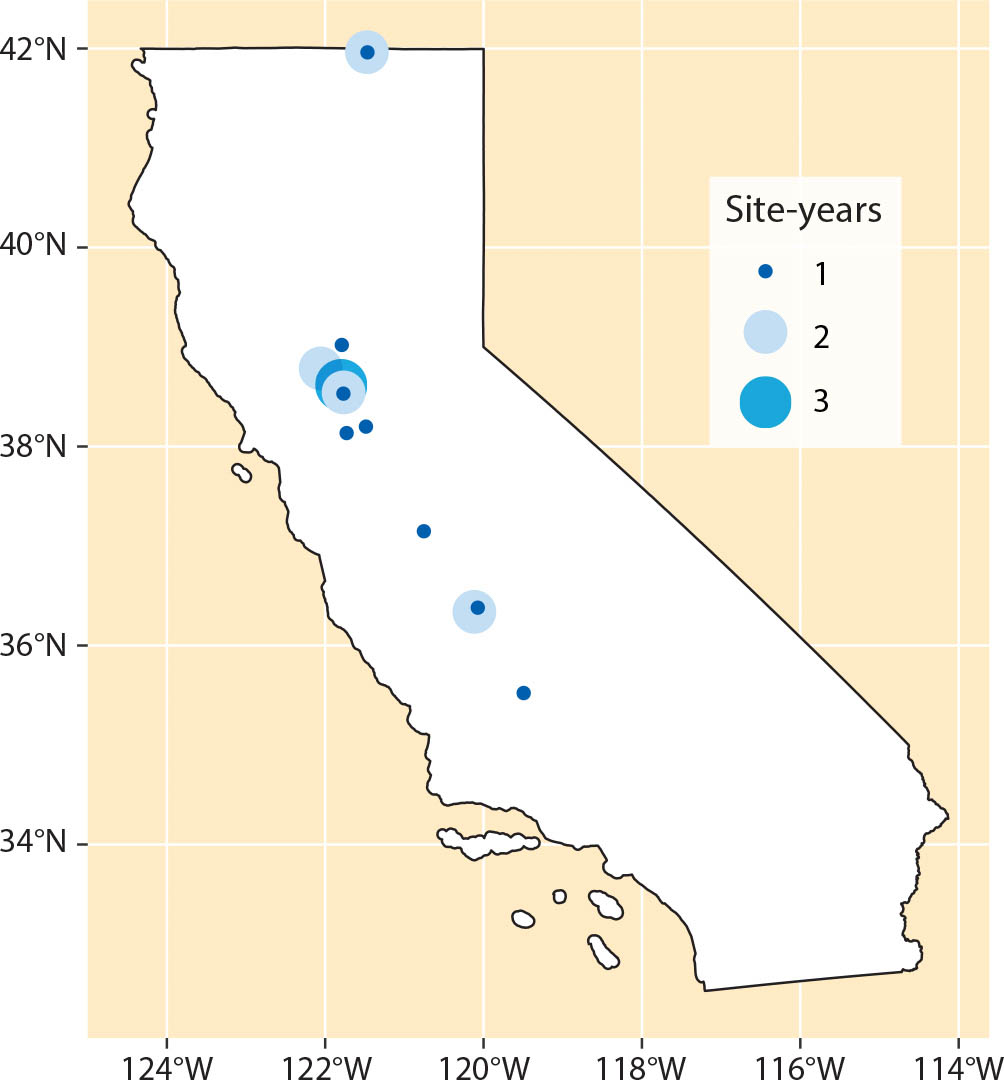
FIG. 1. Locations and the number of site-years at each location where soil samples were taken. Further information about site-years can be found in table 1.
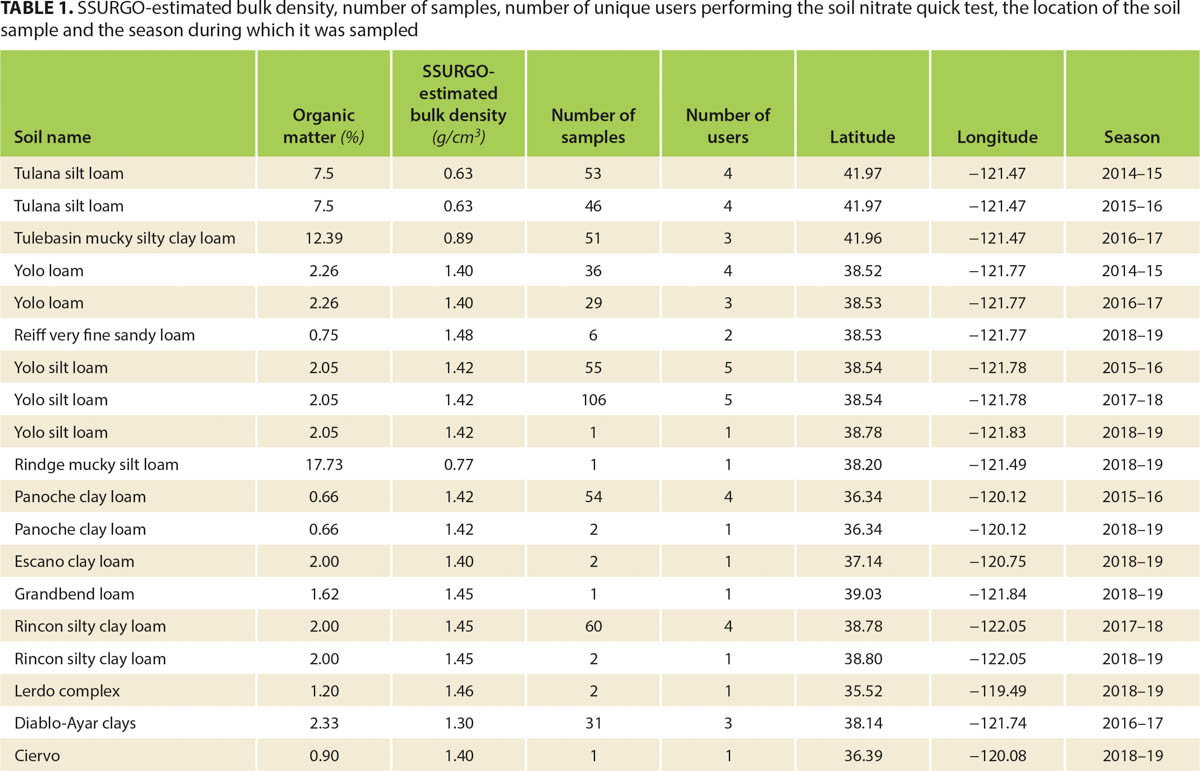
TABLE 1. SSURGO-estimated bulk density, number of samples, number of unique users performing the soil nitrate quick test, the location of the soil sample and the season during which it was sampled
Nitrate quick tests
Subsamples were tested for nitrate-N content using commercially available nitrate strips (WaterWorks). A ratio of one part crushed soil was added by volume to three parts distilled water or 0.01M calcium chloride solution for a total of 80 milliliters (ml) of soil solution. Soils were shaken for 3 minutes on a tabletop shaker on high speed. The nitrate-N pad on a strip was tested with a 10 parts per million (ppm) standard solution to ensure that the colorimetric response on the strip matched the 10 ppm nitrate-N box on the color ramp chart. A separate strip from the same bottle was then dipped into the shaken soil slurry, just enough to wet the edge of the nitrate-N pad and allow the solution to wick up the pad. After 60 seconds, the strip was read by the user by matching the color that had developed on the nitrate-N pad to the nitrate-N color ramp chart on the bottle. Bottles of test strips were kept in a cool, dry place until time of use to prevent discoloration and denaturing of the strips. If there was not an exact color match, the user visually estimated the best match for the sample concentration using the values on the color ramp chart. A corresponding subsample was tested for nitrate-N using typical laboratory procedures. Samples were either sent to the UC Analytical Lab or a nitrate-N extraction was performed using 6 grams (g) of crushed dried soil, extracted with 2M postassium chloride following the methods detailed in Doane and Horwath (2003).
The soils used to compare soil nitrate quick test values from field-moist soils and soils air dried in the lab were processed and measured as described above. In addition, in the field, they were tested with a 3:1 ratio of shaking solution to soil, but in larger quantities (300 ml:100 ml). Both calcium chloride and water-only shaking solutions were tested separately. The soil solution was shaken vigorously by hand for 3 minutes.
Another commercially available soil nitrate test was also evaluated (LusterLeaf Rapitest Soil Test Kits) using a subset (n = 34) of the same soils chosen to represent the range of values in the larger dataset. Tests were conducted as described in the product directions, and soil solutions were made with both 0.01M calcium chloride solution and distilled water only.

Researchers reading a soil nitrate quick test. First, the nitrate-N pad was dipped into the shaken soil slurry just enough so allow the solution to wick up the pad. After 60 seconds, the strip was read by the user by matching the color that had developed on the nitrate-N pad to the nitrate-N color ramp chart on the bottle. Photos: Taylor Nelsen.
Soil data
Site-specific bulk density was estimated using the SSURGO database (USDA NRCS 2012; USDA NRCS 2019) based on the geographic coordinates of each soil sample. The variable representing the oven dry weight of the less than 2 millimeters (mm) soil material per unit volume of soil at a water tension of one-third bar was used (approximating field capacity) (USDA 2014). Values used and presented here are a component weighted average of these bulk densities for soil types present in the top foot. It is important to note that bulk density can change due to management and time, and that no direct measurements were made or analyzed in this study. SSURGO-estimated bulk density was used as a covariate in the mixed linear models and as a moderating variable in the conversion of soil nitrate-N lab equivalent to a fertilizer equivalent (i.e., pounds per acre [lb/ac] nitrate-N in the top foot) in the web-tool.
Statistical models
Statistical models with both fixed and random variables (mixed linear models) were used to understand the source of variation resulting from differences in the explanatory variables of soil nitrate-N concentration (measured by the soil nitrate quick test), SSURGO-estimated soil bulk density, extracting solution type, soil moisture status, site-year and user. Repeated measures within a site and/or season (spatial and temporal autocorrelation) were accounted for within the models (nested, random effects). The nonlinear fixed effects (nlme) package in R was used to fit these models (Pinheiro et al. 2020; R Core Team 2020). The significance of each factor and its effect on other factors was tested in relation to soil nitrate-N lab values as the response variable. Both user and site-year were significant factors when tested in a linear model. Because the quick test to lab-value correction equation needs to be valid for any site-year or user, these factors were accounted for as random variables. Soil nitrate-N lab values and soil nitrate quick test values were expressed in logarithmic terms in order to meet model assumptions for analysis and then transformed back to their original values for interpretation. The final model is shown below:
ln(lab measured nitrate-N value + 1) = ln(quick test pad value + 1) × SSURGO-estimated soil bulk density + ln(quick test pad value + 1) × extracting solution + SSURGO-estimated soil bulk density × extracting solution, random = ~ 1| site-year/user
Type-three ANOVA and marginal R2 values were used to describe the statistical significance of the factors and the percent of variation explained by the model.
Development of a web-tool
An R Shiny tool (Nelsen et al. 2020) was developed that enables users to access the statistical model and SSURGO soil data used in this analysis for their specific location by dropping an interactive map pin at the site of their soil sample. Soil data and the user interface are limited to areas of agricultural production in California (California Department of Water Resources 2014). Users can then enter the soil nitrate quick test value measured, choose whether their test was conducted with a calcium chloride or water-only extracting solution, and adjust the default SSURGO-estimated bulk density, if desired. The web-tool interactively predicts the site-specific soil nitrate-N lab equivalent, fertilizer N equivalent, and an estimate of the margin for error using the results of the mixed linear model reported here. The underlying, open-source code for the web-tool is available at github.com/Grain-Cropping-Systems-Lab/UC-Small-Grain-Soil-Nitrate-Quick-Test-Tool .
Results compared to lab
The soil nitrate quick test was a good proxy for the soil nitrate-N status in small-grain fields. Based on the mixed effects model, quick test values and values measured using standard laboratory methods had a loglinear relationship (P = 0.02, R2 = 0.83; fig. 2, table 2).
![Linear relationship between the soil nitrate quick test values (ppm) that appear on the WaterWorks color-ramp and the lab equivalent nitrate-N in dry soil (ppm) for the minimum and maximum SSURGO-estimated bulk density tested as well as the standard error that surrounds the estimates. The regression equations are as follows:For water-only shaking solution:lab nitrate-N equivalent = [e1.16 + 1.03ln(pad value + 1) - 0.15(bulk density) - 0.18ln(pad value + 1)(bulk density)] - 1for calcium chloride shaking solution:lab nitrate-N equivalent = [e0.76 + 0.95ln(pad value + 1) + 0.19(bulk density) - 0.18ln(pad value + 1)(bulk density)] - 1](http://ucanr.edu/sites/calagjournal/archive/?image=fig2022a0009p5.jpg)
FIG. 2. Linear relationship between the soil nitrate quick test values (ppm) that appear on the WaterWorks color-ramp and the lab equivalent nitrate-N in dry soil (ppm) for the minimum and maximum SSURGO-estimated bulk density tested as well as the standard error that surrounds the estimates. The regression equations are as follows:For water-only shaking solution:lab nitrate-N equivalent = [e1.16 + 1.03ln(pad value + 1) - 0.15(bulk density) - 0.18ln(pad value + 1)(bulk density)] - 1for calcium chloride shaking solution:lab nitrate-N equivalent = [e0.76 + 0.95ln(pad value + 1) + 0.19(bulk density) - 0.18ln(pad value + 1)(bulk density)] - 1

TABLE 2. The soil nitrate quick test pad reading (ppm) and the equivalent lab value (ppm) for the different shaking solutions and SSURGO-estimated bulk density at representative values in the range of tested values
For water-only shaking solution:
lab nitrate-N equivalent = [e1.16 + 1.03ln(pad value + 1 - 0.15(bulk density) - 0.18ln(pad value + 1)(bulk density)] - 1
For calcium chloride shaking solution:
lab nitrate-N equivalent = [e0.76 + 0.95ln(pad value + 1) + 0.19(bulk density) - 0.18ln(pad value + 1)(bulk density)] - 1
The concentration of soil nitrate-N explained 75% of the overall variation in the linear relationship between the quick test and laboratory methods. The SSURGO-estimated bulk density, type of extracting solution, and their interactions explained another 7% of the variation in the linear relationship. Of this 7%, the interaction between the quick test value and the SSURGO-estimated bulk density explained most of the variation. Soils with lower bulk densities required larger correction coefficients (P < 0.01) (fig. 2, table 2). This is due to the fact that the soil-to-liquid ratio was established by volume in the quick tests, and soils with lower bulk densities have less mass per unit soil volume. There was also a significant interaction between the shaking solution used and the linear correction (P = 0.02) (fig. 2, table 2). Specifically, at higher soil nitrate values, quick tests conducted in a water-only shaking solution required larger correction coefficients than tests conducted in a 0.01M calcium chloride solution. Errors were greater when soils had very low soil nitrate quick test values (< 5 ppm) as well as when lower bulk density soils were tested without calcium chloride in the mixing solution (fig. 2, table 2).
There was no significant difference between nitrate-N measured with quick tests conducted on field-moist soils versus tests conducted on air dried and crushed soils (P = 0.31). As a result, the data presented here do not support translating quick tests to lab equivalent values using a correction factor for moist versus dry soil as in Hartz (2010). The results also indicate that soils can be accurately tested for nitrate in the field without the need to dry and crush the soil. Additionally, there was no interaction between the soil moisture status and the extracting solution used. The effect of SSURGO-estimated bulk density on quick test interactions with soil moisture could not be explored due to the lack of variation in bulk density in this data subset.
The commercially available soil nitrate tests (LusterLeaf Rapitest Soil Test Kit) showed similar linear relationships to standard laboratory values as the quick test (P < 0.01). However, these tests were less accurate (R2 = 0.59 versus R2 = 0.83) (data not shown).

An example output of The Soil Nitrate Quick Test Web-Tool in Davis, Calif., with a quick test pad value of 10 ppm.
Web-tool
Because the relationships between quick test and laboratory equivalent soil nitrate-N values are log-linear and interact with both continuous variables and broad categories (e.g., SSURGO-estimated bulk density and extracting solution), translating a quick test value to fertilizer equivalent is less straightforward than applying a simple linear correction. To address this and simplify the translation and interpretation of quick test values, a web-tool was developed based on the quantitative relationships presented here. The tool allows users to input their site and quick test information, displays the site-specific soil properties, and automatically converts quick test values to laboratory equivalent and fertilizer equivalent values using the conversion of the nitrate-N lab equivalent (ppm) to lb/ac nitrate-N in the top foot. This conversion was accomplished according to the equation below:
((nitrate – N lab equivalent (ppm))/1,000,000) × (bulk density g/cm3) × (30.48 cm/1 ft) × 1 ft × (1 lb/453.6 g) × (929 cm2/1 ft2) × (43,560 ft2/1ac) = nitrate − N fertilizer equivalent (lb/ac)
The web-tool is available at smallgrain-n-management.plantsciences.ucdavis.edu/snqt/ . The underlying open-source code is available at github.com/Grain-Cropping-Systems-Lab/UC-Small-Grain-Soil-Nitrate-Quick-Test-Tool .
Quick test has improved accuracy
The soil nitrate quick test provides an accurate estimate of soil nitrate-N availability. Because soil nitrate-N concentrations can change rapidly with changes in the soil water status of a field, it is important to test soil nitrate-N near to the time when a N fertilizer decision is being made. A soil nitrate quick test value greater than 20 ppm typically indicates there is sufficient soil N for immediate plant needs (Fox et al. 1989) and often indicates that N fertilization is not required. However, soil nitrate information should be paired with other plant N status indicators to provide a holistic picture of crop N sufficiency/deficiency (Bowles et al. 2015).
The purpose of these improvements to the estimation of soil nitrate-N via quick tests is to make soil nitrate testing more accurate and easily accessible to California small-grain growers as well as other farmers, with the goal of reducing N fertilizer costs, improving fertilizer efficiency and minimizing N losses. Because regulations now require growers to report their N efficiency practices, these soil nitrate quick tests can be a very useful tool going forward.
Improvements to the soil nitrate quick test for California small grains

