


All Issues
Agricultural water use accounting provides path for surface water use solutions
Publication Information
California Agriculture 74(1):46-57. https://doi.org/10.3733/ca.2020a0003
Published online March 17, 2020
PDF | Citation | Permissions
Abstract
Agricultural water demands can conflict with habitat needs in many North Coast watersheds. Understanding different water use patterns can help reduce conflict over limited supplies. We measured on-farm crop water use and conducted grower interviews to estimate the agricultural water demand in the upper Russian River and Navarro River watersheds. Annual agricultural water demand was less than 11% in the Russian River, and 2% in Navarro River, of the total annual discharge in each watershed. However, because demands are concentrated in the dry season when instream flows are at a minimum, these relatively small amounts can represent a significant constraint to stream habitat conditions. We have shared our study results in broad basin and community water resource planning efforts, including flow management of the Russian and Navarro rivers and implementation of the Sustainable Groundwater Management Act in the Ukiah Basin. Findings and recommendations from this study have influenced on-the-ground solutions to meet water demand in these watersheds, including construction of off-stream wintertime storage capacity to replace summertime stream diversions, and use of a municipal recycled water conveyance system as a replacement for summer diversions.
Full text
Satisfying water demands for multiple uses in California is an increasingly acute and difficult issue. High interannual climate variation characterized by successive drought and flood years introduces extreme uncertainty into water allocation decisions. During drought, allocations for agricultural use have been curtailed and environmental flows reduced to perilous levels for endangered and threatened wildlife (NOAA 2005). The Russian River Basin exemplifies the challenges of managing water for agriculture and the environment and has become the focus of recent state regulations (2015–2016 Russian River Tributaries Emergency Regulation Information Order) to more accurately account for water demands within tributary streams that support critical habitat for coho and steelhead trout.
Another significant policy enacted to address competing demands in the Russian River is the 2013 California State Water Resources Control Board (SWRCB) Policy for Maintaining Instream Flows in Northern California Coastal Streams (SWRCB 2013; SWRCB 2014). The purpose of this policy is to develop a streamlined process for reviewing and approving pending water rights applications, which in some cases have been delayed for decades by the SWRCB Division of Water Rights. The policy requires water rights applicants to meet stringent minimum instream bypass flow requirements and to consider alternatives for meeting their respective water needs, including water conservation and use of alternative sources.
Results from a UC Cooperative Extension study of the upper Russian River and Navarro River watersheds indicate that, on an annual basis, the amount of water used for crop production in both watersheds is small relative to total annual discharge.
To avoid impacts to the environment, more research is needed to better understand and manage agricultural water demands. Completed and ongoing studies in the Russian River watershed are generating water budgets and insight into the relationships between water use and stream flows. There are differing indications that subsurface and groundwater stores have been impacted over the last two decades in both mainstem reaches of the Russian River (Constantz et al. 2003; Marquez et al. 2016) and tributary watersheds like Alexander Valley (Metzger et al. 2006). Deitch (2006) correlated changes in stream flow to daily agricultural water use patterns and found evidence of direct steam flow reductions during irrigation periods. These and other investigations point to knowledge gaps about the timing and volume for water uses like agriculture that can support development of solutions to reduce impacts to the environment and competition for limited water supplies.
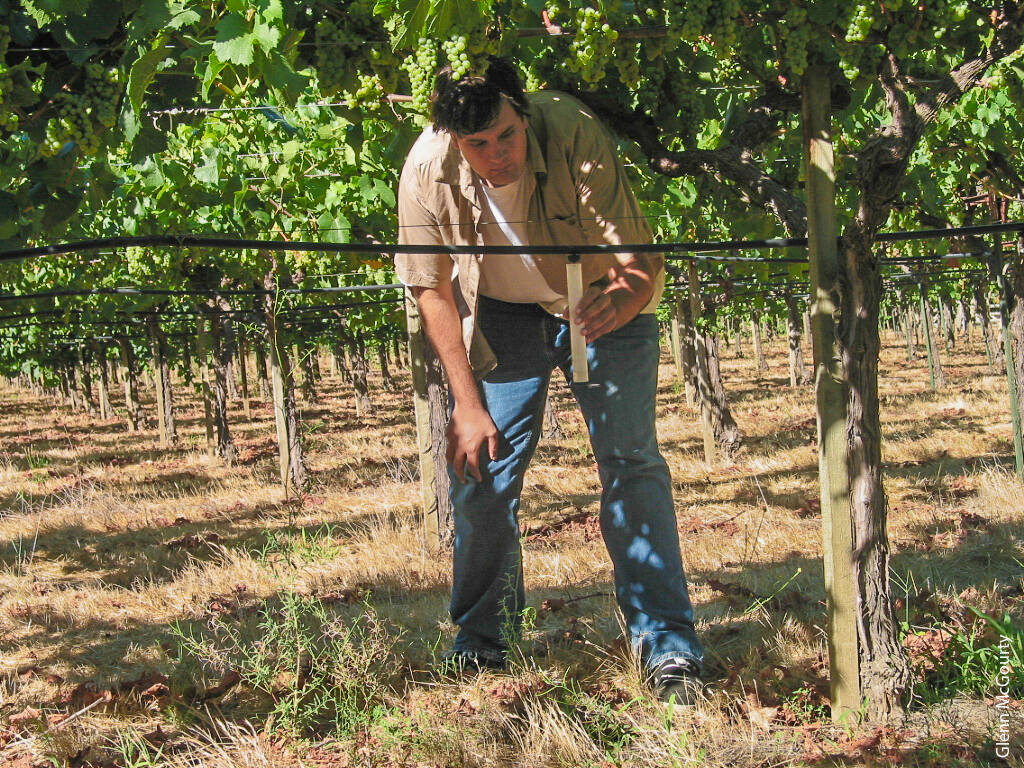
Our premise is that the best opportunity to relieve competition for water involves working with local agriculture to generate an accurate accounting of current and future water demand, including location and timing of use, and evaluate existing and potential options for meeting this demand. To serve that purpose, the primary objective of this study was to calculate agricultural water demand in the Mendocino County portion of the Russian River and Anderson Valley portion of the Navarro River watersheds (fig. 1). This includes the volume and timing, or seasonality of use, that could then be compared to annual and seasonal fluctuations in stream flow volumes and environmental flow demands.
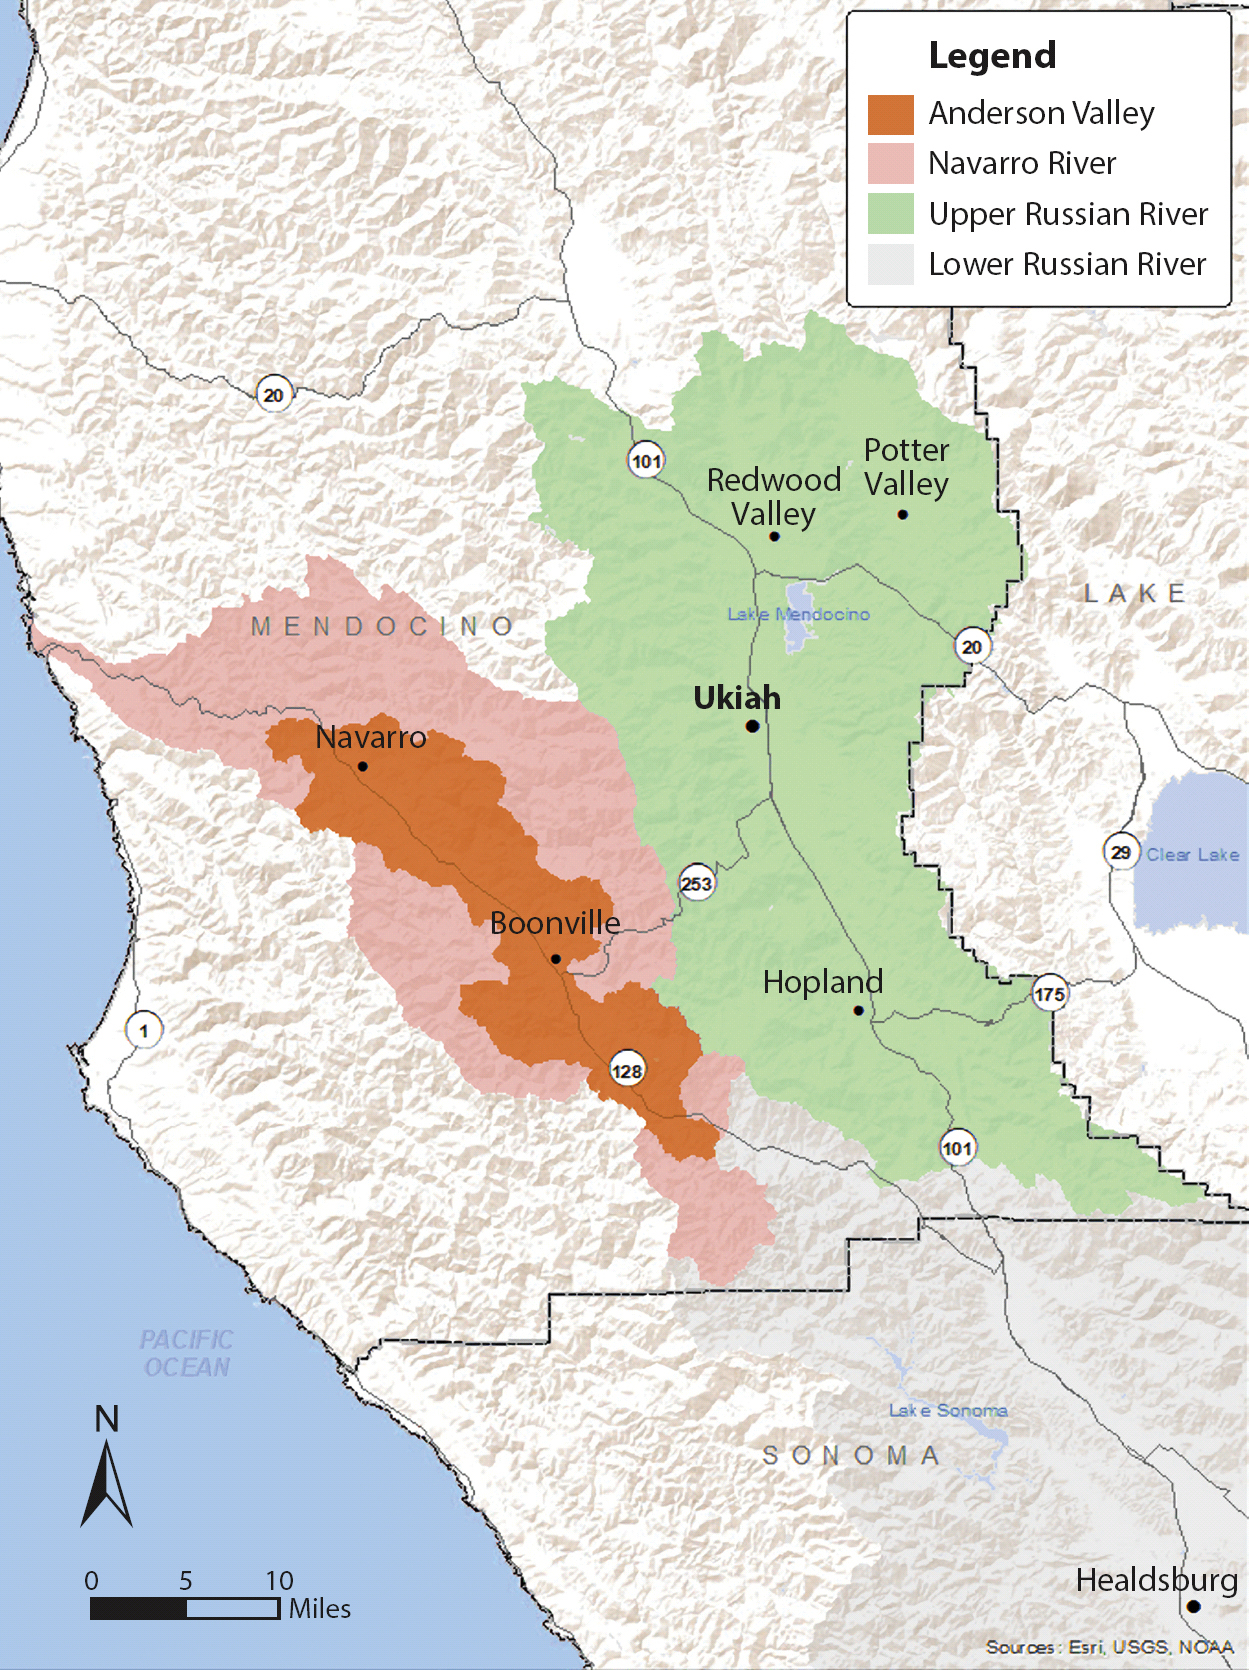
FIG. 1. Study location including the upper portion of the Russian River watershed and the Anderson Valley portion of the Navarro River watershed.
Our second objective was to assess needs and opportunities for innovations, including grower motivations, in irrigation technology, practices and water sources. Findings from this research have already improved agricultural water demand knowledge and facilitated feasible and sustainable agricultural water use in the study area (see sidebar, next page). This on-the-ground and with-the-users approach to water use accounting and the application of the results for solutions to meeting multiple water demands provides a useful model for relieving competition for water use in other watersheds.
Site description
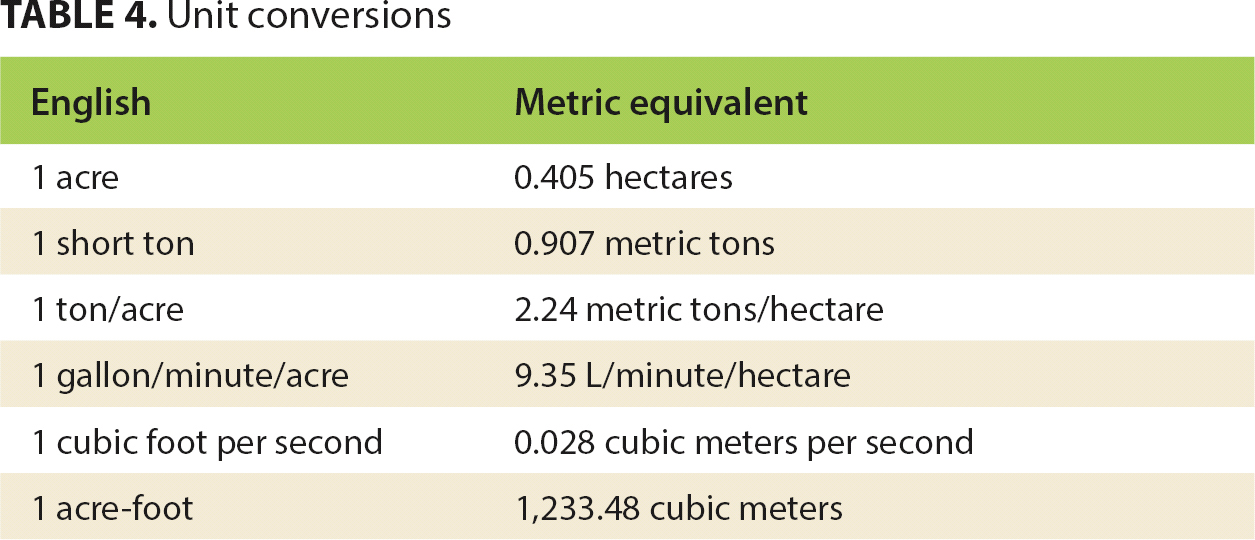
The Navarro River, flowing east to west, is the largest coastal watershed in Mendocino County, covering approximately 315 square miles. The portion of the Russian River within Mendocino County is approximately 362 square miles and flows north to south. The Navarro is a natural river with no dams or other obstructions on its mainstem, whereas the Russian River is regulated by the Coyote Valley Dam, which creates a maximum 110,000 acre-feet of storage in Lake Mendocino. Additionally, inter-basin transfers are made from the Eel River to the Russian River via the Potter Valley Project.
The climate of both watersheds is Mediterranean with most rainfall occurring in the winter months, followed by no rainfall from late May to late September. Because of the close proximity to the Pacific Ocean, there is a strong marine influence on the Navarro watershed, with fog occurring many late nights and mornings and cooling westerly winds during the day. This contrasts with the more inland position of the Russian River watershed in Mendocino County, which has relatively clearer skies and drier and warmer conditions. Rainfall in the Navarro River watershed averages 40.6 inches per year, whereas the city of Ukiah and the Russian River watershed average 36.6 inches per year (Bearden 1974). The Navarro is sparsely populated with approximately 3,200 people. The Russian River watershed in Mendocino County is also rural in comparison to other parts of California. However, Ukiah and other residential centers have a combined population of over 20,000 people. Both watersheds experience the economic activities of agriculture (vineyards, orchards, livestock, small-scale mixed horticultural enterprises and commercial softwood production), beverage production (wine and beer) and tourism.
Study design and methods
We completed this study in 2007 in the Russian River and in 2009 in the Navarro River watersheds, using the same study design and approach comprised of three elements for water use accounting.
-
We quantified the current acreage and crop designations using available agricultural statistics, aerial photograph interpretations and field visits to validate crop type and extent determinations. This included comparisons with past irrigated agriculture acreage and estimation of potential additional irrigated acreage; field evaluations were conducted of irrigation systems to quantify applied water for irrigation, heat protection, frost protection, and postharvest needs and irrigation distribution uniformity.
-
To estimate total annual agricultural water demand we summed the amounts of irrigation water, frost protection, heat protection, and postharvest volumes multiplied by the extent of existing and potential irrigated agriculture in the two watersheds. As part of this calculation, we compared the volume and timing of the total agricultural water demand to instream flow volumes. Instream flow volumes or daily discharge (cubic feet per second) were determined using stream flow measurements from U.S. Geological Survey (USGS) gauging stations.
-
To assess the needs and opportunities in water use innovations, we conducted grower surveys on existing irrigation system infrastructure and irrigation management decisions. A 25-question survey (available as supplemental information online) was administered to further inform water amounts used, water conserving irrigation system technologies adopted, and other background information needed to explore options and drivers to meet water demand and conservation goals.
Mendocino County winegrowers and advocates find solutions for agricultural water use while protecting endangered species
This study was undertaken with the aspiration that it could lead to solutions relieving potential pressure on stream flows from agricultural diversions, including the feasibility for small-scale private winter flow storage and opportunities for water reuse. Our study quantifies the amount of water used by agriculture relative to the total flow of water in both watersheds. We noted while water diversions are a small percentage of total flow, agriculture diverts water at a time when flow rates are low, and the need of water for fisheries is critical. In our recommendations, we discussed the concept of off-stream water storage when water flow was more plentiful. We also discussed that growers were comfortable with using recycled water as a substitute for direct diversions from the Russian River.
Spring of 2008 was one of the most challenging frost protection seasons in the upper Russian River watershed in over 30 years. Many growers required up to 20 nights of frost protection in their vineyards and orchards. A combination of limited water releases from Lake Mendocino due to a very dry winter, and large diversion demands for sprinkler frost protection from vineyards and orchards, greatly reduced flow in the main stem of the Russian River. In a normal rainfall year, instream flows during frost season range from 200 to 600 cubic feet per second (cfs) as recorded at the USGS water gauge in Hopland. In 2008, instream flows averaged 175 cfs. On April 20, 2008, a very cold advective freeze event occurred, creating an instantaneous drawdown of 83 cfs when nearly every agricultural water diverter turned on their frost protection systems. This drawdown resulted in a 2-inch drop in river stage and caused the stranding and mortality of hundreds to thousands of juvenile coho and steelhead trout, endangered and threatened species, which the National Marine Fisheries Service (NMFS) considered a “take” under the Endangered Species Act. As a result, in April 2009, NMFS requested that the California State Water Resources Control Board place a moratorium on the use of river water for frost protection. Honoring this request would have made it impossible in many years to grow wine grapes in the region, resulting in large employment and economic losses (estimated at up to $235 million).
In response, the Upper Russian River Stewardship Alliance was formed by the Mendocino County Farm Bureau, the Mendocino Wine Grape Commission, the Upper Russian River Flood Control District, the California Land Stewardship Institute, the Redwood Valley County Water District and local NRCS and UCCE offices to work with resource agencies and to find more reasonable approaches to solving the problem of river drawdown that could potentially strand young salmonid fish.
The group met regularly and developed The Upper Russian River Frost Protection Pumping Coordination Protocol. This coordinated effort improved frost forecasting precision by making more private weather stations available to frost forecasters. When frost events are likely to happen, growers call the Sonoma County Water Agency, controller of water releases from Lake Mendocino, so that river flows can be increased during frost events. Additionally, a new USGS water gauge was installed closer to Lake Mendocino to more accurately measure flow.
The California Land Stewardship Institute and the NRCS worked together to apply for $5.7 million in grants for water management infrastructure to prevent another fish stranding like that on April 20, 2008. The grant funds focused on creating off-stream ponds to store water to be used during frost events so that instantaneous drawdown would be reduced. Twenty ponds were built, with a combined water storage of 435 acre-feet. These ponds are filled with water under appropriated water rights (water stored from behind the Coyote Dam at Lake Mendocino). Growers have the capacity to pump as much as 145 cfs during a frost event from their ponds, replacing Russian River diversions that could imperil juvenile salmonids. After frost events, ponds are scheduled for recharge at more gradual rates to maintain adequate flows and water levels for fish.
To further improve the water supply situation, the city of Ukiah received $45 million in grants and low interest loans and is constructing a pressurized “Purple Pipe” system for agricultural and landscape water use. The Ukiah Municipal Wastewater Treatment Plant treats wastewater to California's Title 22 water reuse standards, with capacity to provide almost 4,000 acre-feet of water for use on farmland, parks, cemeteries and school grounds in Ukiah environs. Previously, this water was returned to the Russian River after treatment. This will reduce the demand for Russian River diversions, increase water security for the upper Russian River watershed, and reduce the costs associated with wastewater discharge management.
In Anderson Valley, The Nature Conservancy (TNC), who partially funded the Navarro River watershed portion of this study, very quickly teamed with the UCCE Mendocino County Office, as well as the Anderson Valley Winegrowers Association and the Mendocino County Resource Conservation District, to address some of the issues raised in our study.
The first major initiative was to install 16 new stream gauges in various smaller tributaries to augment the single USGS gauge near Philo, as the single gauge in the Navarro River watershed was inadequate for real-time irrigation management and better understanding impacts of dry season diversions on stream flows. The new gauges also help to inform conservation planning and identify areas that would benefit from additional water storage. Some of the gauges funded and installed by TNC are connected to cell phone interfaces so that a grower can accurately monitor the effects of diversions as they occur.
TNC is working with growers and the California State Water Resources Control Board to change their water rights to forbear summer diversions when flow rates in the watershed are very low and to allow for off-stream storage earlier in the year when flow rates are high, above critical levels for fish migration, spawning and juvenile survival. TNC also identified cost share funding for pond construction for water storage, working with the local USDA NRCS office and Mendocino County Resource Conservation District.
These examples of solving environmental problems proactively and locally through cooperative, thoughtful planning and execution resulted in much more positive outcomes and responded to real concerns for the impacts on people, their property and community in proposed regulations from agencies external to the region. Compiling and analyzing on-the-ground water use data, and applying that science through local associations and organizations, demonstrates how public and private partnerships can be successful for all concerned stakeholders.
Estimated irrigated agriculture extent
We mapped irrigated agricultural acreage in the Russian River watershed (fig. 1) using aerial photographs taken between August and September 2004 (AirPhoto USA). Late summer and early fall images provided a stark contrast between green irrigated crops and golden-yellow dry grasses. We visually assigned acreage into five crop designations: grapes, orchards, row crops, pasture and unknown. We estimated potentially irrigable lands based upon slope and landscape position to evaluate potential future water demand. Crop acreage classifications were validated through systematic field visits.
We obtained agricultural acreage statistics for the Navarro River watershed from Mendocino County Department of Agriculture Annual Crop Reports (Linegar 2008), the California Department of Water Resources (CDWR 1964, 1979, 1989) and the California Department of Food and Agriculture (CDFA 1968, 1976, 2006, 2009). Additionally, we mapped irrigated agriculture spatial extent in a geographic information system (GIS) using U.S. Department of Agriculture (USDA) National Agriculture Imagery Program (NAIP) photographs (NAIP 2009). Data were summarized to provide a picture of historical and current irrigated agriculture extent in the study area. While the Navarro River extends beyond the study area, our analysis was constrained to portions of the Navarro River watershed with active agricultural operations, namely Anderson Valley (fig. 1).
We estimated future irrigated agriculture in the Russian River watershed by visually determining potentially irrigable lands not currently in production based upon the slope and landscape position. In the Anderson Valley, we used aerial imagery from the 2009 USDA NAIP aerial mapping program to develop a land cover classification for the Anderson Valley watershed. Sample points from forest and non-forest land cover types were identified in the 2009 aerial images and used to inform an image classification procedure. Maximum Likelihood Classification (Nagi 2011) was used to generate the land cover classes with a 10-m pixel resolution.
National elevation data at 10-m resolution was used to derive topographic slope for the Anderson Valley. The National Elevation Dataset provides uniform topographic data across the United States and allows for explicit consideration of topography in geographic analysis and modeling (State Water Commission and USGS 2017). Slope classes of < 10% and < 20% were created to discriminate vineyard potential under different slope thresholds. In general, steeper slopes are more difficult and costly to farm. Vineyard land cover identified during air photo mapping was used to extract existing vineyard land cover from the model.
The Squawrock-Witherall soil complex, interspersed with Hopland and Yorkville soil series and known to be high in magnesium (Rittiman and Thorson 1993), was excluded from our final analysis due to its known impacts on vineyard performance including potassium deficiencies, potential toxicity from nickel, poor surface stability and high erosion potential. While there are some vineyards planted on these soils, low yields, soil instability when saturated, and high erosion make them difficult to manage. Generally, these sites are not recommended for agricultural enterprises.
Irrigation system evaluation
Our evaluation of existing irrigation systems and measurements of applied water volumes included field measurements and calculation of water used for irrigation, including distribution uniformity, frost protection, heat protection and postharvest applications.
Irrigation use and distribution uniformity
We conducted field evaluation and existing irrigation systems measurements on a subset of vineyards, apple and pear orchards, and irrigated pastures to understand irrigation use and system distribution uniformity (consistency in applied water volume and rate throughout an orchard or vineyard). Methods used to conduct these evaluations are described in Prichard et al. (2007), Schwankl (2007) and Schwankl and Smith (2004). Evaluations included field measurement of water application rates and irrigation system distribution uniformity on 33 vineyard blocks, seven orchard blocks and one irrigated pasture in the Russian River watershed, and 26 vineyard blocks and three orchard blocks in Anderson Valley.
Additionally, we conducted interviews with cooperating growers to document irrigation season duration and irrigation frequency. Measured application rate and grower interview information were combined to estimate total irrigation use. Reference evapotranspiration (ETo; reference rate at which water evaporates from the soil and transpires) data were obtained for 2007 from California Irrigation Management Information System (CIMIS) stations #106 Sanel Valley in Hopland, F90 4933-23 on the Light Ranch in Redwood Valley, and the U.S. Army Corps of Engineers Coyote Dam station in the Ukiah Valley. Anderson Valley values for ETo were obtained for the 2009 season from an AdCon (AdCon Telemetry, Austria) weather station at Roederer Estate in Philo. Russian River soils information and data were derived from the Mendocino County Soil Survey (Howard and Bowman 1991). Available water holding capacity data for dominant soil types within irrigated agricultural lands in Anderson Valley were obtained from Rittiman and Thorson (1993).
Grapevine water use and crop coefficient (Kc) are linear functions of shaded area beneath the canopy (Williams and Ayers 2005). To calculate specific crop coefficients for this study, we measured percent canopy area covering the vineyard floor. In the Russian River study area, site-specific crop coefficients were calculated in 19 wine grape blocks. Shaded area beneath the canopy at midday was assessed using photographs, digitizing dark and light areas beneath and between vine rows, and measuring actual shaded area (Prichard et al. 2007). In the Anderson Valley, we used the Paso Panel technique (Battany 2012) to directly measure canopy shaded area on representative sites and trellis designs. Field data were used to calculate grapevine crop coefficients according to methods outlined by Battany (2012). We took vine canopy field measurements at Roederer Estate Vineyards in Philo between 1200 and 1300 hours (solar noon) on September 28 and October 2, 2012. Vine canopies were healthy, green and fully expanded. A total of four sites planted to pinot noir and chardonnay were selected based on trellis type, vine vigor and row orientation; we recorded 40 observations from each site. Crop coefficients were calculated using the algorithm provided by Battany (2012). These values were used to produce an average Kc.
Frost protection calculations
Grower interviews, relevant production manuals (Snyder 2007), project team experience and study area knowledge were used to generate total frost protection water use estimates. The dominant frost protection method is overhead sprinkler water application, which maintains the plant material surface temperature above freezing. In general, frost protection is used on vineyards and orchards located below 700 feet elevation because radiant frost typically occurs below this elevation in the study area. Heavier cold air settles in lower parts of the landscape, which poses crop damage risk (when green tissue is present) under normal radiant frost conditions. The elevation break for frost damage in Redwood and Potter valleys is higher than in the Ukiah Valley, as the valley floors are 770 feet and 950 feet, respectively. It is important to note that infrequent advective frost events impact the entire study area regardless of elevation.
Frost protection application rate was assumed to be 50 gallons per minute per acre (gal/min/ac) for grapes, or 0.1 inches of water per hour. In orchards, one acre-inch is applied for each frost protection event (Elkins et al. 2006). If systems are not routinely maintained and repaired, these values can be as low as 35 to 40 gal/min/ac. Additional assumptions for frost protection duration (hours/frequency) and acreage for each sub-basin were made based upon grower interviews.
Heat protection calculations
Total water use for heat protection calculations relied on grower confirmation of heat protection methods, relevant production manuals, project team experience and study area knowledge. In general, the same sprinkler system used for frost protection in grapes is used for heat protection. Accordingly, we assumed the heat protection application rate was 50 gal/min/ac, keeping in mind variability can exist due to system maintenance and effectiveness. Not all farms have these systems or access to sufficient water for heat protection. Additional assumptions for duration (hours/frequency) and acreage in which heat protection were made also based upon cooperating grower responses.
Postharvest application
Total water use calculations for postharvest application in wine grapes relied on grower response data, project team experience and study area knowledge. In general, the same irrigation system used for frost and heat protection in grapes is used for postharvest irrigation. Accordingly, we assumed postharvest application rate was 50 gal/min/ac, keeping in mind variability can exist. Postharvest irrigation is used to germinate cover crop seed banks and enhance carbohydrate storage. The latter objective is most applicable for white varieties where growers strive for yields of 5 to 6 tons per acre. Postharvest application decisions also depend on water availability. Additional postharvest application assumptions for duration (hours/frequency) and acreage relied on grower responses.
In pear orchards, postharvest irrigation occurs in August and September while trees are actively growing. For this reason, postharvest irrigation was included in pear irrigation use calculations.
Total agricultural water demand
We calculated total agricultural water demand by summing water used for irrigation, frost protection, heat protection and postharvest application; volumes were informed by agricultural practice differences and access to water. Total (per acre) water use (and its ranges) were multiplied by both existing (mapped) and potential (modeled) irrigated agriculture to calculate total agricultural water demand. Total demand, including timing and volume, was then compared to annual stream discharge data. Data from the following USGS stream gauging stations were compiled and analyzed for the Russian River watershed: Russian River near Ukiah, station #11461000; east fork of Russian River near Ukiah, station #11462000; and Russian River near Hopland, station #11462500. Stream discharge measurements from USGS stream gauging station #11468000 near Navarro, Mendocino County, were compiled and analyzed for the Navarro River watershed.
Grower surveys
We administered surveys to wine grape and fruit tree growers in both watersheds through two focus groups; the surveys were designed to understand water use patterns and document water resource use and irrigation management practices. The 25 questions in the survey were developed to gather information on growers’ water resource management history, including frost and heat protection, irrigation system technology change, conservation program participation, and opinions on alternative water sources. All focus group participants and survey respondents (a total of 15 Russian River and 14 Anderson Valley grape, pear and apple growers) completed appropriate human subjects releases required by the Office of Research Institutional Review Board Administration for the University of California, Davis.
Transitions in irrigated acreage
Based upon our team's land use mapping and modeling, irrigated agriculture in the Mendocino County portion of the Russian River watershed consists of 75% wine grapes, 15% irrigated pasture, 9% pears and less than 1% in other vegetable and unconfirmed crops (table 1). CDFA crop acreage statistics identified 14,212 acres in wine grape vineyards and 1,867 acres in pear orchards within the study area (Bengston 2008). These values are 9% less for grapes and 1% more for pear orchards compared with our values.

TABLE 1. Acreage of irrigated agriculture in the Mendocino County portion of the Russian River watershed by crop in 2007 and in 2009 in the Anderson Valley portion of the Navarro River watershed, Mendocino County
Irrigated agriculture acreage has increased in the Russian River area in the past 50 years. This resulted from conversion of dryland-farmed acreage to irrigated agriculture and the expansion of irrigated agriculture overall (fig. 2). Our 2007 estimate of irrigated acreage for Hopland and the Ukiah Valley area is 12,502 acres, roughly the same as the total agricultural acreage in 1957 (Carpenter 1958), but a 125% increase over 1957 irrigated acreage. Similarly, we estimated 16,661 acres of irrigated agriculture in the entire study area minus Potter Valley for 2007, or a 31% increase over the 1985 estimate (Sommarstrom 1986). And as of 2007, well over 95% of grape acreage was irrigated.
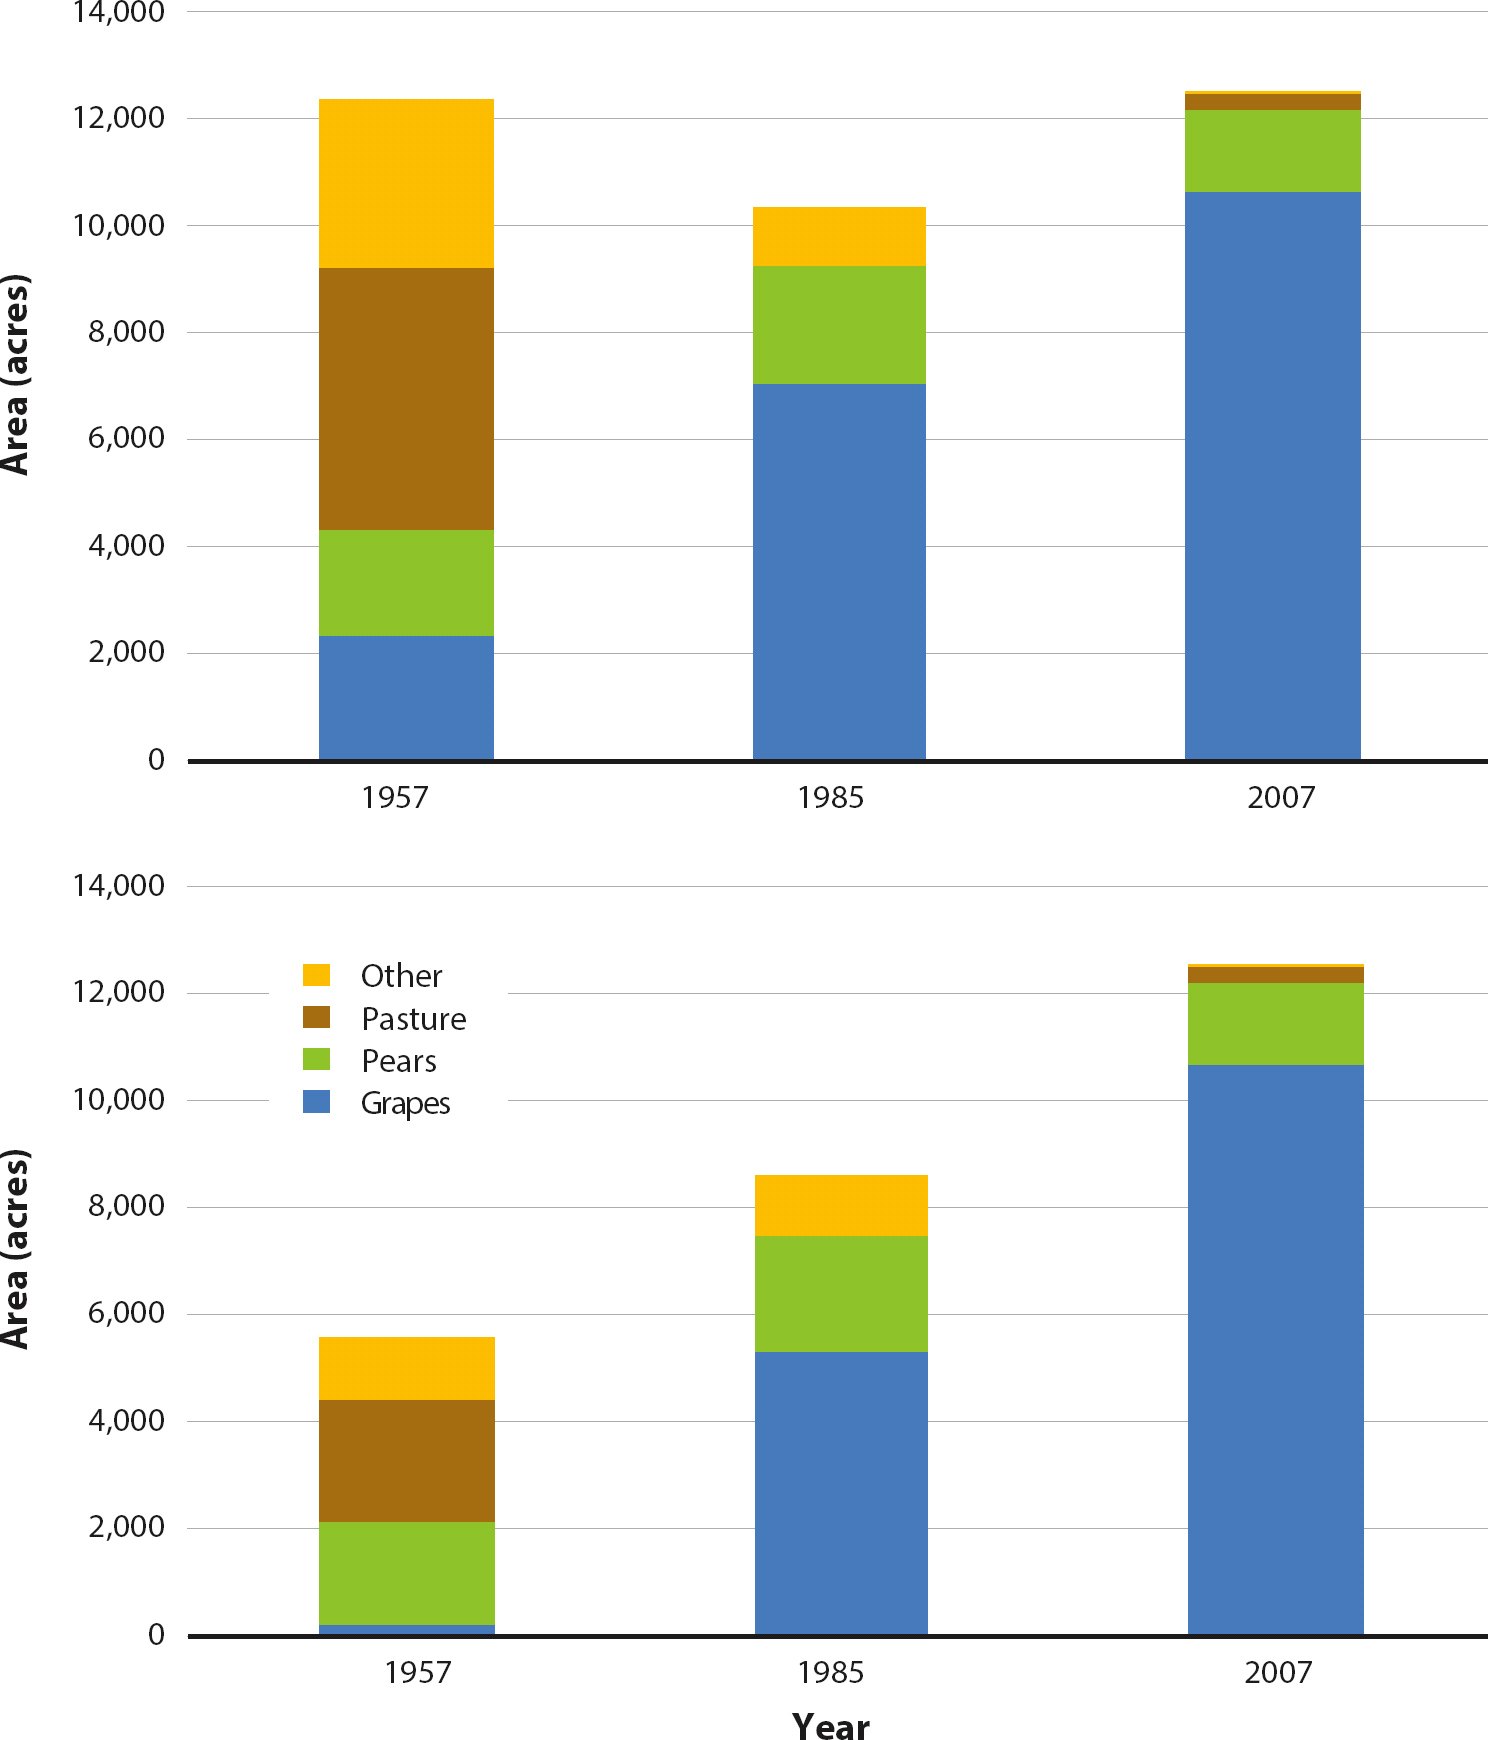
FIG. 2. Comparison of total (top) and irrigated (bottom) crop acreage in the Hopland and Ukiah valleys from 1957 (Carpenter 1958) to 1985 (Sommarstrom 1986), to 2007. “Other” in 1957 includes truck farms, prunes and small grains, and in 1985 combines pasture with crops other than apples, pears and grapes.
This increase in irrigated agricultural acreage corresponds with a shift in the crops being grown (fig. 2). Most prominent is a conversion of pasture, including alfalfa, and pear orchards to wine grape vineyards. Between 1957 and 2007 there was a 4.5-fold increase in grape acreage and an almost 19-fold decrease in pasture acreage for the Hopland and Ukiah valleys alone. When compared with our estimates, Sommarstrom's determinations for the entire study area, excluding Potter Valley, confirm a transition to grape production with a corresponding decrease in pear acreage over the same time period. Countywide, there has been a 35% decrease in pear acreage from a peak of 4,085 acres in 1974 (Elkins et al. 2007). Each sub-watershed has experienced slightly varying paths of crop conversion; for example, large acreage in irrigated pasture still exists in Potter Valley.
Irrigated agriculture acreage in Anderson Valley is 90% wine grape vineyards, followed by 7% orchards, 2% pastures and 1% other irrigated crops (table 1). There have been multiple transitions in agricultural production in the Anderson Valley, beginning with subsistence farms in the 1850s, followed by diversified production of agricultural and food products for logging camps, which remained active through the second half of the 19th century. Dried fruit production, principally apples, was next, until the market turned to fresh fruit for juice and canning in the 1950s. From that time on, there has been a major transformation and increase of crop types from orchards to vineyards (fig. 3). Wine grape acreage in 2009 totaled 2,790 acres, a 13-fold increase over the amount in 1966. For orchards, there were nearly 900 acres in production in 1966, and by 2009 there were only 218 acres remaining.
There are approximately 517 acres in the Russian River with the potential to be put into irrigated agricultural production, a potential increase of 2.6% within the study area (table 1). In Anderson Valley, there are 4,649 acres for potential irrigated agriculture expanse, a 148% increase in the study area. Of these, 1,997 acres are on slopes above 10%; such slopes are under stricter regulations to safeguard against erosion, which may deter growers from planting wine grapes or other crops.
Water used to meet crop needs
Calculated values for all water applied differed by crop in both the Russian River and Anderson Valley (table 2; values are derived from the field measurements of applied water, informed by the grower surveys, and then multiplied by the mapped and modeled irrigated agricultural extent). In general, grapes received less than 1 acre-foot per acre (afa) (fig. 4), while apples and pears received more than 2 afa (not shown). These values are lower than published agency amounts (CDWR 2010) of 0.79 afa for wine grapes and 2.39 afa for apples and pears for annual water use in Mendocino County. All water applied for wine grapes and orchards in the Anderson Valley was 33% and 95% of the amount applied, respectively, in the Russian River watershed. This difference may be attributed to lower evapotranspiration rates and smaller canopy sizes in Anderson Valley compared to the Russian River Valley.
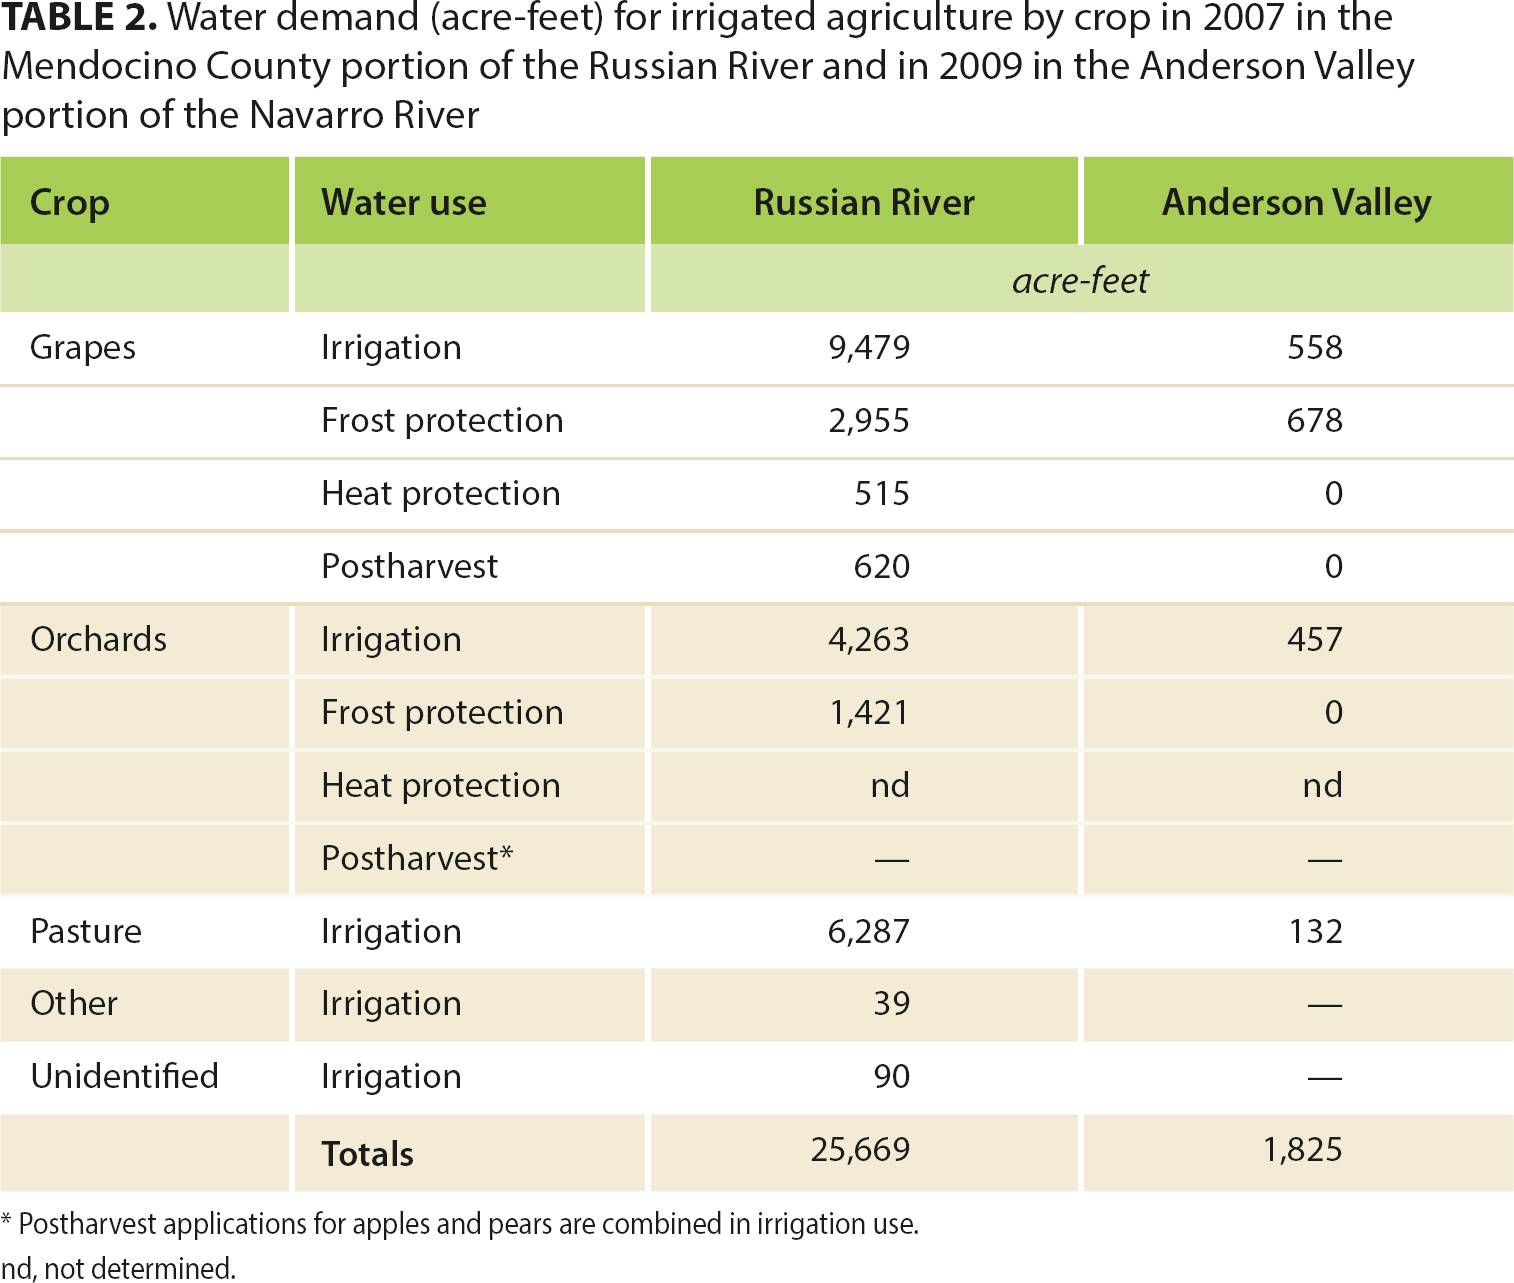
TABLE 2. Water demand (acre-feet) for irrigated agriculture by crop in 2007 in the Mendocino County portion of the Russian River and in 2009 in the Anderson Valley portion of the Navarro River
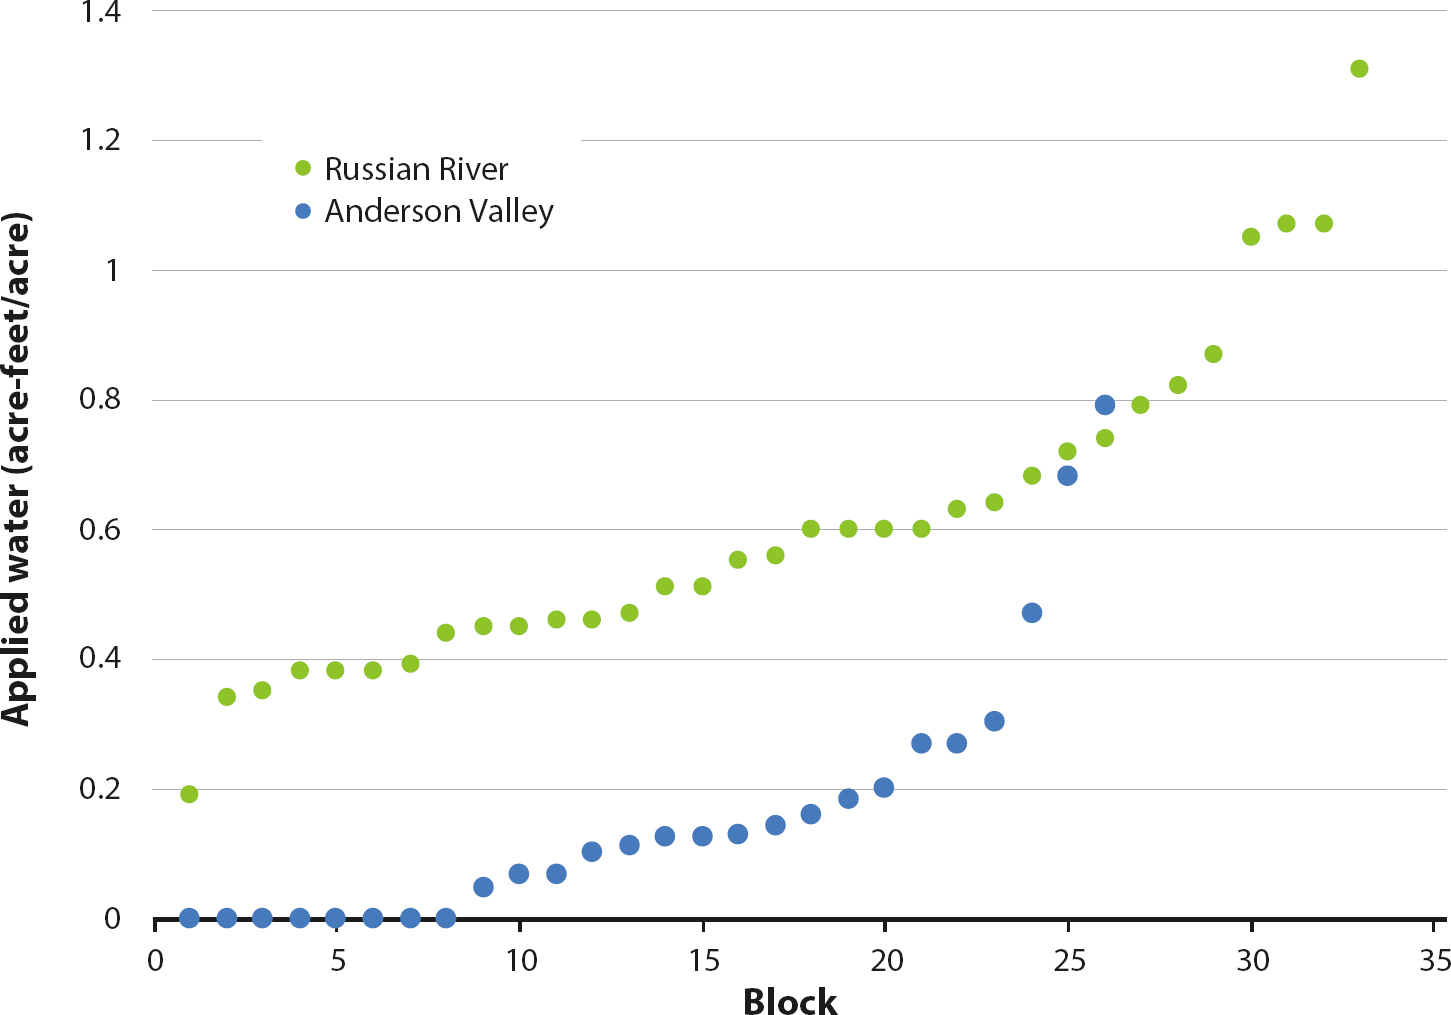
FIG. 4. Calculated water (acre-feet per acre) applied to meet irrigation use for Russian River and Anderson Valley vineyard blocks.
Applied irrigation water for irrigated pasture was 3.31 afa in the Russian River compared with 2 afa for the Anderson Valley pasture (not shown). This is consistent with estimated amounts needed for pasture irrigation in the Central Valley of California (Fulton et al. 2007) and less than the average use of 4.13 afa documented by the Potter Valley Irrigation District (PVID 2008).
Frost protection
Russian River growers said that frost protection was needed more in the 1970s and 1980s than during the last decade (n = 15). However, the threat still persists, with growers referencing 2001 as a dry, cold winter that required frost protection. The total number of frost days in a year and early bud break were identified as drivers that raise the risk of frost damage. This was demonstrated by the extreme conditions in March and April 2008, with over 20 frost days, which required growers to take corrective action.
The majority of focus group participants and survey respondents have transitioned from fans and smudge pots to sprinklers for frost protection. Dependability and effectiveness of sprinkler systems relative to these other methods is generally what motivated this transition. Growers are also using improved methods for frost protection, including late pruning to delay bud break, trellis and row design to influence temperature and dew point, and use of on-farm temperature monitoring and alarm systems and fruit frost forecasts to aid decisions about when to apply frost protection.
In the Russian River watershed, wine grape growers achieved frost protection though sprinkler irrigation on 5,263 acres, representing 36% of the total acreage in wine grapes and resulting in 2,955 acre-feet of calculated water use (table 2). Orchard acreage, in comparison, was 100% under frost protection with a combined use of 1,421 acre-feet of water.
Most (81%) of the Anderson Valley vineyards had an active frost protection system in place due to the high risk of frost in the Navarro River watershed. In contrast, only 42% of orchards had active frost protection. Most vineyards without frost protection are in higher elevation sites above settled cold air during the typical spring inversion and radiant freezes. Fans and microsprinklers are used in sites where there is limited water availability for site protection from freezing. Based on our survey results, 91% of frost-protected vineyard acreage in Anderson Valley is covered by water from off-stream storage. The remaining 9% of acreage is frost protected from direct diversion sources. In 2009, growers averaged about 40 hours of frost protection during five events, combining for an estimated total water used for frost protection of 678 acre-feet.
Heat protection
In general, heat protection is done where there is a sprinkler irrigation system and where the grower has access and rights to sufficient water. Russian River survey respondents consistently offered 2000 and 2007 as examples of years in which heat protection was needed. Interestingly, however, the number of “hot days” per year has decreased over the last five decades (Robinson 2007). The five grower respondents that conduct overhead sprinkler heat suppression explained that they have transitioned to pulsing to protect crops. In this approach, the irrigation system turns on for an hour and off for two hours, repeating this cycle two to three times during the span of the day when air temperatures are at or above 100°F. This method was accounted for in the estimates of water use for heat protection.
Additional comments shared by participants and respondents included energy costs as a disincentive to operate their irrigation systems for heat protection. Estimates of the water needed to provide for maximum heat protection in the Russian River watershed totaled 515 acre-feet. Only three Anderson Valley growers indicated that they provided heat protection with sprinklers. Since Anderson Valley is cooler due to its proximity to the Pacific Ocean, high temperature events are less common compared to the Russian River Valley area of interior Mendocino County. Also, growers often have limited water supplies, so they save available water for irrigation use.
Postharvest application
In general, postharvest application is done in vineyards with white fruit that has overhead sprinklers and that are cropped at 5 to 6 tons per acre, double the cropping level of red varieties. We estimate that 620 acre-feet of water is needed in the Russian River watershed to provide for postharvest applications in wine grapes. Postharvest application for pears is included in irrigation use because of the stage of growth the crop is at when these applications are made in August and September. Anderson Valley growers do not typically make postharvest irrigations to their vineyards in the fall because water availability is limited.
System distribution uniformity
System distribution uniformity field measurements in Russian River grape vineyards and pear orchards consistently averaged above 85% (table 3). In Anderson Valley the difference between the two crops was 18%, while in the Russian River it was less than 0.5%. These relatively high uniformity values indicate that growers are maintaining their irrigation systems. When coupled with grower survey results documenting vineyard and orchard transition to improved irrigation systems, the implication is that meeting agricultural water demand and minimizing instream flow impacts through irrigation systems innovations and management are already being realized. The mean crop coefficient for the wine grapes was 0.69 (SD = 0.16) in the Russian River watershed and 0.59 (SD = 0.07) for Anderson Valley. We did not measure system uniformity for pastures in either watershed.

TABLE 3. Distribution uniformity in vineyard and orchard blocks in the Russian River watershed and in the Anderson Valley portion of the Navarro River
Total water demand for agriculture
For the Russian River, the estimate of 25,669 acre-feet (table 2) represents a scenario that includes frost and heat protection for all crops and postharvest applications in grape vineyards. A year in which these protections and applications are not needed or made will experience a reduction in the use of water by irrigated agriculture to approximately 20,778 acre-feet. These amounts for total and irrigation use water demand were 11% and 9% of the 2007 total annual discharge in the Russian River near Hopland, and 5% and 4% of the total annual precipitation (UFD 2008). In high flow and wetter water years these percentages will be lower, and in low flow and drier water years they will be greater.
Calculated values for water applied to meet annual water demand in Anderson Valley differed by crop type (table 2). The total water used in Anderson Valley during 2009 (considered a low river flow year) for all irrigated agriculture was estimated to be 1,825 acre-feet. In the same year, total annual discharge measured on the Navarro River near Navarro was 107,000 acre-feet. Agricultural water use in the Navarro River watershed equaled 1.4% of this amount. In years such as 2006, when total flow at the same gauging station reached approximately 760,000 acre-feet, agricultural water use of 1,825 acre-feet would represent only 0.2% of river flow.
Growers’ practices
Growers’ individual experience in irrigated agriculture ranged from 10 to 70 years. Russian River respondents farmed a combined acreage of 6,415 acres, including 3,875 acres of grapes, 420 acres of pears, 128 acres of irrigated pasture, and 33 acres in other crops for a total of 4,456 acres of irrigated lands, or 22% of the irrigated agriculture acreage identified in the Russian River study area. Anderson Valley participants farmed 1,576 acres, approximately 50% of the irrigated agriculture acreage identified in the study area, including 1,333 acres of grapes, 218 acres of apple orchards, 3 acres of irrigated pasture and 22 acres in other crops. Survey respondents used the farming practices (such as drip and under canopy irrigation systems) currently employed by growers within the two watersheds, thereby representing the current state of operation for irrigated agriculture in Mendocino County at the time of the study.
Russian River growers consistently identified 1977, 2002 and 2007 as years in which meeting crop irrigation needs was difficult. Comparatively, Anderson Valley growers cited 1976, 1977, 2000, 2008 and 2009 as challenging years. Low rainfall years, low stream flow, and low pond levels were the most frequently identified conditions that contributed to this problem among both groups. Paralleling this historical variability in water availability is documentation that growers converted from impact sprinklers or other systems to drip irrigation for grapes and below canopy sprinklers for apples and pears beginning in the 1970s, with near full conversion obtained by the 1990s. Thirteen of the 15 Russian River respondents cited multiple reasons for changing their irrigation systems, such as water costs, replanting crops, and improving crop quality (fig. 5). Of the Anderson Valley growers, eight of the 14 respondents had changed their irrigation systems, also citing multiple reasons for making these changes. The remaining six Anderson Valley growers said they did not change their irrigation systems, as they had originally installed them as high efficiency drip systems when their vineyards were planted. In both watersheds, the most commonly cited reason for system conversion was water conservation and the least identified reason was to increase stream yield.
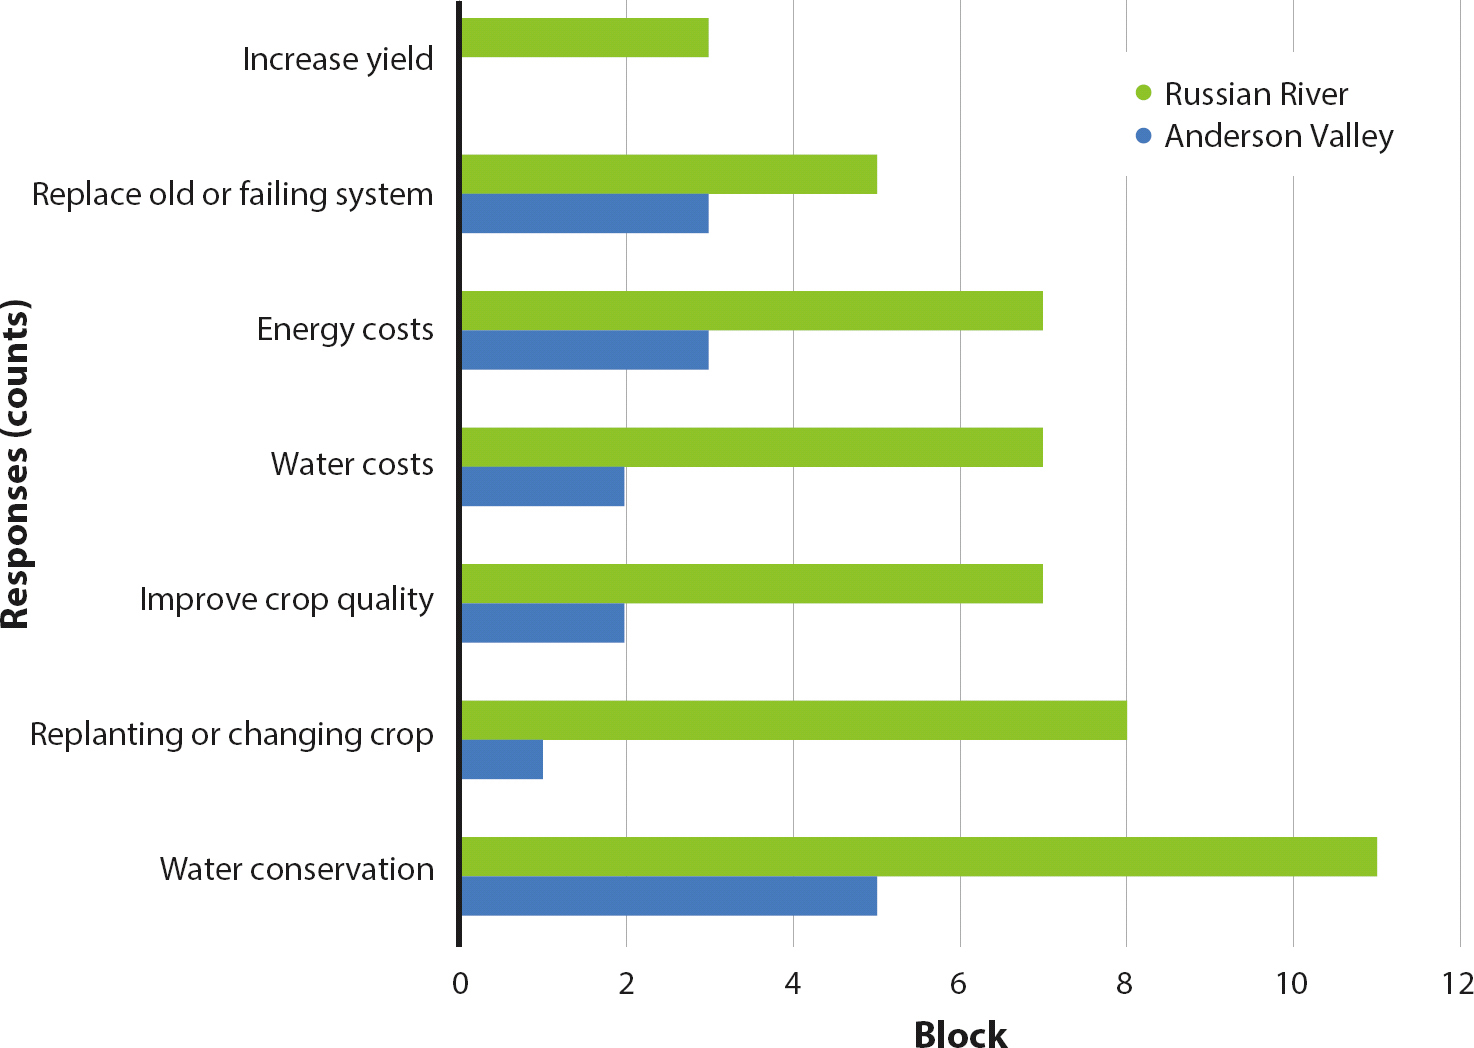
FIG. 5. Reasons identified by growers for conversion of irrigation systems to different technology. Growers could select any reason that applied to their respective decision.
Responses to our survey indicate that growers use a variety of information sources to make irrigation and water resource management decisions. Participation in one or more conservation programs was high for both groups, including the Natural Resources Conservation Service (NRCS) Environmental Quality Incentives Program (EQIP), UC Cooperative Extension (UCCE) Water Quality Planning, and California Land Stewardship Institute's Fish Friendly Farming program. Natural resource stewardship was the most frequently cited reason for participating in these programs (fig. 6). Other reasons growers in both watersheds shared for motivations to participate in conservation included personal values and beliefs (among the top three) and providing water for urban growth and development (in the bottom two).
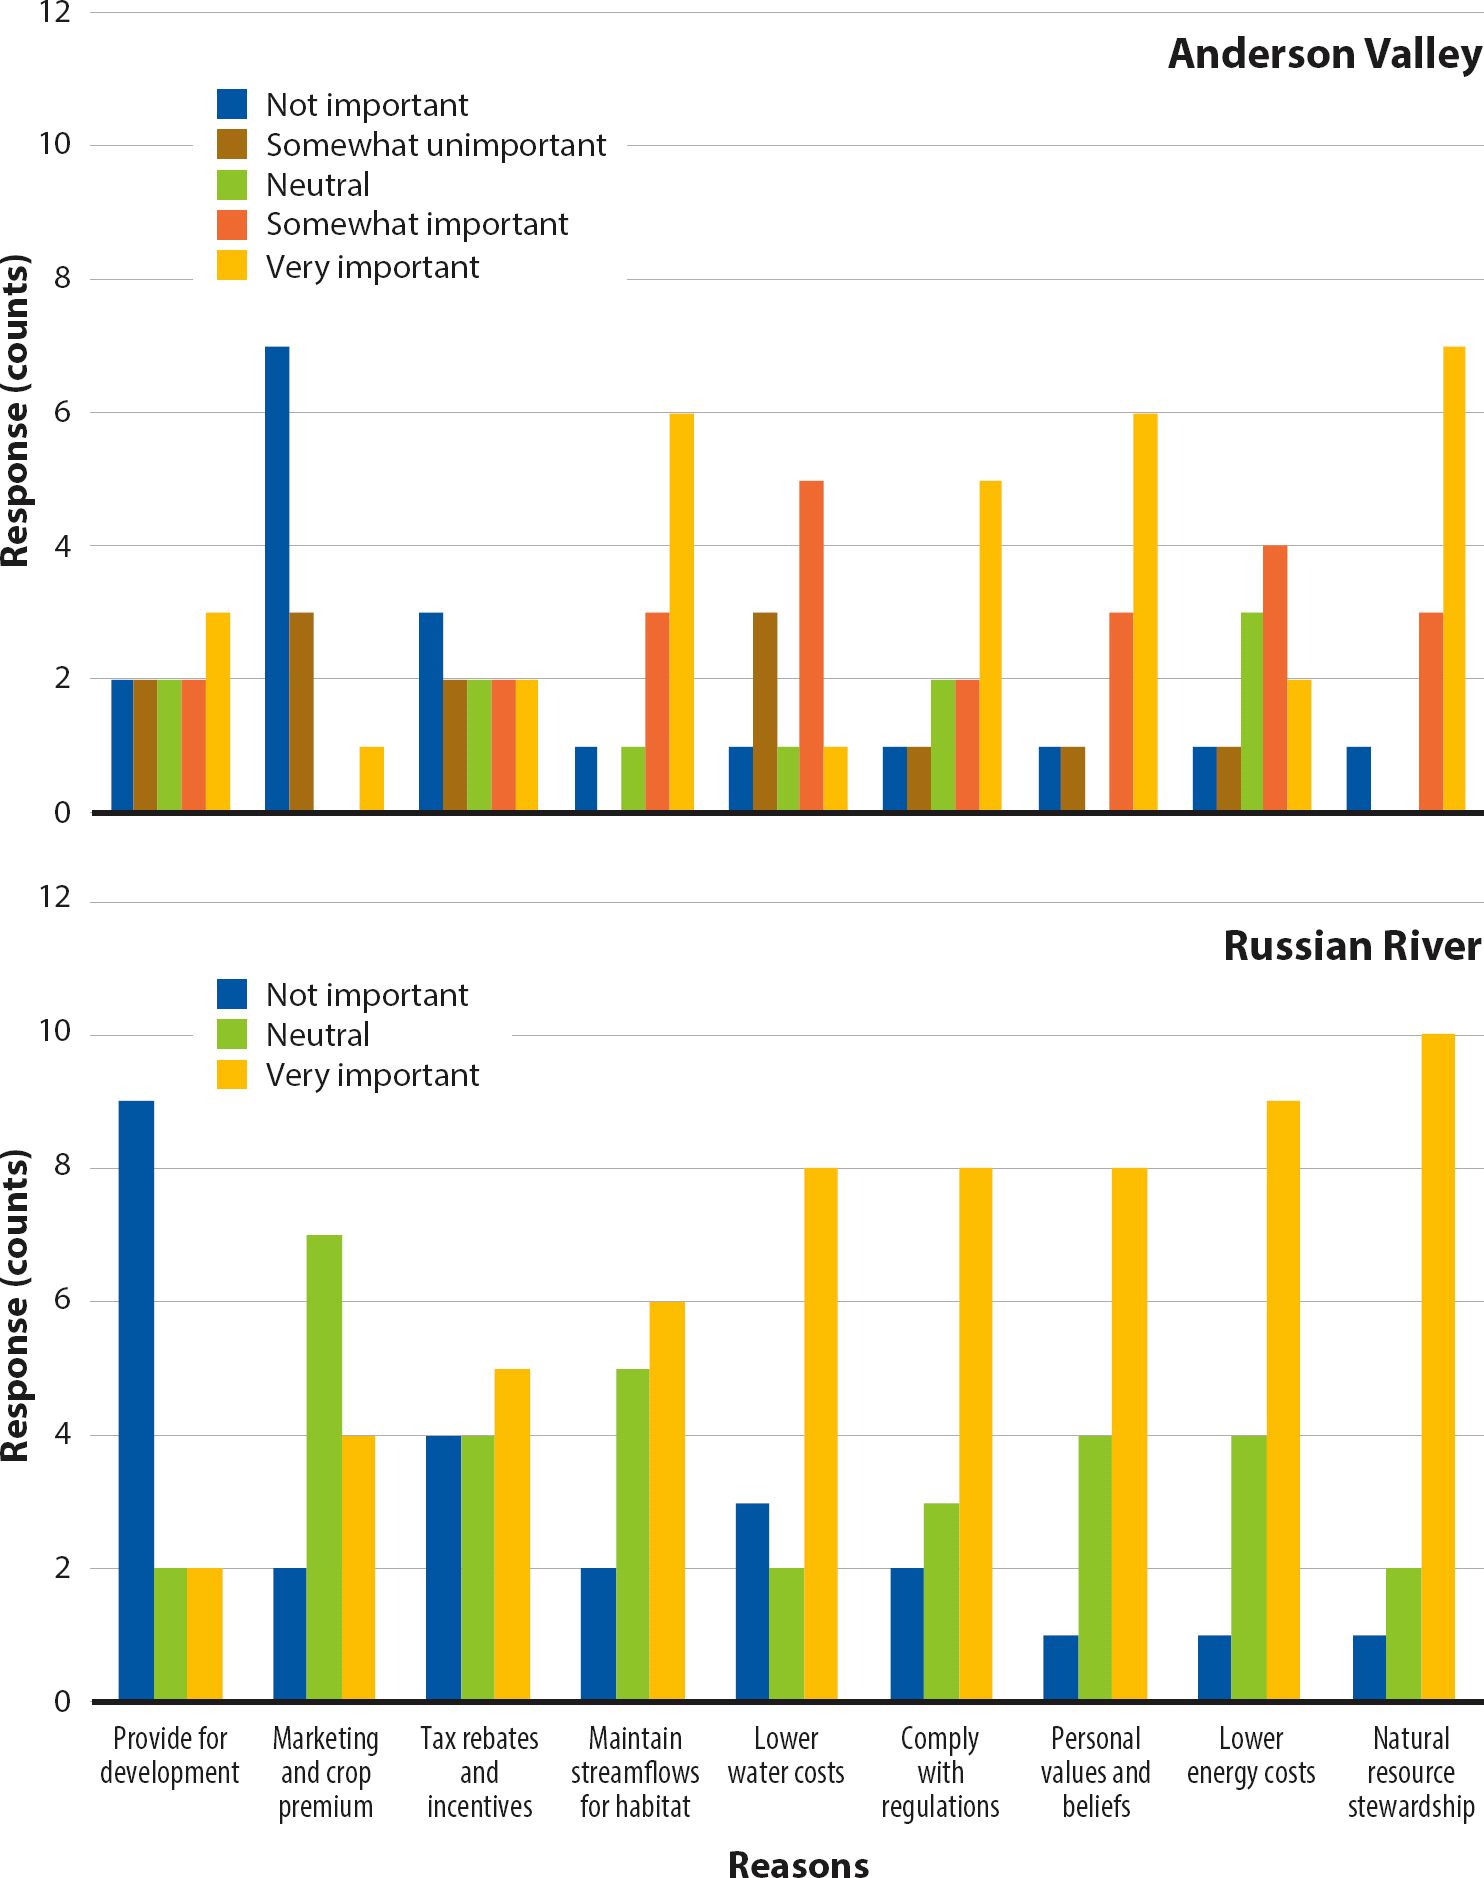
FIG. 6. Indication of importance of reasons growers would participate in on-farm water conservation in the Anderson Valley (top) and Russian River (bottom) watersheds.
Considerations for meeting water demands
The transition in both watersheds from dry farmed crops to irrigated agriculture took place prior to the 1980s, with the implication that the maximum water demand for agricultural use was largely established by then with few increases since.
On an annual basis, the amount of water used for crop production in both watersheds is small relative to total annual discharge. The calculation of annual agricultural water demand compared to total annual discharge is a starting point for resolving water use conflicts, as it provides stakeholders with the scale of the problem and therein the scale of the solution needed. The fact that growers, the agricultural water users, participated in the generation of these calculations, facilitates their support of the accuracy of the results and the use of the findings in plans and actions to resolve competition between uses.
The four primary water needs for irrigated agriculture generally occur at times when mean daily discharge is lowest (fig. 7). In drier water years, like 2007, the rates of daily use for irrigated agriculture can approach, equal, or potentially be greater than mean daily discharge rates. These findings suggest that irrigated agriculture requires additional assistance to reduce potential impacts to instream flows that result from water demand during the dry season.
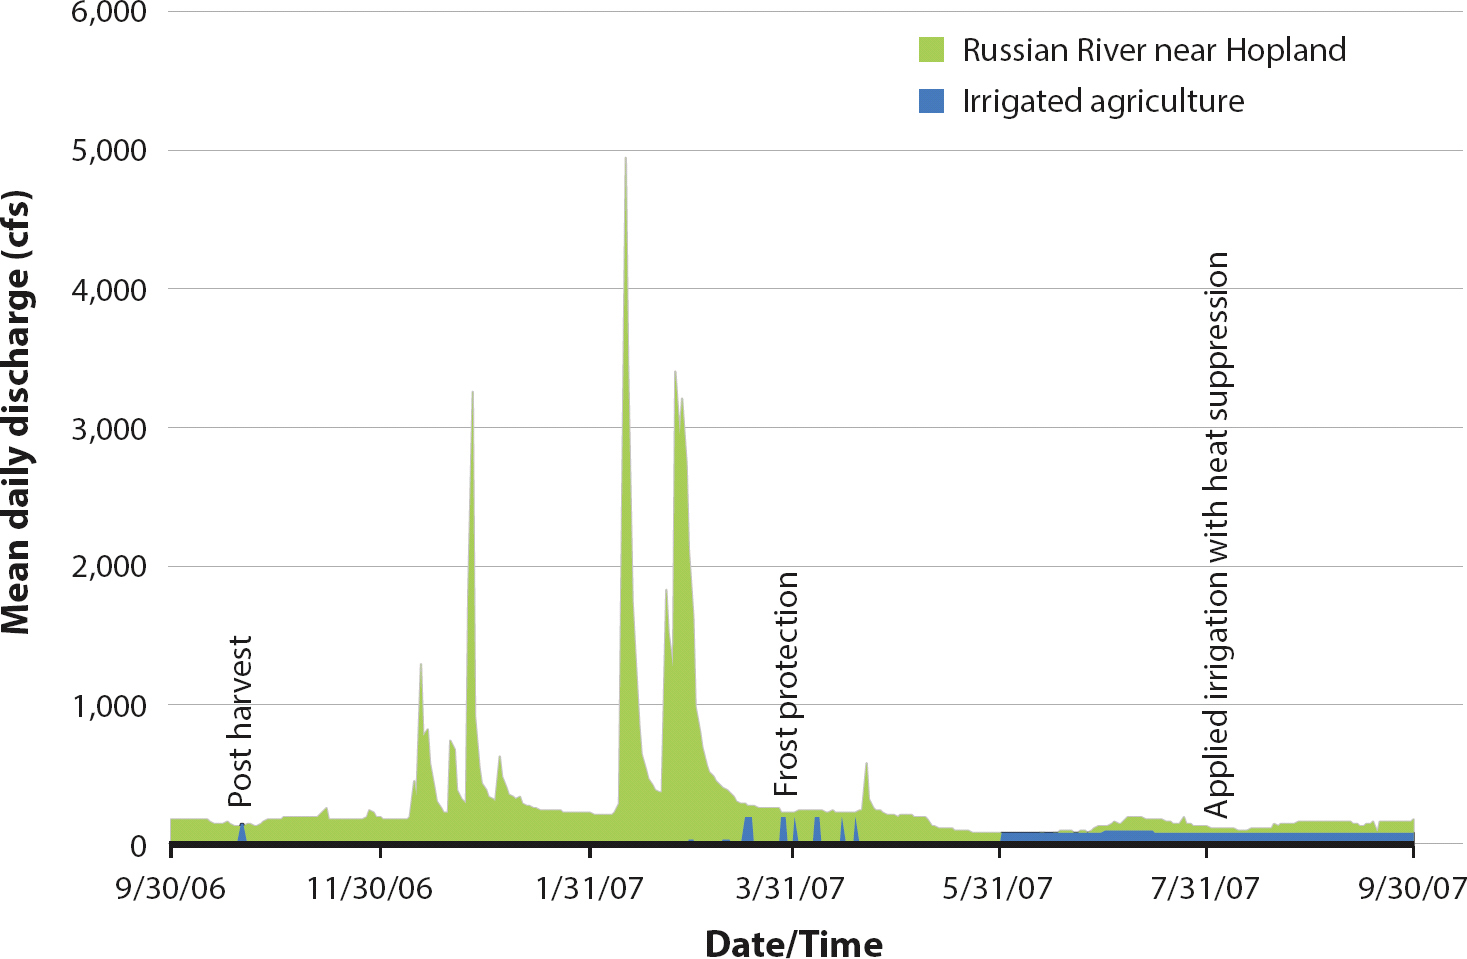
FIG. 7. Mean daily discharge (green) from Oct. 1, 2006, to Sept. 30, 2007, at USGS stream gauging station #11462500 near Hopland, California, and estimated daily rates of water applied (blue) to meet irrigated agriculture's water demand in the Mendocino County portion of the Russian River watershed.
Our results demonstrate that growers’ water use decisions for irrigated agriculture are based upon a number of issues and factors. These include the cultural objectives for specific crops, soil and landscape position factors, the costs of energy and infrastructure to move and apply water, and resource stewardship considerations. In the case of wine grapes, growers generally seek to optimize fruit quality with less emphasis placed on yield. This can often result in reductions in the amount of water applied for irrigation use through regulated deficit irrigation. This is likely the reason that the calculated amount of water applied for irrigation in the evaluated wine grape blocks was consistently below net irrigation requirement.
Objectives for wine grape quality and yield depend on the varieties being grown — growers typically seek 5 to 6 tons per acre for white varieties compared with 2 to 3 tons per acre for red varieties. One way growers strive to maintain increased yield in white varieties is to make postharvest water applications. It is postulated that increased carbohydrate storage late in the season in the woody tissue of the plant improves growth and fruit set the following season. Several survey respondents identified this as the reason why they use postharvest applications. There is a need for research on this topic to help guide grower decision-making and water use.
Pear and apple agricultural objectives are orientated towards high yields because they are often sold as an unbranded commodity. The annual yield required for a grower to cover costs is 22 tons per acre. Obtaining such high yields requires a number of inputs, including 2 to 3 afa of water for irrigation use. Growers could take advantage of local weather data and well documented information on water needs for California orchards (Schwankl et al. 2007) to improve upon the timing and amount of water applied to meet crop needs.
In both evaluated wine grape blocks and apple and pear orchards, irrigation system distribution uniformity was good. In all three crops, there were isolated systems that had low values, which indicates system maintenance and upkeep were needed. However, averages above 88% in irrigation systems for both crops speak to efficient water use by these farmers to meet their respective agricultural objectives. This efficient use, combined with the documented transition to drip systems in grapes and under-canopy sprinkler systems in apples and pears through the last three decades, leaves little room for gains in conservation through irrigation system updates.
Although the need to protect crops from both frost and heat damage occurs on a limited amount of the total irrigated agriculture acreage in the study area, it still represents the next greatest need of water for irrigated agriculture. However, at the same time, it is imperative to find alternatives for this need in order to maintain stream flows at levels that support riparian wildlife and ecosystems.
The timing of water application for frost and heat events corresponds with critical salmon life stages and challenging stream conditions (fig. 7). Frost season, in March, April and even May of each year, is when young smolts migrate downstream to the ocean and young-of-the-year move downstream to large tributary streams. Heat events, which occur in July and August, match up with seasonal high stream water temperatures during critical rearing periods for young-of-the-year. In both cases, reductions in flows can prevent movement, increase stream temperatures and potentially result in increased mortality rates of these juvenile salmonids.
In the case of grape production, grower survey responses indicated growers had transitioned to large volume solid set sprinkler systems for frost protection that deliver 50 gal/min/ac. This is because these systems are more reliable relative to other frost protection methods. It is possible to use low volume sprinkler systems that deliver 12 gal/min/ac, but the availability and durability of these systems are limited and they require innovation and improvement prior to grower adoption.
Grower survey responses indicate that they have evolved in their understanding of crop protection for frost and heat damage. This increase in knowledge has resulted in a reduction in the amount of water used during each threatening event. For frost, growers explained that they run their systems for shorter durations that closely match the timing of climatic threats for frost damage. They do this by intensively tracking dew point and ambient temperature through frost warning services and weather stations within specific vineyard blocks. Similarly, growers that protect against heat damage are switching from continual system operation when temperatures are at or above 100°F. They now pulse their systems, resulting in the system operating for 2 to 3 hours over the course of an event instead of a solid 6 to 12 hours. Facilitating these decisions with more local weather data, perhaps online decision support tools, and other varietal choices and planting approaches will contribute to water use efficiency for these purposes.
An interesting parallel to growers’ increased knowledge and/or evolution in methods to protect crops from frost and heat damage is the documented change in the number of “cold” and “hot” days within the study area. In their survey responses, growers consistently explained there were fewer days now requiring frost and heat protection than in the past. This is consistent with documented trends in temperatures from 1955 to 2005 (Robinson 2007). These observations and trends suggest a reduction in the use of water for crop protection. However, as 2007 demonstrated for heat protection and 2008 demonstrated for frost protection, growers still need to be prepared to protect crops — both extremely hot and extremely cold conditions are never further than one season away, which was profoundly demonstrated in the extreme frosts of March and April 2008.
With regard to irrigated pasture, there is the potential to increase the consistency in the timing and amount of water applied to meet crop demand that will lead to greater efficiencies. Before discussing these opportunities, it is important to point out that irrigated pasture managers have also participated in USDA NRCS–sponsored programs to improve water delivery infrastructure since 1989. The result has been the conversion of over 80% of irrigated pasture from open-ditch to gravity type underground pipe and valve and sprinkler systems to reduce water loss and channel erosion. In looking for additional opportunities to improve irrigated pasture water use, recent research in other California irrigated pasture systems has identified high variability in the amount of water applied (Hanson et al. 2000). This included both over and under application of water to meet crop demand. Providing Mendocino County pasture managers with this information and facilitating their use of nearby measurements of evapotranspiration to estimate water needed to grow forage will contribute to their water resource management efforts. Additional steps could include on-farm measurements of soil moisture (Hanson et al. 2000) and forage production to generate more precise measurements and direction on water application rates and amounts.
A model for conservation
This collaborative field-based endeavor to understand and document agricultural water demand provides a successful model for resolving water use conflicts by generating credible water use numbers in the context of watershed specific-water availability. Meeting the agricultural, municipal, industrial and environmental water needs within the study area will require a combination of solutions and options for conserving and securing alternative sources of water. This will include continuation of on-farm conservation and water-use efficiency, connections between agriculture and recycled water, other potential policy changes, and more novel programs to afford winter storage for summer use by irrigated agriculture (see sidebar).
Survey responses about water conservation, coupled with the overall results for irrigation system efficiency, suggest that the participating growers are making efforts to be efficient water resource managers. Additional opportunities may exist to conserve agricultural water use through reductions in postharvest applications. The merits and benefits to achieving respective crops’ agricultural objectives needs to be carefully evaluated for this water use. However, if this use does not provide a benefit, the savings in water used would be significant relative to the need for instream flows during the time of the year that postharvest applications are made.
One alternative with increasing potential is the use of recycled water. From 1997 to 2006, the city of Ukiah generated an average of 3,982 afa (minimum 3,755 and maximum 4,226) of water for residential and industrial uses (Burton 2007). The inference can be made that this generates approximately the same amount in wastewater that is currently treated at the Ukiah wastewater treatment facility. Dividing this volume by 1.25 afa, the average total annual water demand per acre of irrigated agriculture, indicates that water demand for approximately 3,185 acres of irrigated agriculture could be met with recycled water. The potential for use of this water by irrigated agriculture is initially dependent upon a reliable delivery system near acreage that can and is willing to use the water. Based on grower survey responses, there appears to be guarded willingness to use this water when the source is near irrigated acreage. Precedent for this type of use has already been set in other nearby regions both outside (Weber et al. 2014) and inside (Winzler & Kelly 2007) the Russian River watershed. Dialogue with Mendocino County growers on the concerns they have for using this water and exploration of infrastructure needs are moving this opportunity one step closer to fruition (see sidebar).
Another opportunity to meet agricultural and environmental water needs is strategic capture and storage of high winter flows. Using storage to match irrigated agricultural water demand with available water is an approach whose time has arrived — the storage structures and systems for water conveyance have already been put in place by growers and conservation organizations (see sidebar). This approach synchronizes water demand and availability and reduces water diversions during summer low flow conditions, maintaining flows and critical stream habitat requirements during dry periods of the year.
Agricultural water use accounting provides path for surface water use solutions

