


All Issues
First known survey of cannabis production practices in California
Publication Information
California Agriculture 73(3):119-127. https://doi.org/10.3733/ca.2019a0015
Published online September 12, 2019
PDF | Citation | Permissions
Abstract
Legalization of cannabis production has daylighted a unique and highly valuable crop in California agriculture. State and regulatory agencies must now address the ecological, social and agricultural effects of cannabis production, but little is known about how growers produce this crop. Using an online survey, we gathered information from growers in July 2018 on their production practices. According to responses from about 100 growers, most cannabis was produced outdoors or in greenhouses, relied primarily on groundwater and used biologically based inputs for pest management. Many farms employed seasonal workers paid at fixed piece rates. Regulatory compliance varied according to farm size. Beginning to document growing practices will help scientists formulate key environmental, social and agronomic questions and develop relevant research and extension programs to promote best management practices and minimize negative environmental impacts of production.
Full text
Legalization of cannabis production in 2017 has generated demands for state regulatory, research and extension agencies, including UC, to address the ecological, social and agricultural aspects of this crop, which has an estimated retail value of over $10 billion (UC AIC 2017). Despite its enormous value and importance to California's agricultural economy, remarkably little is known about how the crop is cultivated.
While general information exists on cannabis cultivation, such as plant density, growing conditions, and nutrient, pest and disease management (Rosenthal 2010), only a few studies have attempted to measure or characterize some more specific aspects of cannabis production, such as yield per plant and regional changes in total production area (Bouchard 2009; Butsic and Brenner 2016; Potter et al. 2013, 2015; Toonen et al. 2006). These data represent only a very small fraction of domestic or global activity and are likely skewed since they were largely derived not from field studies but indirectly from police seizure data (e.g., Toonen et al. 2006) or aerial imagery (e.g., Butsic and Brenner 2016). In California, where approximately 66% of U.S. marijuana is grown (NDIC 2009), knowledge of the specific practices across the wide range of conditions under which it is produced is almost nonexistent.
Currently, 30 U.S. states have legalized cannabis production, sales and/or use, but strict regulations remain in place at the federal level, where it is classified as a Schedule I controlled substance. As a land-grant institution, UC receives federal support; were UC to engage in work that directly supports or enhances marijuana production or profitability, it would be in violation of federal law and risk losing federal support. As a result, UC research on California cannabis production has been limited and focused on the geography of production and its environmental impacts (Butsic and Brenner 2016; Carah et al. 2015; Levy 2014). These studies have documented the negative effects of production on waterways, natural habitats and wildlife. While such effects are not unique to cannabis agriculture per se, they do present a significant threat to environmental quality and sensitive species in the watersheds where cannabis is grown (Butsic et al. 2018). Science-based best management practices to mitigate or avoid impacts (which exist for most other crops) have not been developed for cannabis. Because information on cannabis production practices is so limited, it is currently not possible to identify key points of intervention to address the potential negative impacts of production.
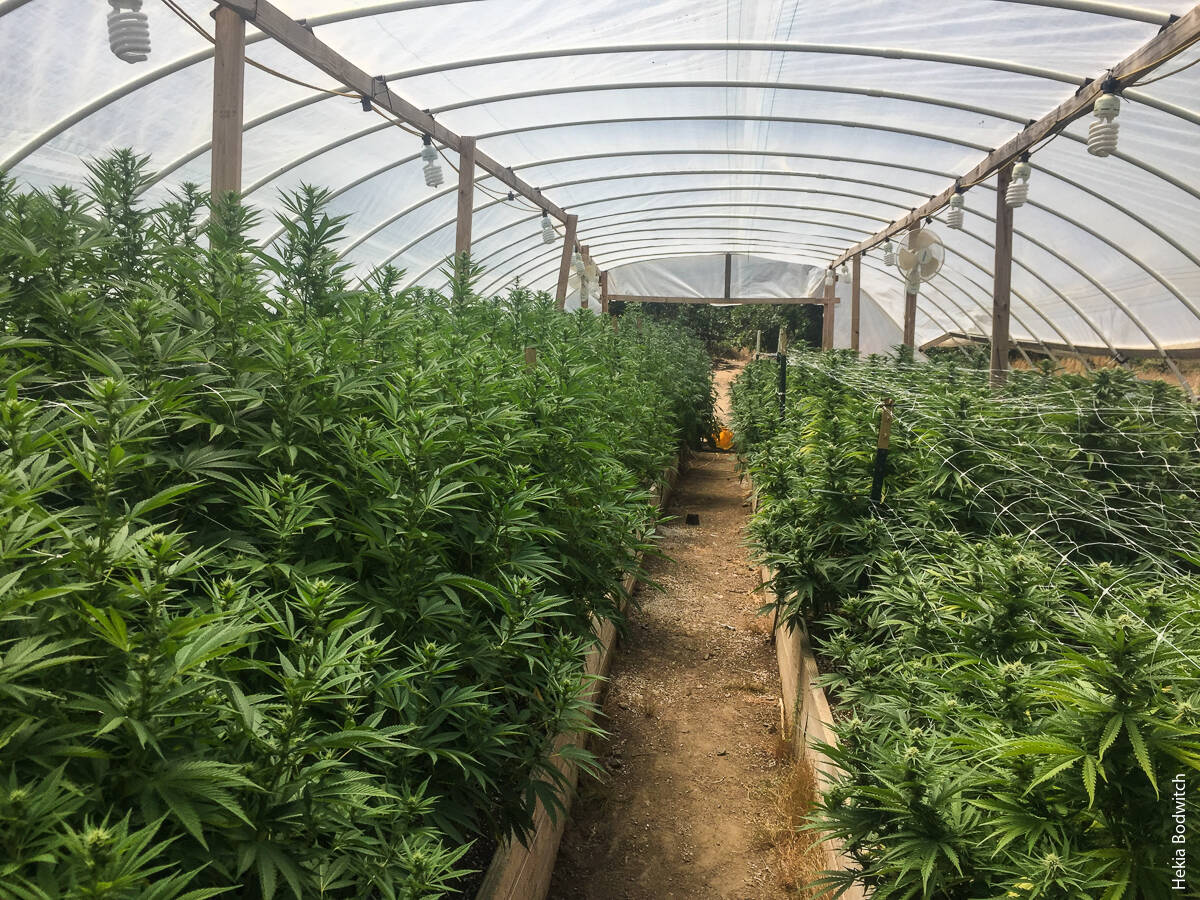
Most of the cannabis growers who responded to a 2018 survey conducted by UC researchers reported growing their crop outdoors or in greenhouses, such as the hoop house shown here.
As a first step toward understanding cannabis production practices, we developed a statewide survey on cultivation techniques, pest and disease management, water use, labor and regulatory compliance. The objective was to provide a starting point from which UC scientists could build research and extension programs that promote best management practices — which are allowable as long as their intended purpose is not to improve yields, quality or profitability. Survey results also establish a baseline for documenting changes in cultivation practices over time as legal cannabis production evolves in California.
Cannabis production survey
To characterize key aspects of cannabis production in California, we developed an anonymous online survey using Qualtrics survey software (Qualtrics, Provo, UT). A web-based survey that masked participants' identity was determined to be the most suitable approach given that in-person interviews were limited by legal restrictions on UC researchers visiting cannabis farms, and mail or telephone surveys were constrained by the lack of any readily available mailing address or telephone contact information for most cannabis growers, who are understandably discrete with this information. An online survey was also the most cost-effective means of reaching a large number of cannabis growers.
Survey questions focused on operational features (i.e., farm size and cultivation strategies, including outdoor, indoor and greenhouse cultivation), pest and water management, labor, farm revenue and grower demographics. Two draft surveys were reviewed by a subset of cannabis growers to improve the relevance of the questions and terminology. A consistent critique was that the survey was too long and asked for too much detail, taking up to 2 hours to complete, and that such a large time commitment would significantly reduce the response. We therefore made the survey more concise by eliminating or rephrasing many detailed questions across various aspects of cannabis production.
The final survey included 37 questions: 12 open-ended and 25 structured ( http://ucanr.edu/sites/cannabis/ ). Structured questions presented either a list of answer choices or a text box to fill in with a number. Each list of answer choices included an “Other” option with a box for growers to enter text. Open-ended questions had a text entry box with no character limit.
Condensing the survey to capture more respondents resulted in less detailed data, but the overall nature of the survey remained the same — a survey to broadly characterize multiple aspects of cannabis production in California. Data from the survey has supported and contextualized research by other scientists on specific aspects of cannabis production, such as water use (Dillis et al. 2019, this issue), permitting (Bodwitch et al. 2019 and Schwab et al. 2019, this issue), law enforcement (Polson et al. 2019, this issue), testing requirements (Valdes-Donoso et al. 2019, this issue), crop prices (Goldstein et al., unpublished data) and perceptions of cannabis cultivation in the broader community (LaChance 2019 and Valachovic et al. 2019, this issue).
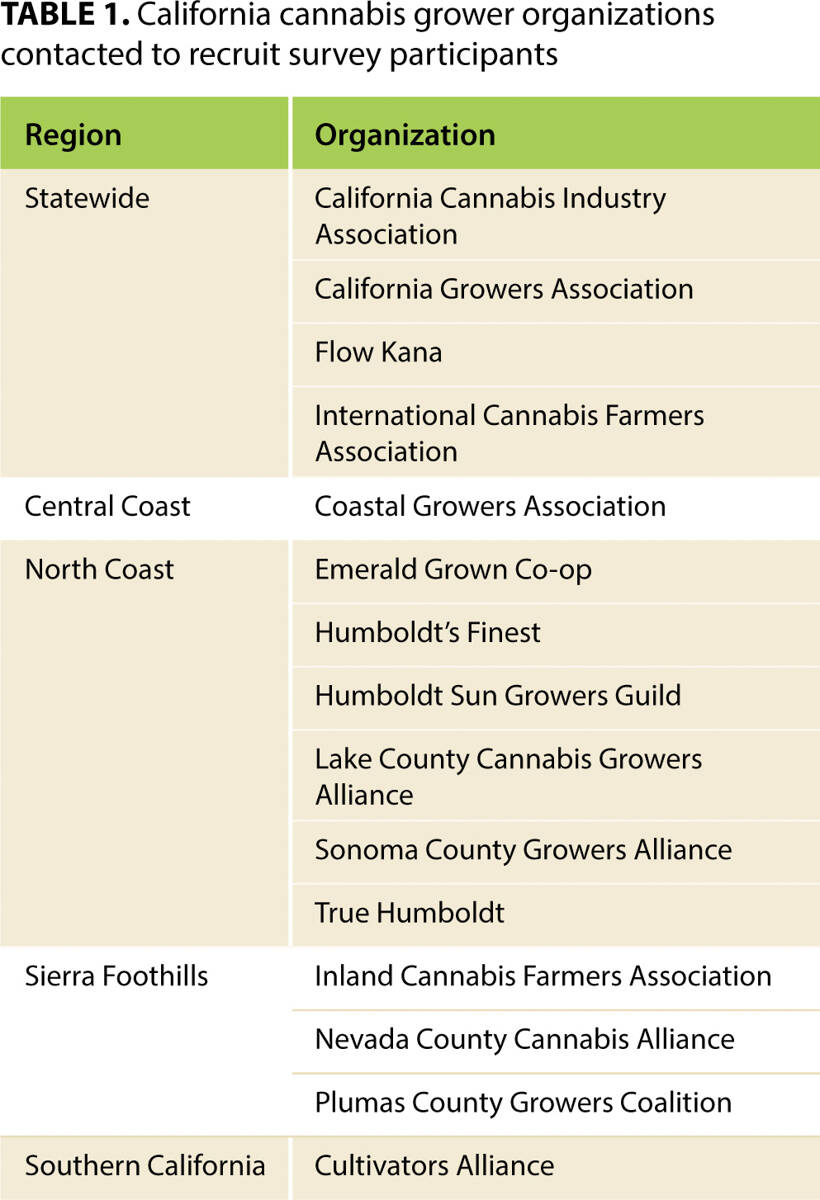
Recruitment of survey participants leveraged networks of California cannabis growers who had organized themselves for various economic and political purposes (see table 1). These were a combination of county, regional and large statewide organizations, with many growers affiliating with multiple groups. We identified the organizations through online searches and social media and sent recruitment emails to their membership list-serves. The emails contained an explanation of the survey goals, a link to the survey website and a message from the grower organization that endorsed the survey and encouraged members to participate.
The emails were sent in July 2018 to approximately 17,500 email addresses, although not all members of these organizations necessarily cultivated cannabis, and the organizations noted that their mailing lists somewhat overlapped the lists of other groups that we contacted. For these reasons, the survey population was certainly less than 17,500 individual cannabis growers, but because we were not able to view mailing lists nor contact growers directly, and because there are no comprehensive surveys of the number of cannabis farms in California, we could not calculate a response rate or evaluate the representativeness of the sample. Respondents were given until Aug. 15, 2018, to complete the survey. All survey participants remained anonymous, and response data did not include any specific participant identifiers.
Survey responses
In total, 101 surveys were either partially or fully completed. Responses to open-ended questions were coded before summary. Since incomplete surveys were included in this summary, the number of responses varied between questions. Each response was considered a unique grower and farm operation. As noted, survey response rate was difficult to quantify, and participants were self-selecting, which introduces bias. The survey data should be taken only as a starting point to guide more detailed evaluations of specific practices in the future, not as a basis for developing recommendations for production practices or policies.
Farm location, size, prior land use
Survey respondents (n = 58) operated farms primarily in Humboldt (24%), Mendocino (20%) and Nevada (11%) counties, but survey responses also came from Trinity (6%), Santa Cruz (4%), Sonoma (4%), San Luis Obispo (2%), Sacramento (2%), Butte (1%), Calaveras (1%), Fresno (1%), Los Angeles (1%), San Diego (1%), San Mateo (1%) and Siskiyou (1%) counties and Josephine County, Oregon (1%).
In line with California regulatory guidelines, small farms were defined as those of 10,000 sq ft or less, medium farms 10,001 to 22,000 sq ft and large farms 22,001 sq ft or more. Accordingly, 74% of farms were small, 16% were medium and 8% were large (n = 61). For those growers who reported on their land use in 2013 (n = 58), most (78%) farmed on land that was previously used entirely or in part for cannabis production (47% cannabis only; 31% mixed cannabis and other uses). The other 22% indicated that the land was used in 2013 for agricultural crops, ranching, open space or “other” land uses.
Cultivation techniques
For this survey, we differentiated between outdoor (open air, sunlight), greenhouse (partial or full sunlight) and indoor farming (artificial light). The most common ways to farm were all outdoors (41%), combined outdoor and greenhouse (25%) and greenhouse only (10%). This was followed by various combinations of greenhouse and indoor (5%), greenhouse and other (5%), outdoor and other (5%), outdoor and indoor (3%), all indoor (3%) and other (3%) (n = 63).
When measured by total plants, farms with combined outdoor and greenhouse facilities were responsible for 41% of crop production, followed by outdoor and other (38%), greenhouse only (7%), outdoor only (5%), greenhouse and other (4%), outdoor and indoor (3%), greenhouse and indoor (2%) and other (1%). A majority of survey respondents grew their cannabis crop in raised beds (59%), native soil (49%) and/or grow bags (41%), followed by hydroponic systems (10%) and plastic pots (5%) (n = 55).
The average number of plants grown in outdoor farms was 166 (range 1 to 1,000, n = 47), in greenhouses, 582 (range 2 to 6,000, n = 26) and indoors, 383 (range 22 to 2,000, n = 7). When adjusted for total cropping area, this equates to 0.05 plant per sq ft for outdoor cultivation (range < 0.01 to 0.39 plant per sq ft, n = 41), 0.13 plant per sq ft for greenhouse cultivation (range 0.01 to 0.50 plant per sq ft, n = 25) and 0.64 plant per sq ft for indoor cultivation (range 0.06 to 2 plants per sq ft, n = 7).
Growing season, harvests, yields
The average growing season for outdoor growers was 190 days (range 122 to 334 days, n = 18) and for greenhouse growers 158 days (range 107 to 245 days, n = 8). Only one indoor grower provided information on growing season, indicating that the operation was farming 365 days a year.
Among outdoor growers, 93% produced a single annual cannabis crop, with the others reporting two or three harvests per year (n = 46). Among greenhouse growers (n = 27), only 48% reported a single annual harvest; the others reported two (33%), three (7%) and up to four to nine harvests per year (12%). Indoor growers almost always reported multiple annual harvests: 14% reported two harvests, 57% reported four harvests and 29% reported six harvests per year (n = 7).
Average yield was 1.08 lb per plant (range 0.02 to 10 lb per plant, n = 46), but yields varied by growing conditions: outdoor crops averaged 2.51 lb per plant (range 0.02 to 10 lb per plant, n = 46), greenhouse crops, 0.60 lb per plant (range 0.15 to 1.23 lb per plant, n = 26) and indoor plants, 0.20 lb per plant (range 0.06 to 0.40 lb per plant, n = 7). Adjusted for cropping area and plant density, average yields were 0.10 lb per sq ft for outdoor cultivation (range < 0.01 to 1 lb per sq ft, n = 40), 0.04 lb per sq ft for greenhouse cultivation (range < 0.01 to 0.12 lb per sq ft, n = 25) and 0.16 lb per sq ft for indoor cultivation (range 0.01 to 0.80 lb per sq ft, n = 7).
While outdoor production had the highest yield per plant harvested, indoor production generated higher overall yields per square foot harvested due to a shorter growing cycle and higher planting density, which allowed for multiple harvests from a greater number of plants.
Crop prices, revenues
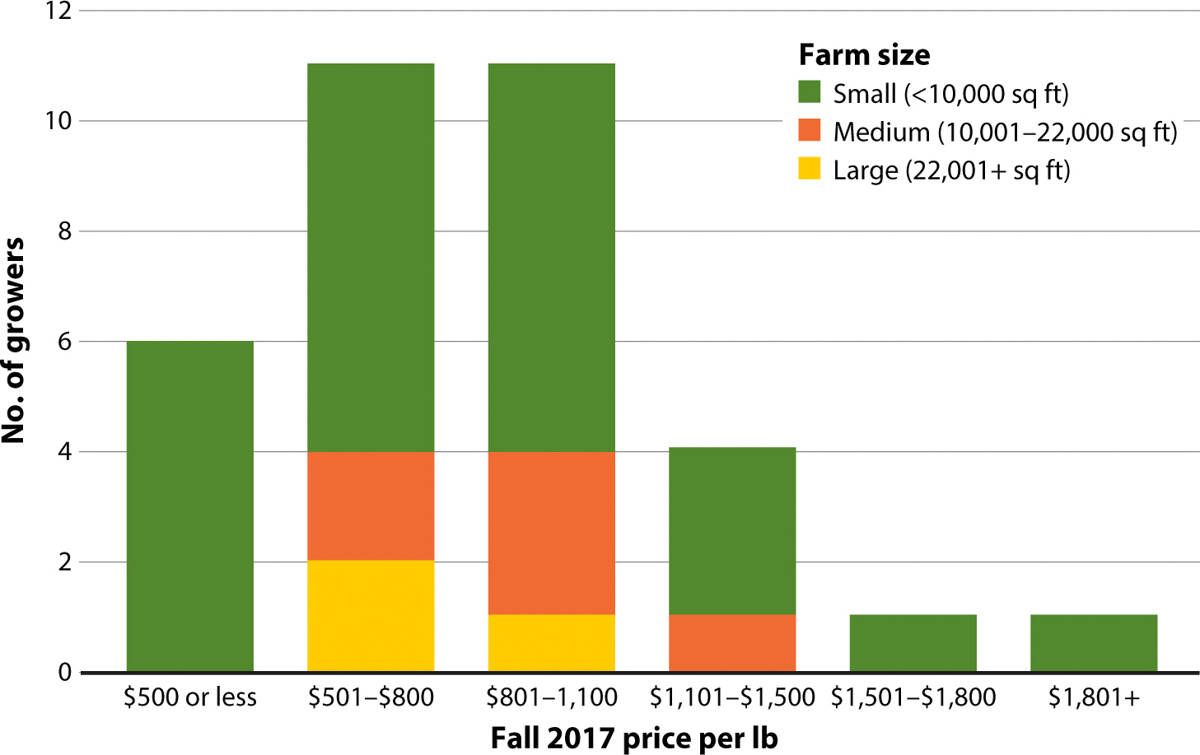
In fall 2017, the average cannabis sales price was $853 per lb for flowers (range $200 to $1,900 per lb, n = 37) and $78 per lb for trim (range $20 to $200 per lb, n = 18). While most growers received $500 to $1,100 per lb (fig. 1), small growers received more variable sales prices (fig. 2), from $200 to $1,900/lb (n = 34), which is likely the result of more diverse market relationships in this sector.
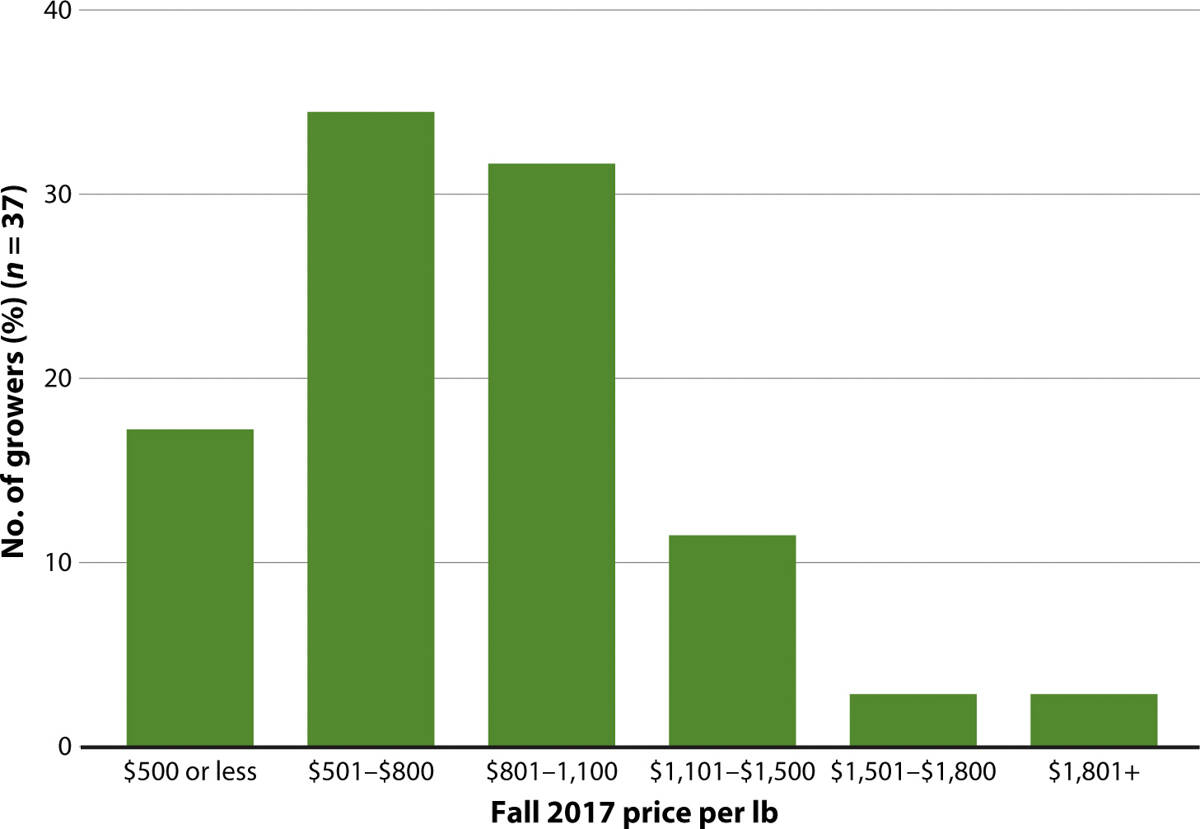
FIG. 1. Growers reported fall 2017 cannabis prices ranging from less than $500 per lb to over $1,801 per lb.
Income from cannabis varied: 34% of growers obtained 80% to 100% of their annual gross income from cannabis, while 33% reported no income from cannabis at all and the remaining 33% fell somewhere in the middle (n = 36). Of those growers who obtained 80% to 100% of their annual gross income from cannabis, 58% operated small farms, 17% medium farms and 25% large farms. Those who reported no income from cannabis all operated small farms.
Grower demographics
Respondents' (n = 32) ages ranged from 34 to 72. The mean age was 54, and the median age was 59. Of those reporting (n = 35), 69% identified as male, 29% identified as female and 3% as other. Most growers reporting held a bachelor's degree or equivalent (59%), 11% a master's degree, 40% attended some college and 1% attended some school (n = 35). A majority reported household incomes of $50,000 to $99,999 (52%), followed by $20,000 to $49,999 (24%), $100,000 to $199,999 (10%), over $200,000 (10%) and less than $19,999 (4%) (n = 29). Those who reported marital status (n = 35) mostly indicated that they were married or living with a partner (68%); 34% reported being single.
Survey respondents reported farming cannabis on average for 15 years (range 1 to 50 years, n = 84). The breakdown was as follows: 0 to 4 years (24%), 5 to 9 years (15%), 10 to 19 years (32%), 20 to 29 years (15%) and > 30 years (14%). Most growers operated only one farm (73%), 16% had two farms, 4% had three farms, 6% had four farms and 1% had five farms (n = 77).
Water sources, storage, use
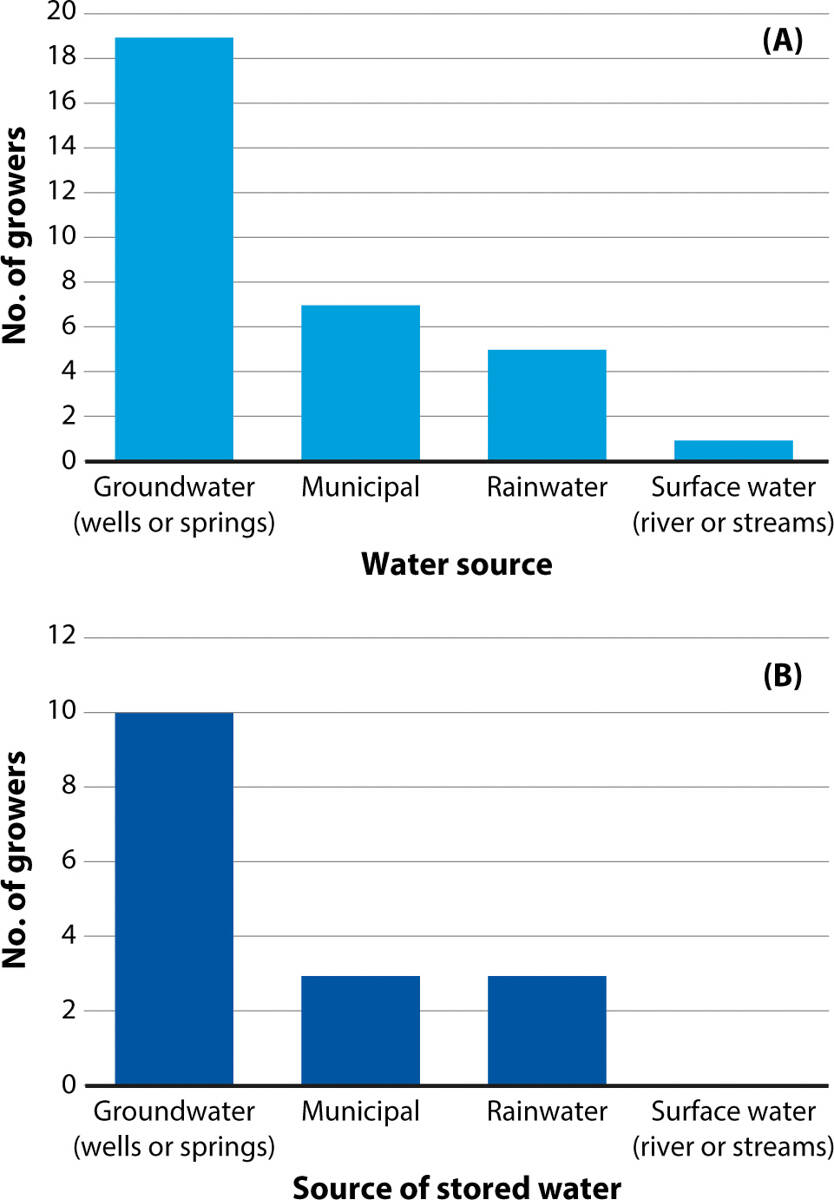
FIG. 3. Most growers reported using groundwater for cannabis cultivation (A). Half the survey respondents indicated that they did not need to store water. Those who did store water, sourced it mostly from wells or springs (B).
Most growers reported groundwater as their primary water source for irrigation (n = 28) (fig. 3A), with some growers reporting use of multiple water sources. Those using groundwater extracted 87% of annual volume between June and October. Of those storing water, most stored exclusively well or spring water, though some stored municipal water or rainwater (n = 16) (fig. 3B). Extraction to storage was greatest in summer but was relatively well distributed throughout the year.
Many growers reported that adding storage was either cost prohibitive or limited by regulatory constraints. Half the respondents indicated that additional storage was not needed, 40% indicated that the high costs of building storage were limiting, and 5% reported there was insufficient water available and 5% that they were unable to obtain permits to store (n = 40).
Most growers reported using variable amounts of water across the growing season. Outdoor growers applied, on average, 5.5 gal per day per plant (0.22 gal per sq ft per day) in August and 5.1 gal per day per plant (0.17 gal per sq ft per day) in September. Greenhouse growers applied an average of 2.5 gal per day per plant (0.18 gal per sq ft per day) in August and 2.8 gal per day per plant (0.22 gal per sq ft per day) in September (fig. 4A and 4B). When standardized by area, application rates were very similar between cultivation types (fig. 4B).

FIG. 4. Average water application rates for outdoor and greenhouse cannabis cultivation by month, in gallons per plant per day (A) and gallons per square foot of cultivated area per day (B). When standardized by area (B), application rates were similar in outdoor and greenhouse cultivation. Black lines indicate the range of values reported.
In our survey, growers reported using low maximum pumping rates (n = 15): 53% indicated rates ranging 1 to 50 gal per minute, 7% did not know their pumping rate and the remaining 40%, who used groundwater or municipal water sources, indicated that this question did not apply to them.
Nutrition, fertility
Growers reported (n = 55) using more than 30 different soil amendments and foliar nutrient sprays (fig. 5). The most commonly reported was organic fertilizer (35%), followed by various animal manures (33%) and meals (33%), compost tea (27%) and worm castings (24%).
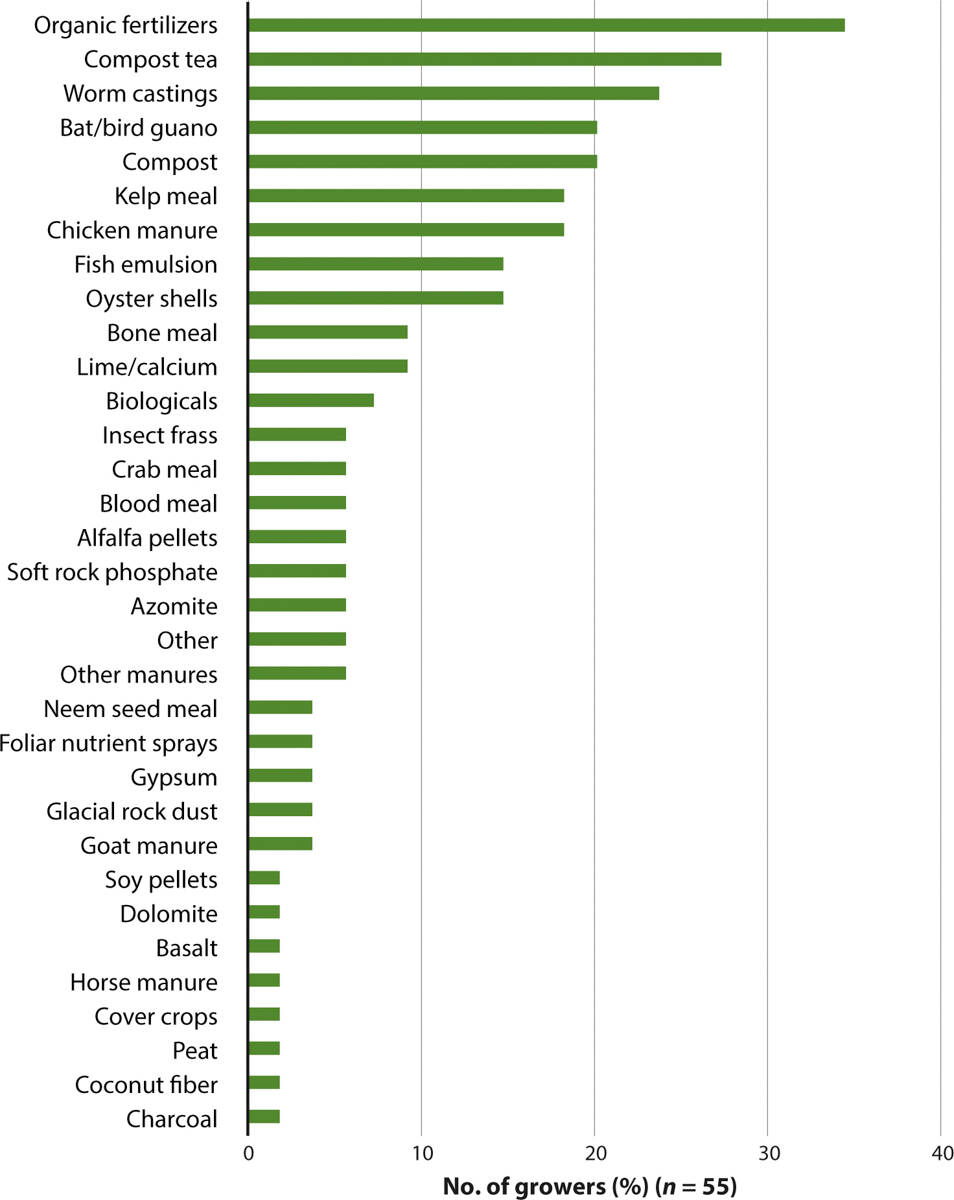
FIG. 5. Cannabis growers reported using many different types of soil amendments and foliar nutrient sprays.
Pests and diseases
Growers experienced a wide range of crop damage (n = 63). The most frequently reported was 1% to 5% crop damage (37%), followed by 10% to 25% (21%) or no crop damage (20%), and finally 5% to 10% crop damage (16%). The remaining 6% of growers reported damage levels greater than 25%.
Growers reported 14 different arthropods, 13 diseases and nine vertebrates that had negative impacts on cannabis production (fig. 6) (n = 60). The most frequent arthropod pest was mites (70%), followed by thrips (25%), aphids (17%) and unknown larvae (15%). The most common vertebrate pests were gophers, mice and rats (8%), followed by deer (5%) and wild boars (2%). Powdery mildew was by far the most commonly reported disease (43%), followed by other fungal diseases such as molds (30%; bud mold, grey mold, Botrytis spp.) and rots (12%; root rot, stem rot, bud rot, Fusarium spp.).
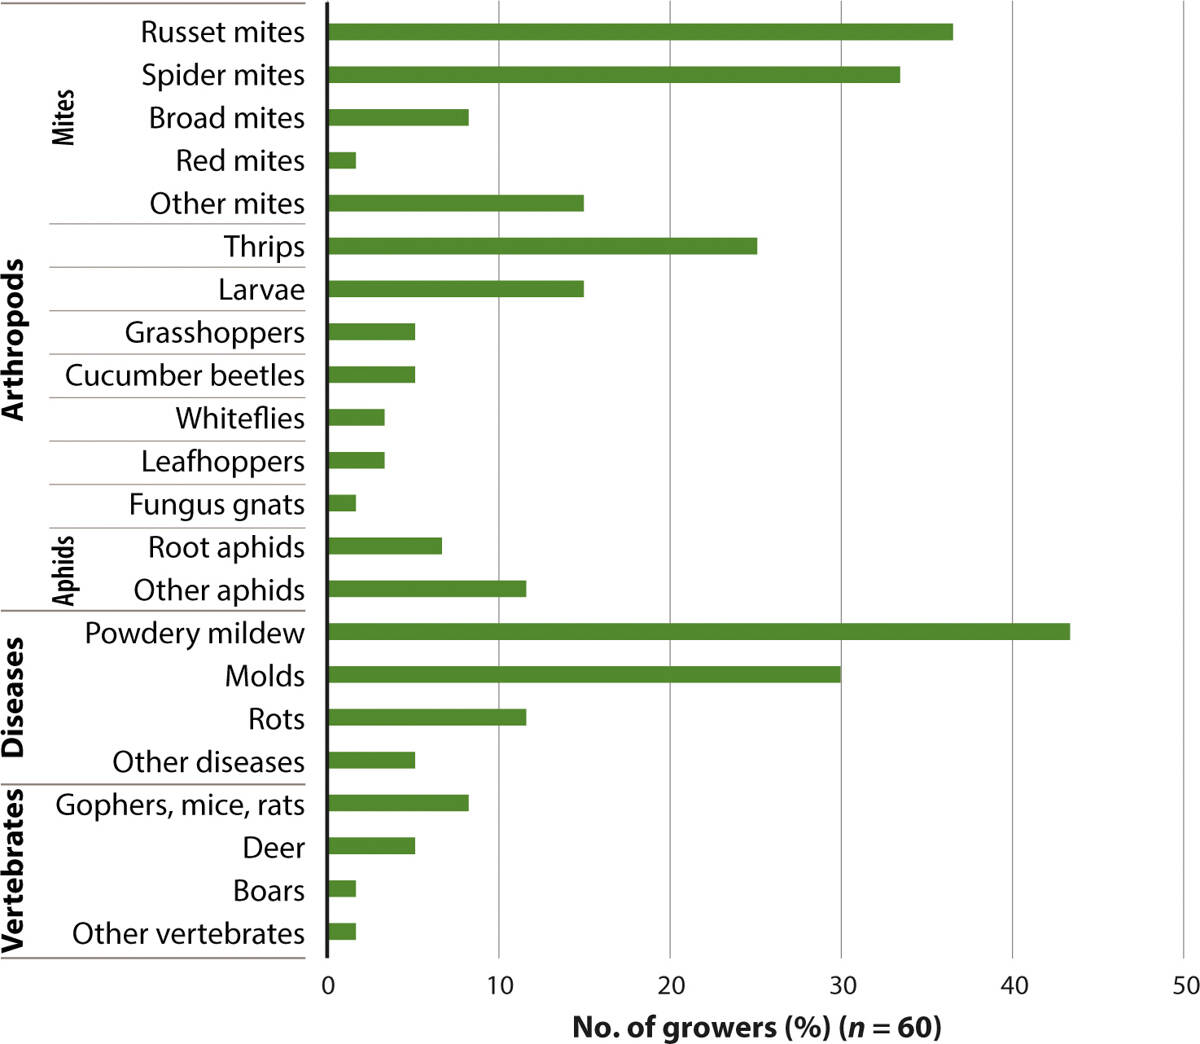
FIG. 6. Cannabis growers reported a wide range of pests and diseases. Mites, thrips, aphids and powdery mildew and molds were the most frequently reported.

Spider mite webbing on cannabis. Mites were the most frequently reported arthropod pest in the authors' survey.
While these findings are in line with cannabis pests and diseases reported by others (McPartland et al. 2000; Rosenthal 2012), survey data are self-reported data and grower identification of pests and diseases may not be entirely accurate. For instance, the complex of mites reported included russet mites, spider mites, broad mites and red mites. Growers were likely referring to hemp russet mite (Eriophyidae: Aculops cannibicola), two-spotted spider mite (Tetranychidae: Tetranychus urticae), broad mite (Tarsonemidae: Polyphagotarsonemus latus) and Carmine spider mite (Tetranychidae: Tetranychus cinnabarinus), respectively, but this remains unclear because there are many species of mite commonly referred to as russet mite, spider mite and red mite (ESA 2019). This similarly applies to aphids, thrips, larvae, mildew, rots and molds. Accurate species identification of these pests and diseases will remain uncertain until they can be more systematically collected and identified by UC academics or other scientists.
The most common approach to pest and disease control (n = 59) was to apply some type of solution or chemical to the crop (72%), followed by augmentation of natural enemies (33%) and various cultural practices (32%) (fig. 7).
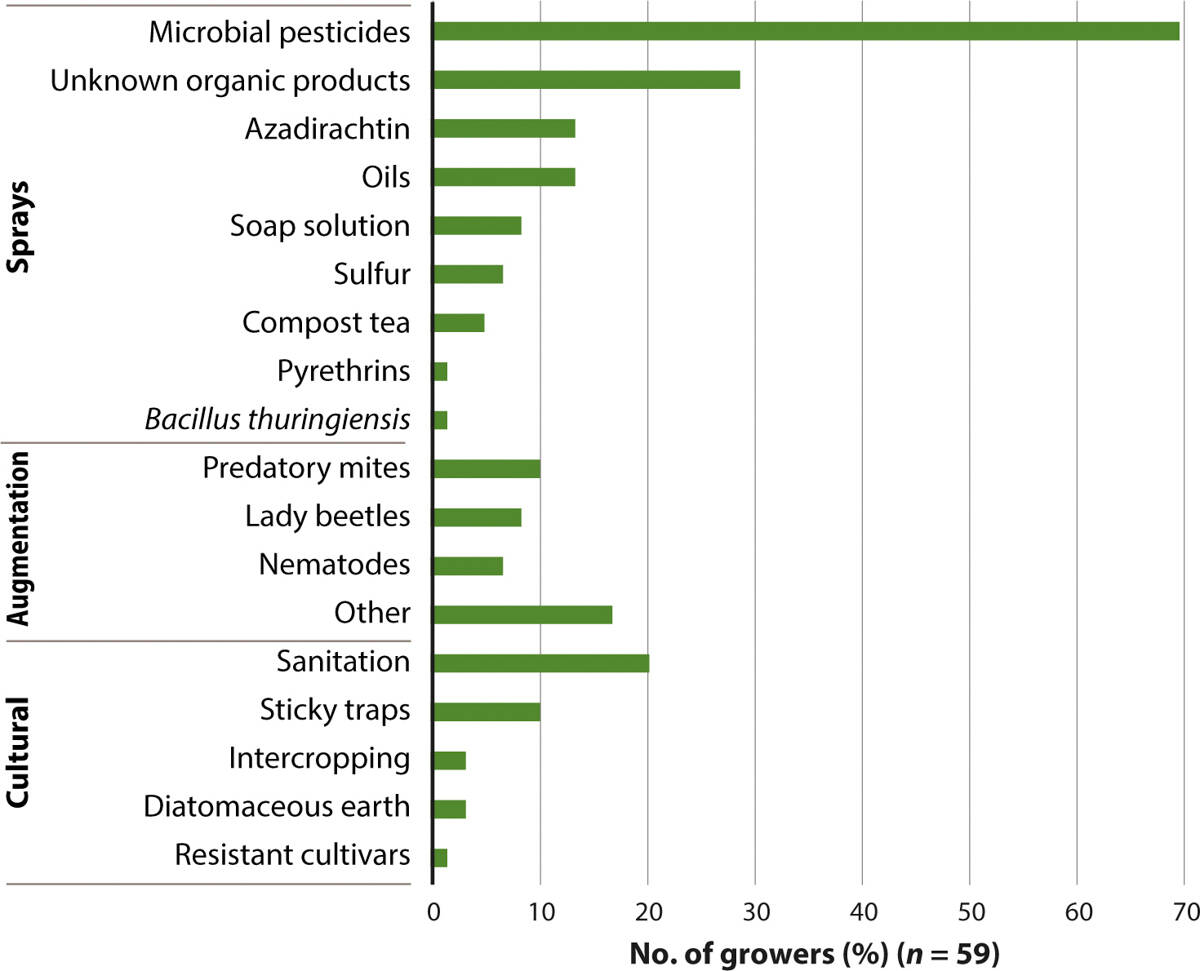
FIG. 7. Cannabis growers reported using various sprays, natural enemy augmentation and cultural practices for pest and disease management.
A majority of sprays (69%) were products that were biologically derived or approved for use in organic production. Products specifically used for control of arthropod pests included azadirachtin (13%), soap solution (8%), pyrethrins (2%) and Bacillus thuringiensis (2%). Many respondents indicated that certain products were effective against both pests and diseases, for instance microbial pesticides (69%), oils (14%) and compost tea (5%). Sulfur (7%) was the most commonly applied product specifically used for disease control. In addition, 29% of respondents claimed to use certified organic products for pest and disease management but did not name any product specifically. Finally, 2% of respondents reported that they did not spray for pests and diseases at all.
Augmentation of natural enemies involved the introduction of predatory mites (10%), lady beetles (9%), predatory nematodes (7%) and other unnamed beneficial insects (17%). Cultural practices included removal of infested plant material (i.e., sanitation) (20%), insect trapping (10%), intercropping (3%), use of diatomaceous earth (3%) and selection of resistant cultivars (2%).
Labor, regulatory compliance
Growers who reported hiring labor (n = 22) employed from one to 160 workers. Most common were seasonal workers (< 7 months) paid piece rate per pound of cannabis trimmed (81%). The reported per-pound trimme piece rate in 2017 varied from $50 to $200, with an average of about $150. This range is lower than 2016 industry rates of $120 to $250 per pound trimmed (ERA Economics 2017).
Growers (59%) also reported hiring seasonal hourly workers, with starting pay at $15 to $20 per hour. Other less common types of labor included permanent (> 7 months) hourly workers (37%, n = 8), permanent salaried workers (44%, n = 9), seasonal salaried workers (22%, n = 9) and permanent workers paid with a percentage of total crop, in the form of cash or product (50%, n = 10). No growers reported paying workers via profit sharing.
As of August 2018, a majority of growers reported that they had not applied for a state license to grow cannabis. From those reporting (n = 36), 47% had applied for a license and 53% had not. Nonparticipation in the licensing process was highest among small growers (fig. 8).

Need for more data
Our survey, although of limited sample size, is the first known survey of California cannabis growers and provided insights into common forms of cultivation, pest and disease management, water use and labor practices. Since completing this survey, we have discussed and/or presented the survey results with representatives from multiple cannabis grower organizations, and they confirmed that the data were generally in line with production trends. Evident in the survey results, however, was the need for more data on grower cultivation practices before best management practices or natural resource stewardship goals can be developed.
All growers monitored crop health, and many reported using a preventative management strategy, but we have no information on treatment thresholds used or the efficacy of particular sprays on cannabis crops. Likewise, the details of species-level pest and disease identification, natural enemy augmentation and sanitation efforts remain unclear.
Growers did not report using synthetic pesticides, which contrasts with findings from previous studies that documented a wide range of synthetic pesticide residues on cannabis (Cuypers et al. 2017; Schneider et al. 2014; Voelker and Holmes 2015). Product selection for cannabis is very limited due to a mixed regulatory environment that currently does not allow for the registration of any insecticide or fungicide for use specifically on cannabis (Stone 2014; Subritzky et al. 2017), although growers are allowed to use products that are exempt from residue tolerance requirements, exempt from registration requirements (e.g., food-grade essential oils) or registered for a use that is broad enough to include cannabis (e.g., “other horticultural crops”). As such, it may be that in the absence of legally available chemical controls growers were choosing allowable, biologically derived products (e.g., microbial pesticides, compost teas) or alternative strategies such as natural enemy augmentation and sanitation. Our survey population was perhaps biased toward nonchemical pest management — the organizations we contacted for participant recruitment included some that were formed to share and promote sustainability practices. Or, it may be that respondents were reluctant to report using synthetic chemicals or products not licensed for cannabis plants.
The only other published data on water application rates for cannabis cultivation in California we are aware of is from Bauer et al. (2015), who used estimates for Humboldt County of 6 gallons per day (gpd) per plant for outdoor cultivation over the growing season (June–October). Grower reported estimates of cannabis water use in this survey were similar to this rate (5.5 gpd/plant) in the peak growing season (August), but was otherwise lower. Due to the small sample size, we cannot say that groundwater is the primary water source for most cannabis growers in California or that few use surface water diversions. However, Dillis et al. (2019) found similar results on groundwater being a major water source for cannabis growers, at least in northwest California. If the irrigation practices reported in our survey represent patterns in California cannabis cultivation, best management practices would be helpful in limiting impacts to freshwater organisms and ecosystems. For example, where groundwater pumping has timely and proximate impacts to surface waters, limiting dry season groundwater extraction by storing groundwater or surface water in the wet season may be beneficial (Grantham et al. 2014), though this will likely require increases in storage capacity. The recently adopted Cannabis Cultivation Policy (SWRCB 2017) requires a mandatory dry season forbearance period for surface water diversions, though not for groundwater pumping. Our survey results indicate that the practical (especially financial) constraints on adding storage may be a significant barrier for compliance with mandatory forbearance periods for many growers.
More in-depth research with growers and workers is needed to explore the characteristics of the cannabis labor force and the trajectory of the cannabis labor market, especially in light of legalization. Several growers commented on experiencing labor shortages, a notable finding given that recent market analyses of the cannabis industry suggest that labor compliance costs are the most significant of all of the direct regulatory costs for growers (ERA Economics 2017).
Higher rates of licensing compliance among medium and large farms is not surprising given the likelihood that they are better able to pay permitting costs. Yet, that the majority of respondents indicated they had not applied for a license to grow cannabis, with over half noting some income from cannabis sales, indicates potentially significant effects if these growers remain excluded from the legalization process. More research is needed to understand the socioeconomic impacts of legalization, which likely extend beyond those accounted for in the state's economic impact analysis, which primarily focuses on economic contributions that a legalized market will bring to the state (ERA Economics 2017). Bodwitch et al. (2019) report that surveyed growers characterized legalization as a process that has excluded small farmers, altered local economies and given rise to illicit markets.
The environmental impacts of cannabis production have received attention because of expansion into remote areas near sensitive natural habitats. The negative impacts are likely not because cannabis production is inherently detrimental to the environment, but rather due to siting decisions and cultivation practices. In the absence of regulation and best management practices based on research, it is no surprise that there have been instances of negative impacts on the environment. At the same time, many growers appear to have adopted an environmentally proactive approach to production and created networks to share and promote best management practices.
Organizations that we approached to recruit survey participants had a fairly large base membership (1,000 to > 10,000 members), which is on a par with other major commodity groups, like the Almond Board of California (∼ 6,800 members) and California Association of Winegrape Growers (∼ 5,200 members). Membership included cannabis growers, distributors and processors as well as interested members of the public, and some people were members of more than one organization, suggesting a large, engaged community. Most of the organizations we contacted enthusiastically agreed to help us recruit growers for our survey, and we received excellent feedback on our initial survey questions. Growers who completed the survey were also clearly knowledgeable about cannabis cultivation.
Some potential future research topics include the development of pest and disease monitoring programs; quantifying economic treatment thresholds; evaluating the efficacy of different biological, cultural and chemical controls; developing strategies to improve water use and irrigation efficiency; understanding grower motivations for regulatory compliance; understanding the impacts of regulation; and characterizing the competition between labor in cannabis and other agricultural crops — to name just a few. As cannabis research and extension programs are developed, it will be critical to ensure that future surveys capture a representative sample of cannabis growers operating inside and outside the legal market, to identify additional areas for research and develop best practices for the various cultivation settings in which California cannabis is grown.
First known survey of cannabis production practices in California

