


All Issues
Stream flow modeling tools inform environmental water policy in California
Publication Information
California Agriculture 73(1):33-39. https://doi.org/10.3733/ca.2018a0039
Published online February 01, 2019
Abstract
Management of California's vast water distribution network, involving hundreds of dams and diversions from rivers and streams, provides water to 40 million people and supports a globally prominent agricultural sector, but it has come at a price to local freshwater ecosystems. An essential first step in developing policies that effectively balance human and ecosystem needs is understanding natural stream flow patterns and the role stream flow plays in supporting ecosystem health. We have developed a machine-learning modeling technique that predicts natural stream flows in California's rivers and streams. The technique has been used to assess patterns of stream flow modification, evaluate statewide water rights allocations and establish environmental flow thresholds below which water diversions are prohibited. Our work has informed the statewide Cannabis Cultivation Policy and influenced decision-making in more subtle ways, such as by highlighting shortcomings in the state's water accounting system and building support for needed reforms. Tools and techniques that make use of long-term environmental monitoring data and modern computing power — such as the models described here — can help inform policies seeking to protect the environment while satisfying the demands of California's growing population.
Full text
Over the past century, California has built an extraordinarily complex water management system with hundreds of dams and a vast distribution network that spans the state. This system generates electricity, provides flood protection, delivers reliable water supplies to 40 million people and supports one of the most productive agricultural regions in the world. Yet development of the state's water management system has come at a price. Damming waterways, diverting water from rivers and streams and altering natural flow patterns have transformed the state's freshwater ecosystems, leading to habitat degradation, declines of freshwater species and loss of services that river ecosystems provide, including high-quality drinking water, fishing and recreational opportunities, and cultural and aesthetic values.

A modeling technique that predicts natural stream flows can help California develop sustainable water management strategies. This photo of Pine Flat Dam on the Kings River shows a USGS gauge below the dam.
The state aims to accommodate human water needs while maintaining sufficient stream flow for the environment. To support this mission, scientists from the U.S. Geological Survey (USGS), The Nature Conservancy (TNC) and UC have developed new techniques and tools that are advancing sustainable water management in California. At the center of these new advances is the need to understand the natural ebbs and flows in the state's rivers and streams.
Natural patterns in stream flow are characterized by seasonal and annual variation in timing (when certain flows occur), magnitude (how much flow), duration (how long flows of certain levels persist) and frequency (how often flows of certain levels occur). California's native freshwater species are highly adapted to these seasonally dynamic changes in stream flows. For example, salmon migration is triggered by pulses of stream flow that follow winter's first storms, reproduction of foothill yellow-legged frogs is synchronized with the predictable spring snowmelt in the Sierra Nevada, and many native fish breed on seasonally inundated floodplains, where juveniles take advantage of productive, slow-moving waters to feed and grow.
When rivers are modified by dams, diversions and other activities, flows no longer behave in ways that support native species, contributing to population declines and ultimate extinction. Thus, understanding natural stream flow patterns and the role they play in supporting ecosystem health is an essential first step for developing management strategies that balance human and ecosystem needs.
Unfortunately, our ability to assess alteration of natural stream flow patterns, and the ecosystem consequences, is hindered by the absence of stream flow data. California's stream flow gauging network offers only a limited perspective on how much water is moving through our state's rivers. In fact, it's been estimated that 86% of California's significant rivers and streams are poorly gauged and nearly half of the state's historic gauges have been taken offline due to lack of funding (TNC 2018a). Of those gauges that are still in operation, most are located on rivers that are highly modified by human activities and gauge records prior to impacts are limited. These limitations can be partially overcome with modeling approaches to predict the attributes of natural stream flow expected in the absence of human influence. The predictions can then be compared to measured stream flow at gauging locations, or they can be used to estimate natural flow conditions in ungauged streams.
Developing stream flow models
In 2010, Carlisle et al. (2010) developed a modeling technique to predict natural attributes (such as magnitude, duration, frequency, timing and variability) of stream flow and assessed stream flow alteration at gauges throughout the United States (Carlisle et al. 2011). Soon after, UC and TNC scientists began using the approach to expand and further refine the technique for applications in California (e.g., Grantham et al. 2014; Zimmerman et al. 2018).
The models have evolved over time, but all rely on stream flow monitoring data from USGS gauges located on streams with minimal influence from upstream human activities. These are referred to as reference gauges. Some reference gauge data come from historical measurements made before significant modification of flows occurred, such as the years prior to the building of a dam. The remaining data are from reference gauges located in California watersheds that remain minimally altered by human influence.
Once reference gauges were identified and flow records obtained from the USGS web-based retrieval system, we used geographic information systems to characterize the watersheds above each reference gauge based on their physical attributes, such as topography, geology and soils (Falcone et al. 2010). We also assembled monthly precipitation and temperature climate data for the past 65 years for each watershed.
The watershed variables and climate data were then compiled and statistically evaluated in relation to observed flow conditions at the reference sites using a machine-learning approach (Cutler et al. 2007) that uses the power of modern computers to search for predictive relationships in large data sets. An advantage of machine-learning techniques is the ability to make predictions from multiple model iterations (i.e., alternate versions of the model trained with different subsets of the data), which tends to increase accuracy. Once we had developed and evaluated models using observed stream flow data from reference gauges, we could predict stream flow attributes for any portion of a stream or river in California for which the climate and watershed characteristics were known (fig. 1). Additional technical details of the modeling approach are provided in Carlisle et al. 2016 and Zimmerman et al. 2018.
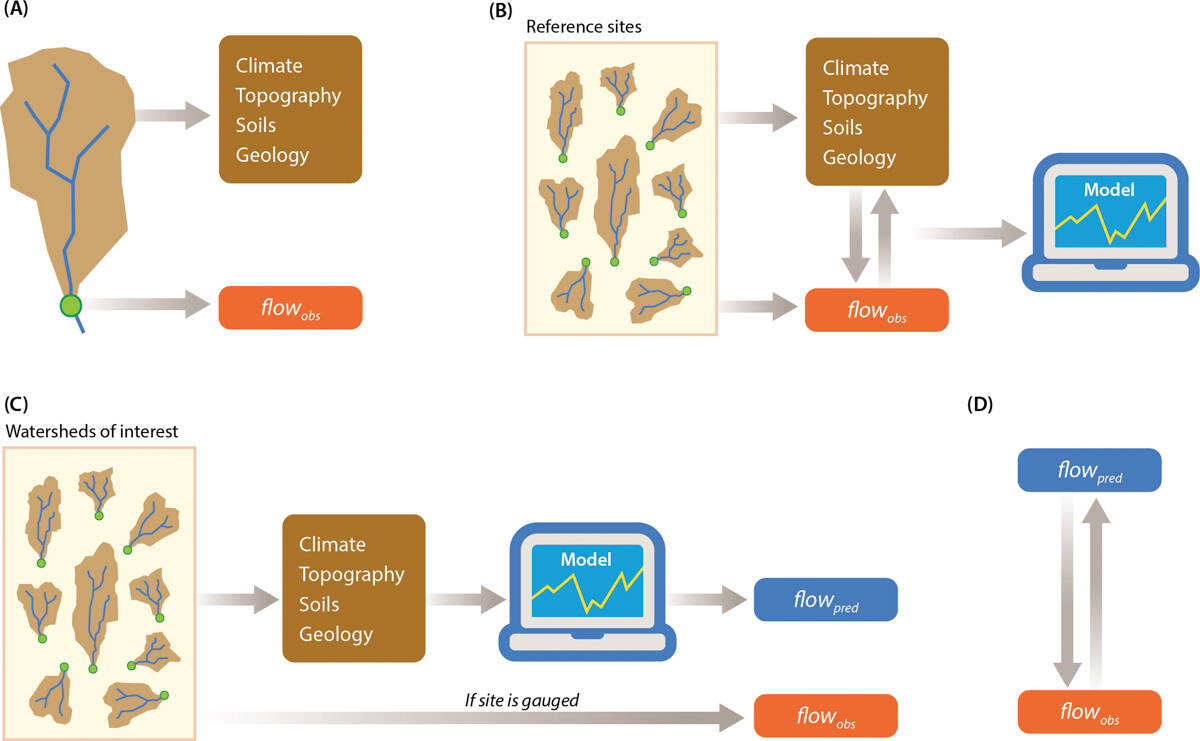
FIG. 1. Our flow modeling approach: (A) Reference flow gauges, located on streams with minimal upstream human Influence, are Identified and flow observations (flowobs) and information on physical watershed characteristics compiled in a database. (B) Models are then developed that relate physical watershed characteristics to observed flows (e.g., September mean monthly flow), using data from all reference gauges in the region. (C) Once the models are “trained,” they can be used to make predictions of expected natural flows (flowpred) at any location for which the same watershed variables are calculated. (D) If predictions are made at altered (nonreference) gauged sites, comparisons between observed values and predicted values can be made to estimate the degree to which flows have been altered from natural expected conditions.
Patterns of stream flow modification
In a study led by Zimmerman et al. (2018), we applied the machine-learning technique to assess patterns of stream flow modification in California. We did this by predicting natural monthly flows at 540 streams throughout California with long-term USGS gauging stations and comparing those predictions with observed conditions. We then assessed how observed flow conditions at the gauges deviated from predictions and recorded the frequency and degree to which flows were either higher (inflated) or lower (depleted) than natural expected levels, while considering the uncertainty of model predictions.
We found evidence of widespread stream flow modification in California (fig. 2). The vast majority (95%) of sites experienced at least 1 month of modified flows over the past 20 years and many sites (11%) were modified most of the time (≥ 66% of months over the period of record). When stream flows were modified, the magnitude of modification tended to be high. On average, inflated stream flows were 10 times higher than natural expected levels, whereas depleted stream flows were 20% of natural expected levels.
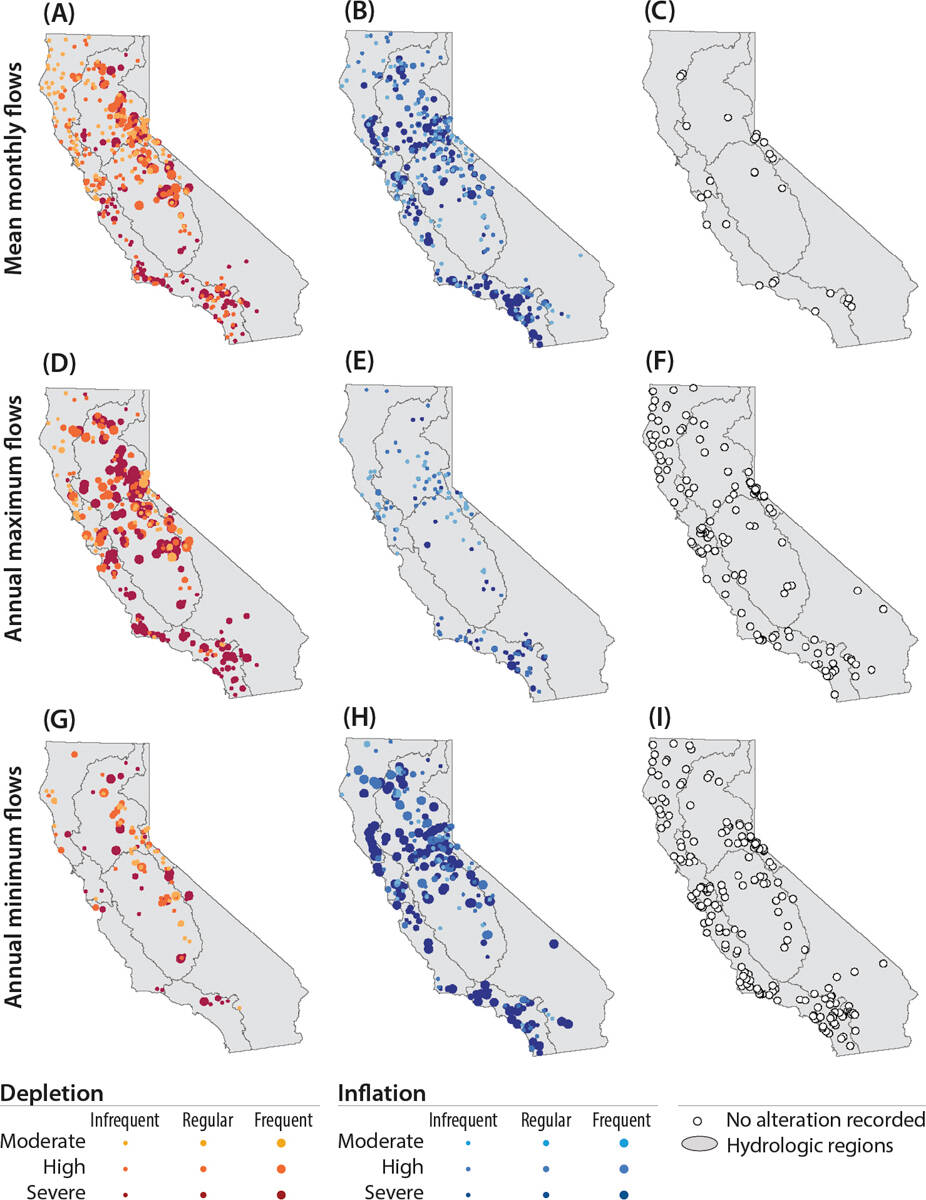
FIG. 2. Patterns of flow alteration magnitude and frequency for mean monthly (A–C), annual maximum (D–F) and annual minimum (G–I) flows. Alteration frequency is shown by symbol size and magnitude by color intensity for flow depletion (A, D, G) and inflation (B, E, H). Gauge locations with no alteration recorded are also shown (C, F, I). Reproduced from Zimmerman et al. (2018).
Overall, stream flow modification in California reflects a loss of natural seasonal variability by shifting water from the wet season to the dry season and from wet areas of the state to the drier south. Stream flow inflation was most common in dry summer months and for annual minimum flows. Conversely, flow depletion was most common in winter and spring months and for annual maximum flows. Unaltered sites tended to occur in places with relatively low population density and water management infrastructure, such as the North Coast, whereas greater magnitude and frequency of alteration was seen in rivers that feed the massive water infrastructure in the Central Valley and the populated Central Coast and South Coast regions.
A key water management goal in California is to manage river flows to support native freshwater biodiversity. By estimating natural river flows and the degree to which they are modified, our work provides a foundation for assessing “ecological flow” needs, or the river flows necessary to sustain ecological functions, species and habitats. Assessments of ecological flow needs are generally performed at stream reach to regional scales (Poff et al. 2010), but rarely for an area as large and geographically complex as California.
In 2017, a technical team that includes scientists from UC, TNC, USGS, California Trout, Southern California Coastal Water Research Project and Utah State University began developing a statewide approach for assessing ecological flows. The team has identified a set of ecologically relevant stream flow attributes for California streams that reflect knowledge of specific flow requirements for key freshwater species and habitats (Yarnell et al. 2015). Our modeling technique (previously used to predict monthly and annual minimum and maximum flows) is now being extended to predict natural expectations for these new stream flow attributes.

By estimating natural river flows and the degree to which they are modified, the authors' modeling technique enables scientists to assess “ecological flow” needs, or the river flows necessary to sustain ecological functions, species and habitats. This includes the amount needed to maintain adult salmon passage and spawning and winter rearing conditions for juvenile salmon.
Model predictions of the natural range of variability for these ecologically relevant stream flow attributes will provide the basis for setting initial ecological flow criteria for all streams and rivers in California by the State Water Resources Control Board (SWRCB) and other natural resource agencies. These ecological flow criteria will be based on unimpaired hydrologic conditions, but they can be refined in locations where management and ecological objectives require a more detailed approach. For example, refined approaches would likely be required in rivers that must be managed for species listed under the Endangered Species Act or in rivers where substantial flow and physical habitat alteration makes reference hydrology less relevant for setting ecological flow criteria, such as in the Central Valley or in populated watersheds of coastal California.
Our technical team also was involved in establishing the California Environmental Flows Workgroup of the California Water Quality Monitoring Council (State of California 2018). The mission of the Workgroup is to advance the science of ecological flows assessment and to provide guidance to natural resource management agencies charged with balancing environmental water needs with consumptive uses. The Workgroup is comprised of representatives from state and federal agencies, tribes, and nongovernmental organizations involved in the management of ecological flows. It serves as a forum to facilitate communication between science and policy development and to provide a common vision for the use of tools and science-based information to support decision-making in the evaluation of ecological flow needs and allocation of water for the environment.
Water accounting reforms
The modeling technique described above has also been used to evaluate statewide water allocations. Grantham and Viers (2014) analyzed California's water rights database to evaluate where and to what extent water has been allocated to human uses relative to natural supplies. They calculated the maximum annual volume of water that could be legally diverted according to the face value of all appropriative water rights in the SWRCB's water rights database. Water rights were distributed according to their location of diversion, and the permitted diversion volumes were aggregated at the watershed scale to estimate a maximum water demand for each of the state's watersheds. These permitted water diversion volumes were compared with modeled predictions of average annual supplies to estimate the degree of appropriation of surface water resources throughout the state (fig. 3).
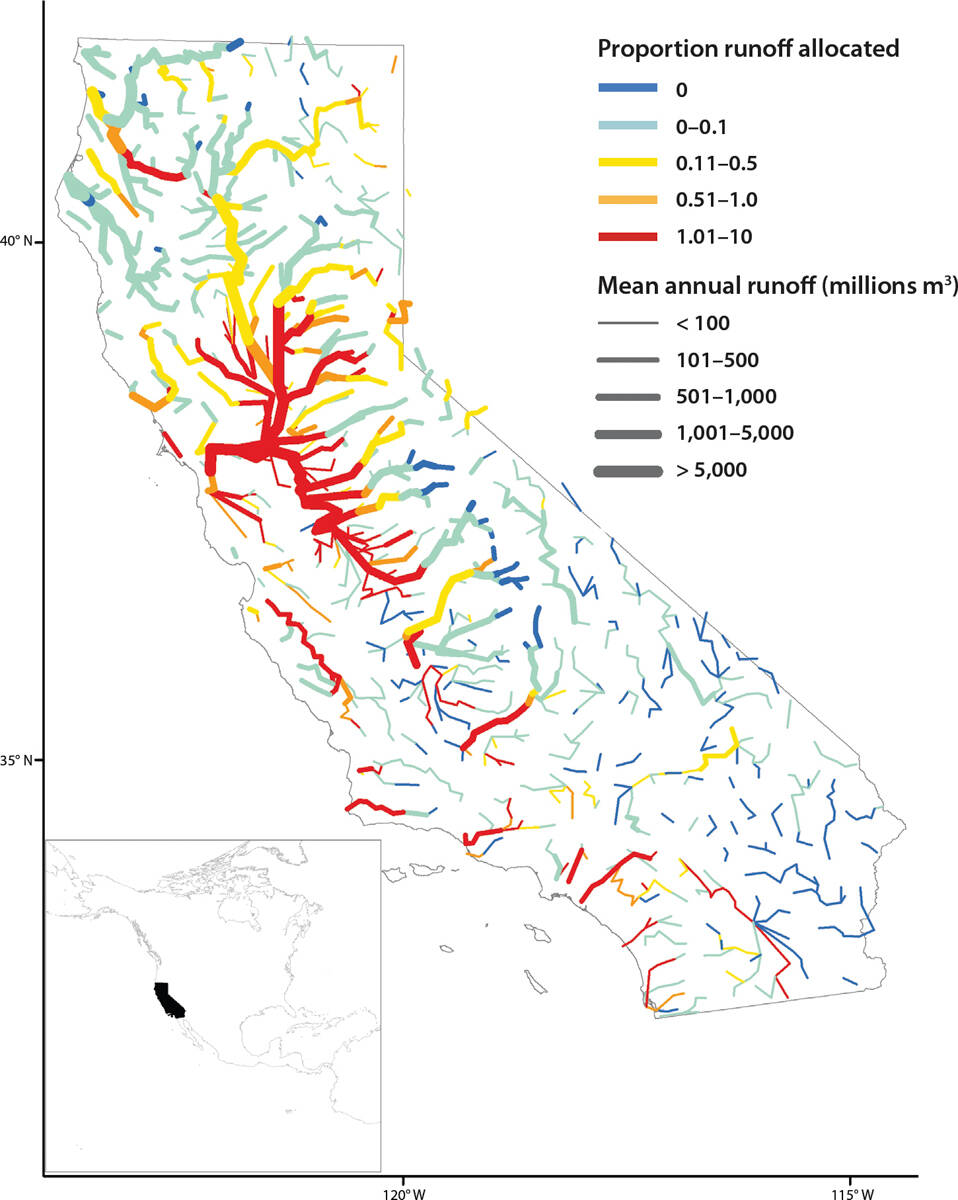
FIG. 3. Cumulative volumetric allocations of water rights relative to mean annual runoff for all major watersheds in California. The width of the lines corresponds to the mean annual runoff (in millions of cubic meters). Reproduced from Grantham and Viers (2014).
The study found that appropriative water rights exceed average supplies in more than half of the state's large river basins, including most of the major watersheds draining to the Central Valley, such as the Sacramento, Feather, Yuba, American, Mokelumne, Tuolumne, Merced and Kern rivers. In the San Joaquin River, appropriative water rights were eight times the volume of estimated natural water supplies (Grantham and Viers 2014). The volume of water rights allocations would be much higher if pre-1914 and riparian water rights had been included, but these data were not available at the time. The analysis also revealed that water rights allocations poorly represent actual water use by water rights holders. For example, comparisons of allocations with water use suggest that in most of California only a fraction of claimed water is being used.
In a well-functioning water rights system where allocations are closely tracked and verified, an excess of water rights relative to supplies is not necessarily a problem. During water shortages, holders of junior appropriative rights would be required to curtail their water use. When water is abundant, most water rights holders should be able to fully exercise their claims. Uncertainty in when, how and where water is being used, however, threatens the security of water rights — particularly when water is substantially overallocated relative to natural supplies. During the 2012–2016 drought, for example, the SWRCB issued notices of curtailment to water rights holders to protect endangered fish species within priority watersheds. Less controversial targeted cutbacks to individuals might have been sufficient if the agency had more accurate information on how water rights were being exercised.
As the 2012–2016 drought progressed, flaws in the state's accounting system for tracking water rights became more apparent. This study, together with other policy reports (e.g., Escriva-Bou et al. 2016), articulated the need for water accounting reforms, raised public awareness and helped to mobilize support for new legislation in 2015 (Senate Bill 88), which significantly increased water-use monitoring and reporting requirements for water rights holders. The new regulations also extended reporting requirements to senior water rights holders (pre-1914 appropriative and riparian water rights holders), which are among the largest individual water users in the state.
Flow thresholds for cannabis water diversions
The legalization of recreational cannabis in 2016 with passage of State Proposition 64 prompted state agencies to develop new policies to regulate the production, distribution and use of the plant. For example, California Senate Bill 837 directed the SWRCB to establish a new regulatory program to address potential water quality and quantity issues related to cannabis cultivation.
The subsequently enacted California Water Code Section 13149 in 2016 obliged the SWRCB, in consultation with the California Department of Fish and Wildlife, to develop both interim and long-term principles and guidelines for water diversion and water quality in cannabis cultivation. As a result, in 2017, the SWRCB adopted the Cannabis Cultivation Policy: Principles and Guidelines for Cannabis Cultivation (SWRCB 2017). The Cannabis Cultivation Policy's goal is to provide a framework to regulate the diversion of water and waste discharge associated with cannabis cultivation such that it does not negatively affect freshwater habitats and water quality.
A key element of the Cannabis Cultivation Policy is the establishment of environmental flow thresholds, below which diversions for cannabis irrigation are prohibited (fig. 4). During the dry season (April 1 to Oct. 31), no surface water diversions are permitted for cannabis cultivation. Diversions from surface water sources to off-stream storage are allowed between Nov. 1 and March 31. However, water may only be extracted from streams when flow exceeds the amount needed to maintain adult salmon passage and spawning and winter rearing conditions for juvenile salmon. Environmental flow requirements for the winter diversion season were determined by an approach known as the Tessmann Method (Tessmann 1979), which uses proportions of historical mean annual and mean monthly natural flows to set protective thresholds.
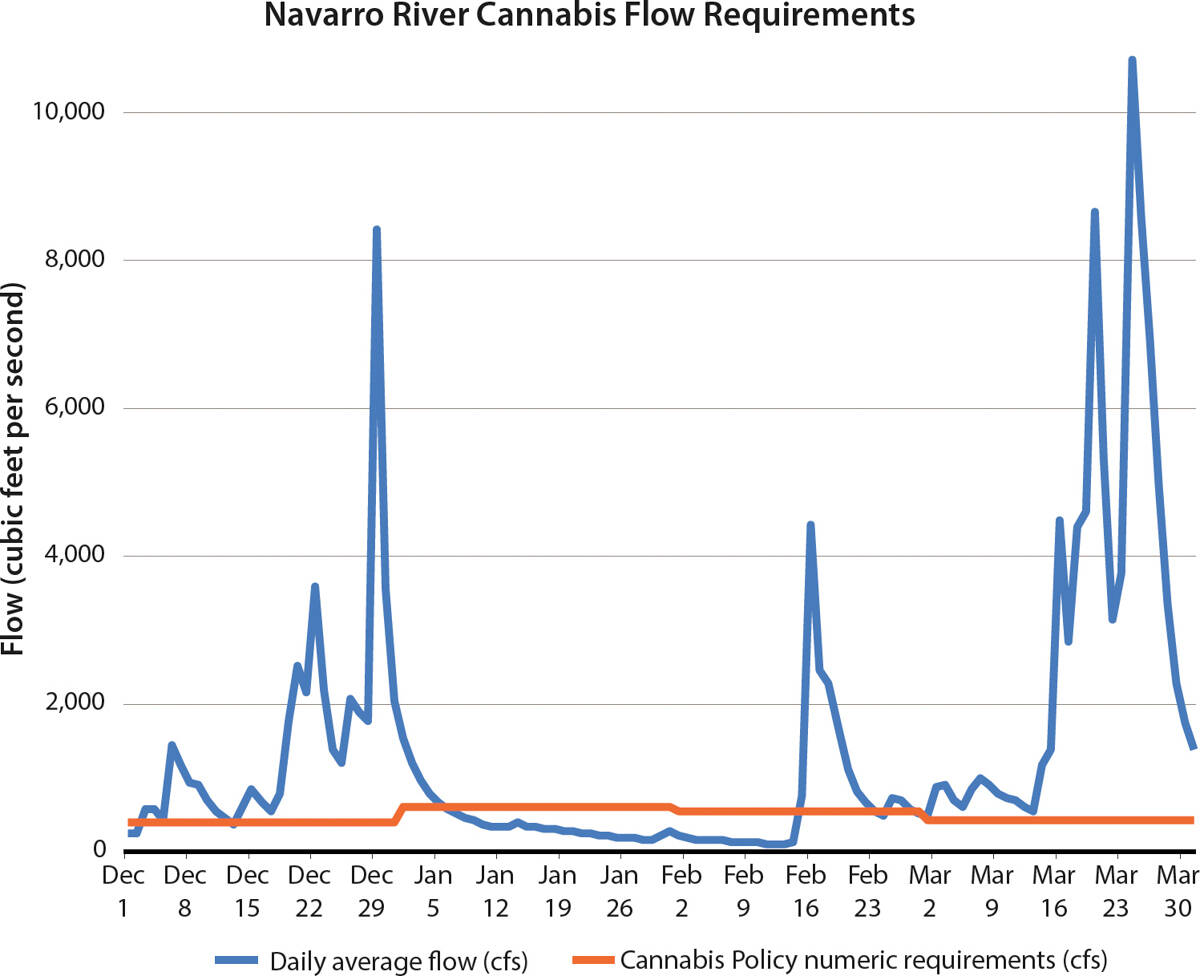
FIG. 4. Daily average flow, in cubic feet per second, for 2011 for the Navarro River at a USGS gauge (USGS 11468000 Navarro R NR Navarro CA) plotted against the Cannabis Cultivation Policy numeric requirements for diversion. For dates where there are flows above the orange line (e.g., March 1 to 31), diversion would be allowed. For dates where there are no flows above the orange line (e.g., Jan. 6 to Feb. 14), no diversion for cannabis cultivation would be allowed, to protect flows for salmonid passage, spawning and rearing.
Because flows are not measured continuously in most streams in California (TNC 2018a), including at most points of diversion, the Cannabis Cultivation Policy instead relies on using the predictions of natural flows from the models described above. Predicted natural mean monthly and annual flows are used by the SWRCB at compliance gauge points to calculate the Tessmann thresholds. Cannabis cultivators seeking a Cannabis Small Irrigation Use Registration permit from the SWRCB are assigned a compliance gauge near their operation and can legally divert water only when flows recorded at the gauge meet or exceed the Tessmann thresholds during the diversion season (fig. 4).
Next steps
The motivation for developing natural stream flow models and data rests on the premise that rivers and streams can be managed to preserve features of natural stream flow patterns critical to biological systems while still providing benefits to human society (e.g., water supply and hydroelectric power) (Arthington et al. 2006; Poff et al. 2010). For any stream of interest, balancing the needs of humans and nature requires an understanding of its natural flows, whether observed conditions are modified relative to natural patterns and what degree of modification harms its health.

The SWRCB's Cannabis Cultivation Policy establishes regulations and guidelines for water use by cannabis farms, including the timing, volume and rate of water diversions from rivers and streams. Environmental flow thresholds are based on the modeled predictions of natural flows at the nearest USGS gauge.
As noted in the examples above, this work has both direct and indirect implications for policy and decision-making. A database of natural stream flows developed by machine-learning models was used to help define cannabis policy to set minimum flow targets — a direct application of the technique. However, this work also influenced policy and decision-making in more subtle ways, including building awareness of shortcomings in the state's water rights accounting system. This form of engagement with government agencies and the broader public helps define the agenda early in the policy-making process (Jones 1984), although quantifying the degree to which our research contributed to policy outcomes such as SB 88 is difficult. The future impact of our work on environmental flow management remains unclear, but early engagement with state and federal agencies through the Environmental Flows Workgroup suggests that our flow modeling tools and data will have an important role in future policy development.
Recognizing there are likely other applications for our modeling tools, we have been working to make the data available to the public. Model predictions have now been generated for every stream in California, including values of mean monthly, maximum and minimum monthly flows and confidence intervals for California's 139,912 stream segments in the National Hydrography Database (Horizon Systems 2015). The dataset is being hosted by The Nature Conservancy at rivers.codefornature.org , where it can be accessed and downloaded through an application programming interface (API). A more dynamic spatial mapping tool has been developed to explore the data in individual rivers, watersheds or regions. An online interactive visualization tool is also available that allows a user to select one or several stream gauges and generate the corresponding hydrograph of observed and expected monthly flows (TNC 2018b).
An immediate next step for this project is to expand the natural flows dataset to include predictions of additional stream flow attributes that are relevant to environmental water management. This will support the Environmental Flows Workgroup's goal of defining ecological flow criteria in all rivers and streams of the state and can help inform a variety of programs including, for example, water transactions and stream flow enhancement programs.
Other direct applications of the natural flows data may be in hydropower project relicensing, which requires consideration of environmental flow needs. In addition, under the Sustainable Groundwater Management Act (SGMA), groundwater sustainability agencies (GSAs) are required to avoid undesirable results including depletions of interconnected surface water that have significant and unreasonable adverse impacts on beneficial uses of the surface water. Because environmental flow criteria have not been established for most streams in California, GSAs are rightfully confused as to the standards they are expected to meet. Statewide environmental flow criteria may help to define management targets required for SGMA implementation.
Looking to the future, society will continue to face challenges in balancing environmental protections with the demands of a growing population. Tools that make use of long-term monitoring data and modern computing power, such as the models described here, can help inform policy and management intended to achieve this balance.
Stream flow modeling tools inform environmental water policy in California

