


All Issues
Using Ecological Site Descriptions to make ranch-level decisions about where to manage for soil organic carbon
Publication Information
California Agriculture 76(2):85-92. https://doi.org/10.3733/ca.2022a0007
Published online May 04, 2022
PDF | Citation | Permissions
NALT Keywords
Abstract
Maintaining and enhancing soil organic carbon storage can mitigate climate change while promoting forage growth. California has adopted incentive programs to promote rangeland practices that build soil organic carbon. However, there is no standard framework for assessing the baseline level of soil organic carbon at the ranch scale. Here, we use the Ecological Site Description — a land-type classification system — to help ranch managers set priorities about where to implement practices to increase soil organic carbon. We measured baseline carbon stocks at 0 to 15 and 15 to 30 centimeters' depth across three ecological sites and two vegetation states (shrubland and grassland) at Tejon Ranch, California. We discovered increased levels of soil carbon at ecological sites in higher elevations, and more soil carbon in shrublands as compared to grasslands. Slope, elevation, and soil texture, as well as plant litter and shrub cover, were significant predictors of soil carbon. The Ecological Site Description framework can serve as an important tool to help range managers keep carbon in the soil and out of the atmosphere.
Full text
California's rangelands cover approximately 57 million acres of grasslands, shrublands, woodlands and deserts (FRAP 2018). As the most extensive land use type in California, rangelands play an important role in climate change mitigation by storing considerable amounts of soil organic carbon (SOC) below ground (Herrero et al. 2016; Sanderson et al. 2020; Schuman et al. 2002). In wildfire and drought-prone California, rangelands are considered more reliable for carbon storage because they secure most of the carbon in the soil instead of in aboveground plants that could potentially burn (Dass et al. 2018).

Intersection of shrubland and grassland at the foothills of Tehachapi Mountains, Tejon Ranch, Calif. The authors found that soil carbon significantly varied by ecological sites and vegetation states. Photo: Lina Aoyama.
The primary way that carbon is stored in the soil is as soil organic matter (SOM). Soil organic matter is a mix of decomposing plant and animal biomass, soil microbes and humus. Increasing SOM also enhances soil water-holding capacity and improves nutrient cycling, which can maintain or increase forage production (Conant et al. 2001; Herrick and Wander 1997). In California, as elsewhere, there has been a growing interest in improving rangeland management practices to increase the amount of SOC (Bradford et al. 2019; Byrnes et al. 2017; Carey, Gravuer et al. 2020).
The California Department of Food and Agriculture (CDFA)'s Healthy Soils Program is one of the programs that has been put in place to promote carbon storage. This program provides financial incentives through cost sharing and technical support for land managers to implement agricultural management practices that augment SOC or prevent erosion (CDFA 2016). Between 2017 and 2020, 604 landowners participated in this program, and the estimated greenhouse gas reduction was 109,089 tonnes CO2 eq/year (CDFA 2021). Recommended range management practices include planting oak trees, applying compost, and restoring riverbanks (Dahlgren et al. 1997; Matzek et al. 2018; Ryals et al. 2014).
Ideally, land managers should be able to easily find out the baseline amount of soil organic carbons on their lands and evaluate where to implement these practices. However, the amount of SOC varies greatly from place to place because of California's diverse climate, topography and soil conditions (Carey, Weverka et al. 2020). The Rangeland Monitoring Network is currently evaluating the variability in soil carbon storage potential across California rangelands (Carey et al. 2020b). There are SOC estimates by soil classification available on the USDA Web Soil Survey, but we lack a framework to relate these soil carbon estimates to specific landscape features at a ranch scale.
Ecological Site Description (ESD), developed and maintained by the USDA Natural Resource Conservation Service, is a land-type classification system that could facilitate ranch-level planning to manage for soil carbon. The ESD framework has primarily been used to manage vegetation on rangelands and forests, as well as to identify priorities for ecosystem benefits such as wildlife habitat, water quality and wildfire protection (Brown and Havstad 2016). This framework has not yet been extended to manage SOC stocks. An ecological site is defined as an area 24.7 to 247 acres with similar “physical properties [climate, soils, topography, underlying geologic material], potential vegetation, and responses to management that differ from other kinds of land” (USDA 2018). Each ecological site contains a state-and-transition (STM) model of vegetation states that is helpful in evaluating the effects of management actions or disturbances on the existing state of vegetation (Briske et al. 2005).
A ranch can have more than one ecological site. A related framework called Major Land Resource Area (MLRA) has been used by the National Resource Inventory Soil Monitoring Network to estimate SOC stocks at a national scale (Ogle et al. 2010; Spencer et al. 2012). However, these estimates are not precise enough for ranch-level decision making. While similar in concept, ESD units are smaller, more site-specific than MLRAs and may be more fitting for ranch-level planning.
The goal of this study is to explore the use of ESDs for ranch-level identification of potential priority sites for soil carbon sequestration projects. We used Tejon Ranch in Kern County, California, as a case study. Tejon Ranch is an ideal place to study ESDs because it has complex biogeographical features, and its range managers already use ESDs to manage forage for livestock (Spiegal et al. 2016). Studies connecting soil carbon to plant communities are scarce in Southern California (Booker et al. 2013; Carey et al. 2020b). To examine how soil carbon content is related to ESDs and vegetation states, we measured topsoil carbon in three ecological sites at different elevations and in two dominant vegetation states. We then explored how plant and soil characteristics were related to patterns in SOC stocks at ranch level.
Ecological sites on Tejon Ranch
Tejon Ranch (270,000 acres) is the largest contiguous, privately owned property in California, located 35 miles south of Bakersfield, California (latitude 34.935044°, longitude 118.670405°). We studied the northwestern portion of the ranch (50,000 acres) where the San Joaquin Valley and Tehachapi Mountains meet. Using the ESD framework, three ecological sites were defined based on slope, elevation and geology (fig. 1): Holocene Flats, Lower Miocene Hills and Upper Miocene Hills. Tejon Ranch has been grazed by livestock since the 1840s when the original Tejon Ranchos were created (Latta 1976). During the study, beef cattle (Bos taurus) grazed year-round while no grazers, including wildlife, were excluded from the study area.
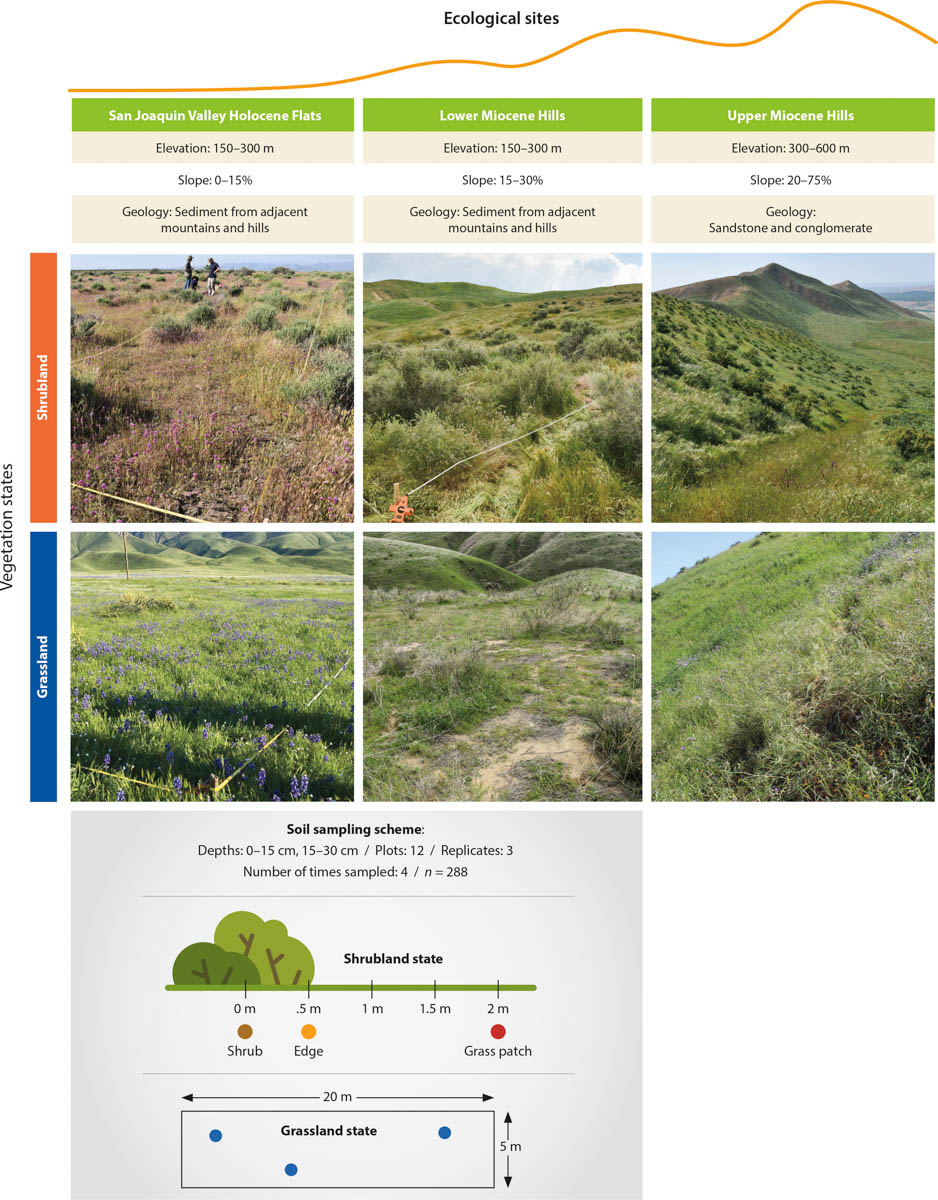
FIG. 1. Ecological sites along the elevational gradient of Tehachapi Mountain in Tejon Ranch, California: San Joaquin Valley Holocene Flats, Lower Miocene Hills and Upper Miocene Hills. The schematic is adapted from Spiegel et al. (2016). Each ecological site has two vegetation types: shrubland (top) and grassland (bottom). Two plots in each vegetation type are nested within each ecological site. Each plot was sampled for soil, cattle use and vegetation cover. Three replicates of soil cores were collected at each plot four times. Soils in shrubland plots were collected from three microhabitats: base of shrub, edge of shrub canopy (∼0.5 m from the base) and grass patch between shrubs (∼2 m from the base). Soils in grassland plots were collected randomly.
Dominant vegetation types in the study site were native shrubland and non-native annual grassland. Native shrub species commonly found in shrublands included cattle saltbrush (Atriplex polycarpa), Interior California buckwheat (Eriogonum fasciculatum var. polifolium) and Valley bladderpod (Peritoma arborea var. globose) (Aoyama et al. 2020). The grassland state was primarily composed of native and non-native annual forbs (e.g., Plagiobothrys canescens, Erodium cicutarium) and non-native annual grasses (e.g., Bromus diandrus, Avena barbata) (Spiegal et al. 2016).
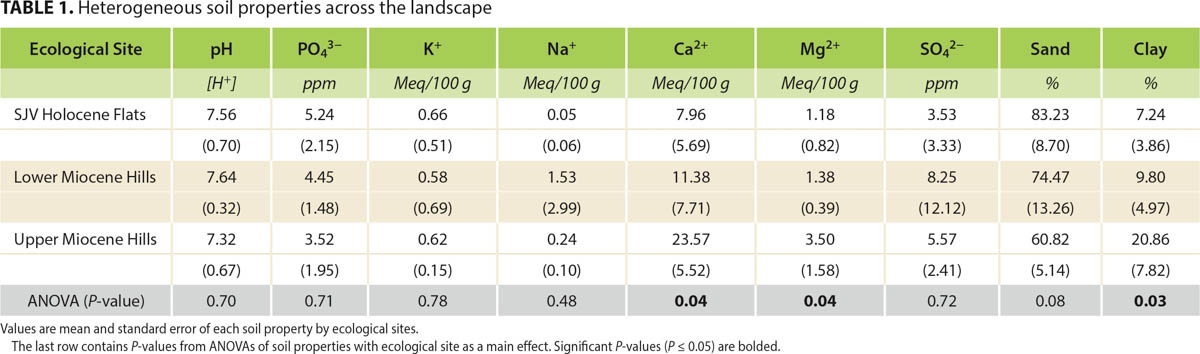
Soils were generally shallow Mollisols with bedrock encountered at approximately 30 centimeters' (cm) depth. Parent materials were sedimentary rocks from the Miocene and alluvium deposits from the Holocene (Dibblee 2008). Soil classification varied from Psamments-Xerolls complex (loamy sand), to Haploxerolls (sandy loam), to Chanac-Pleito complex (sandy clay loam) (USDA Web Soil Survey); the clay content increased with elevation (table 1).
We established twelve plots (65 feet by 16 feet) stratified by three ecological sites and two dominant vegetation types (grassland versus shrubland; fig. 1). We measured plant cover (shrub, herbaceous, litter, bare and other) and cattle use (evidence of herbivory, trailing, trampling, and old and new cattle manure) in each plot in March, June and October 2017 and March 2018. In addition to qualitative measures of cattle use, we set up motion-triggered camera traps on t-posts at heights of 1.5 meters on each plot to measure the number of cattle visits from March 2017 to March 2018.

Mary McDonnell, Dylan Stover and Tara Harmon (from right to left) taking turns to collect soil in a grassland plot, Tejon Ranch, Calif. Photo: Lina Aoyama.
To measure soil carbon concentrations and content, we sampled three replicate cores in each plot from two depths (0–15 cm and 15–30 cm) using a 5-cm diameter by 15-cm-long soil corer. We sampled the topsoil because it is the fraction of soil that is most accessible, where management has the most impact on soil carbon on an annual basis (Fontaine et al. 2007; Gregory et al. 2016; Syswerda et al. 2011). We sampled soils within grassland plots randomly; within shrubland plots, we stratified by microhabitats at the base of shrub main stem, at the edge of shrub canopy, and at a grass patch 2 meters from the shrub main stem. Cores were weighed fresh and after drying at 105°C for bulk density determination (see online technical appendix). We measured the concentration of SOM using the loss-on-ignition method and the concentration of SOC using the flash combustion method. We then converted concentration percentages to stocks (Mg/ha) by multiplying the values by bulk density and depth. SOC was positively correlated with SOM [log(SOC Mg/ha) = 0.68 * log(SOM Mg/ha) + 0.18; R2 = 0.41, P < 0.001].
Soil carbon by vegetation and ecological site
Our study explored the idea of using ESDs to provide a first approximation of baseline soil carbon at ranch level. In the study area on Tejon Ranch, average SOC stocks at 0–15 cm, 15–30 cm and 0–30 cm depths were 19.18 ± 0.90 Mg C/ha, 14.25 ± 0.67 Mg C/ha and 33.63 ± 1.49 Mg C/ha, respectively (table 2). These estimates were less than the statewide average (58 ± 4 Mg C/ha in 0–25 cm) reported by Silver et al. (2010). In contrast, these values are comparable to the statewide average (19.31 Mg C/ha in 0–10 cm) reported by Carey et al. (2020) and the 20.98 Mg C/ha for the A horizon in the Sierra Nevada foothills (Eastburn et al. 2017). From the linear mixed-effect models, we found that SOM and SOC significantly varied by ecological sites and vegetation states (table 3).

TABLE 2. Bulk density (g/cm3), soil organic matter (SOM) concentration (%), soil organic carbon (SOC) concentration (%), SOM content (Mg/ha) and SOC content (Mg/ha) by depth and spatial scale
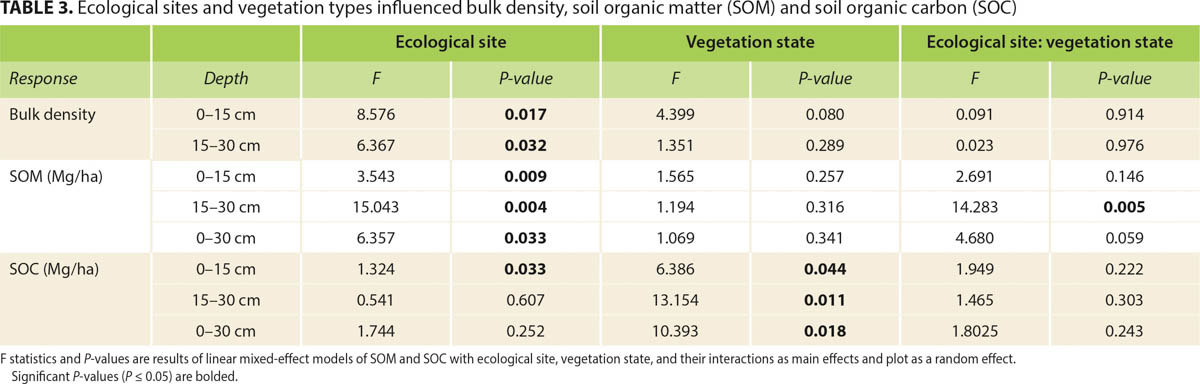
TABLE 3. Ecological sites and vegetation types influenced bulk density, soil organic matter (SOM) and soil organic carbon (SOC)
Both SOM and SOC stocks increased with elevation. They were higher in the Upper Miocene Hills than in the San Joaquin Valley Holocene Flats ecological sites (table 2). This effect of elevation could be due to a combination of time, soil type, and legacy of historical plant communities. Soils in the Miocene Hills were older than those in the Holocene Flats (Dibblee 2008), and thus had more time to accumulate soil carbon. High clay content found in higher elevation sites also may have contributed to higher soil carbon storage due to carbon-mineral associations (Kaiser et al. 2012). Additionally, oak savanna historically dominated the slopes of the Tehachapi Mountains (Twisselman 1967), which likely contributed to higher soil carbon inputs on the slopes than on the flats (Dahlgren et al. 1997; Koteen et al. 2011).
We also found that both SOM and SOC stocks were significantly higher in shrubland states compared to grassland states in the 0–30 cm profile (table 2), which corroborates the broad pattern found in California's rangelands that woody plants increase soil carbon pools (Silver et al. 2010). One possible explanation for this is that shrubs in semi-arid environments tend to have dense root mats in the top 30 cm to capture transient soil moisture (Chabbi et al. 2009; Swanston et al. 2005), which contribute to soil carbon storage. Another possible explanation is that litter fall from shrubs contributes significantly to near-surface soil carbon pools (Rau et al. 2009). These results suggest that grouping the vegetation states by dominant functional groups within ecological sites could be valuable for evaluating SOC stocks at ranch level.
Soil carbon varied across microhabitats
Given the wide range of sizes of ranches in California, the scalability of plot-level information is important. The spatial variability of SOC stocks within a ranch informs managers about the spatial scale at which they should aggregate the estimates of SOC from the USDA Web Soil Survey or their own soil sampling. The average coefficient of variance of SOC stocks in shrubland was higher (85.9) than that in grassland (38.67). This plot-level variability came from the microhabitat types (shrub base, edge of shrub canopy, grass patch between shrubs, and grassland). Estimates of SOC stocks in 0–30 cm were significantly higher at the base of shrubs than in grasslands (F3,119 = 7.924, P < 0.001; fig. 2). These results support the notion of shrubs acting as “islands of fertility” where soil carbon and nutrients are high relative to areas outside the canopy (Schlesinger et al. 1996; Schade et al. 2003; Schade and Hobbie 2005). The implication for SOC monitoring is that sampling more cores in shrubland than in grassland is necessary to capture the spatial variability in soil carbon within vegetation states.

FIG. 2. Soil organic carbon (SOC) stocks in 0–30 cm depth by ecological sites and microhabitats: shrub, edge of shrub canopy, grass patch between shrubs, and grassland. Horizontal bars are medians, boxes are the 25th and 75th percentile, and the whiskers are the maximum and minimum values. Dots represent outliers in the data.
Predictors of carbon across the landscape
Grazing management has been proposed as a means to sequester soil carbon (Byrnes et al. 2017). However, in the literature, cattle use is often not well quantified beyond presence-absence data. We used the standard qualitative assessment of cattle use (e.g., evidence of herbivory, fresh and old cow manure, trampling) and quantified the frequency and intensity of cattle use via camera traps. We found that none of these grazing use metrics meaningfully captured variation in SOM or SOC stocks. This result is in line with prior work showing that the influence of grazing on soil carbon is not significant in semi-arid rangelands of California (Biggs and Huntsinger 2021), especially in sandier soils (Silver et al. 2010; Stanton et al. 2018).
To identify important factors that predict soil carbon at ranch level, we examined the relationships between environmental variables and soil carbon stocks. We found that mean percent cover of litter and shrubs predicted SOM stocks in the 0–30 cm profile, while elevation, slope and soil calcium content predicted SOC stocks in the 0–30 cm profile (table 4). These were similar to the factors that influenced soil carbon at the regional level (Carey et al. 2020). Managers may use this information to group their ranch or management unit by ecological sites and vegetation states, and make decisions about where on the landscape they might want to implement carbon sequestration projects. For example, managers on Tejon Ranch could use the ESDs to prioritize conserving or restoring native shrubs in the high elevation Upper Miocene Hills ecological site. On other ranches, land managers might increase soil carbon by planting oak trees in ecological sites that have oak woodland as a reference state, or by applying compost in ecological sites with low baseline SOC stocks. This approach is compatible with range management in California that values multiple ecosystem services supported by the landscape rather than single-purpose management (Biggs and Huntsinger 2021).
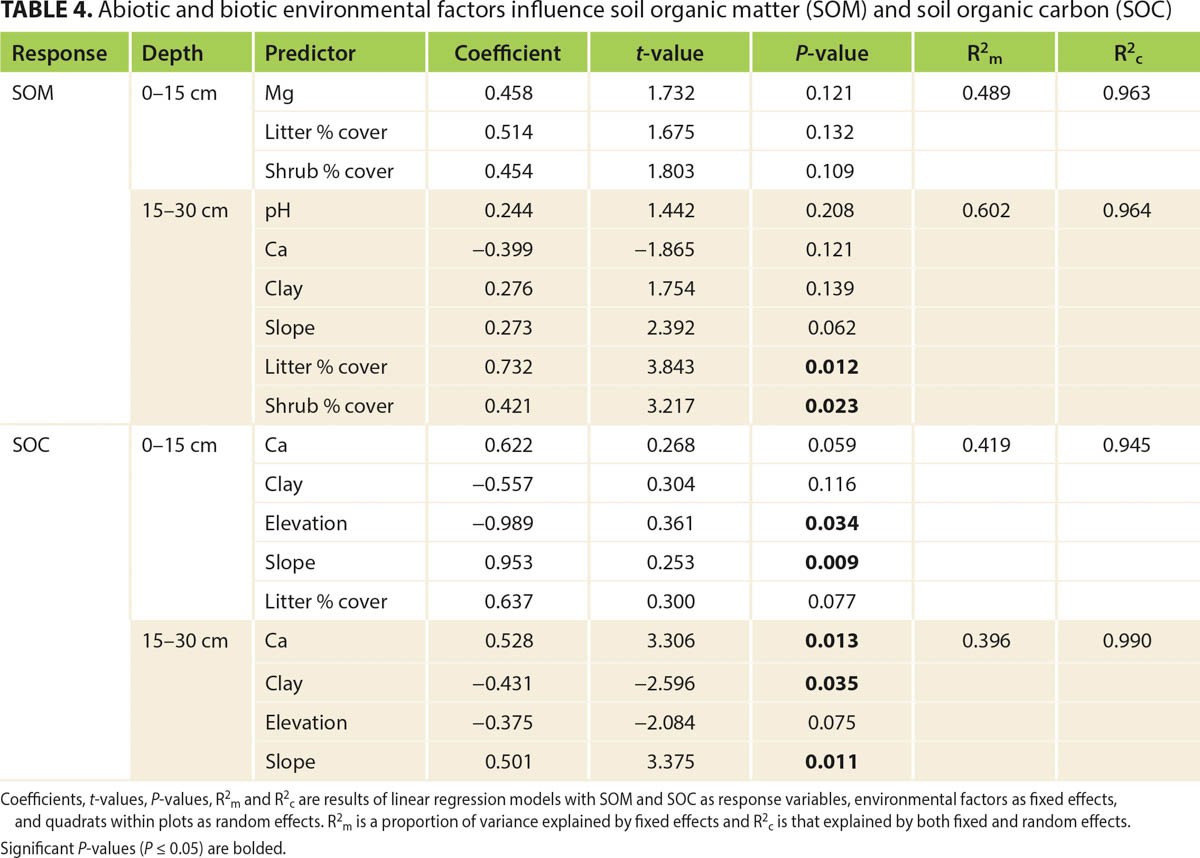
TABLE 4. Abiotic and biotic environmental factors influence soil organic matter (SOM) and soil organic carbon (SOC)
Deciding where to build up carbon
California is leading the way in building up carbon in the soil, where it helps hold nutrients and water, and out of the atmosphere, where it contributes to global warming. Planting oak trees on range land, adding compost, and maintaining rivers can increase carbon sequestration while improving forage. A simple framework to assess soil organic carbon stocks would make it easier for land managers to determine where to prioritize implementing practices that increase the amount of carbon stored in the soil. In this case study at Tejon Ranch, we demonstrated that Ecological Site Descriptions are a useful framework for assessing baseline soil organic carbon on diverse landscapes. We found that the amount of soil organic carbon differs by dominant vegetation functional groups and ecological sites. Environmental factors such as soil type, topography and vegetation cover are predictors of the amount of soil carbon.
ESDs are less developed in California than in other states. However, this framework can contribute to our understanding of the environmental factors that influence soil organic carbon. This should enable rangeland managers to focus soil management practices where they will do the most good.
Using Ecological Site Descriptions to make ranch-level decisions about where to manage for soil organic carbon

