


All Issues
Streamflow availability ratings identify surface water sources for groundwater recharge in the Central Valley
Publication Information
California Agriculture 72(3):162-169. https://doi.org/10.3733/ca.2018a0032
Published online September 19, 2018
PDF | Citation | Permissions
NALT Keywords
Abstract
In California's semi-arid climate, replenishment of groundwater aquifers relies on precipitation and runoff during the winter season. However, climate projections suggest more frequent droughts and fewer years with above-normal precipitation, which may increase demand on groundwater resources and the need to recharge groundwater basins. Using historical daily streamflow data, we developed a spatial index and rating system of high-magnitude streamflow availability for groundwater recharge, STARR, in the Central Valley. We found that watersheds with excellent and good availability of excess surface water are primarily in the Sacramento River Basin and northern San Joaquin Valley. STARR is available as a web tool and can guide water managers on where and when excess surface water is available and, with other web tools, help sustainable groundwater agencies develop plans to balance water demand and aquifer recharge. However, infrastructure is needed to transport the water, and also changes to the current legal restrictions on use of such water.
Full text
California's Central Valley produces more than 400 commodities and 17% of the U.S. total agricultural production (valued at nearly $54 billion in 2014) on just 1% of the land in the contiguous United States (CDFA 2015). The massive agricultural production in the Central Valley has resulted in critical groundwater overdraft, triggering state legislation in 2014 to require sustainable management of groundwater basins. There is growing interest in flooding fields during the winter with surplus surface water to recharge underlying groundwater basins; to make this happen, farmers first need to understand the physical distribution and occurrence of excess surface water, particularly the most promising source — high-magnitude streamflows.
Agriculture in the Central Valley consumes nearly 40% of California's annual water supply (surface water, groundwater and reused water developed for agricultural, environmental and urban uses), much of it during summer, when surface water supplies are relatively limited (Hanak et al. 2011). Across urban, environmental and agricultural sectors, groundwater accounts for 38% of the state's water supply during a normal year, reaching upward of 48% during a dry year (DWR 2015). The constant use of groundwater over the past century has led to a groundwater overdraft in the Central Valley of over 150 million acre-feet (Faunt 2009). During the 2012–2016 severe drought, groundwater depletion averaged 8.1 million acre-feet per year (Xiao et al. 2017).
UC Davis researchers developed a web tool that can be used by water managers to identify when — and in which watersheds — excess surface water is available for groundwater recharge.
With the passage of the Sustainable Groundwater Management Act (SGMA) in 2014, landowners are now required to implement groundwater sustainability plans by 2040 (SWRCB 2014). One increasingly considered approach to achieve groundwater sustainability is managed aquifer recharge, which places more water in groundwater aquifers than would otherwise naturally occur (Bouwer 2002; Brown and Signor 1974; Dillon 2005; Kocis and Dahlke 2017; Scanlon et al. 2016). Managed aquifer recharge uses a variety of water sources (e.g., river water, treated wastewater, desalinated water) and recharge methods (e.g., infiltration basins, injection wells, farmland) to replenish underlying aquifers (Dahlke et al. 2018; Dillon 2005; Russo et al. 2015).
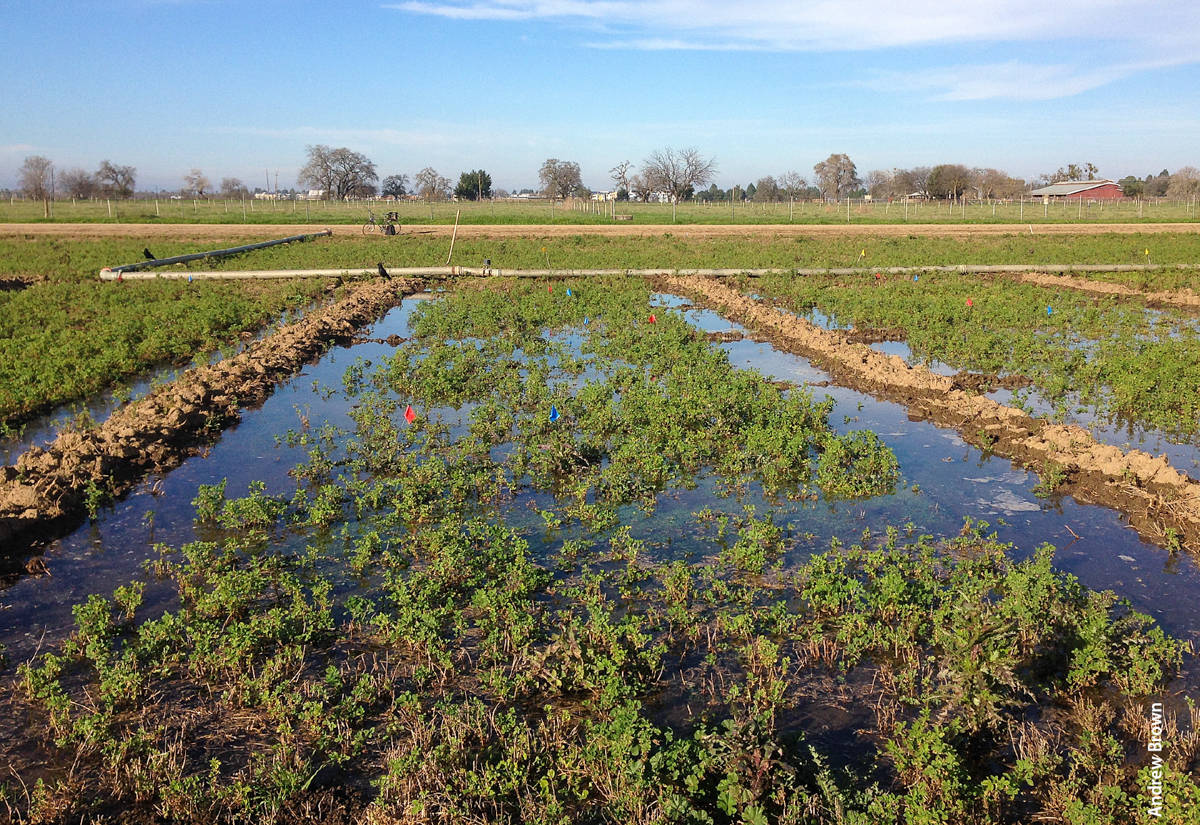
In recent years, there has been growing interest in flooding farmland with excess surface water in winter to recharge groundwater (Bachand et al. 2014; Dahlke et al. 2018; Kocis and Dahlke 2017). This approach, called on-farm recharge or agricultural groundwater banking, is capable of capturing large volumes of water, particularly from high-magnitude streamflows from storm events, which occur frequently during the rainy winter season. However, as groundwater sustainability plans are developed, tools are critically needed to understand the physical distribution and occurrence of such excess surface water flows.
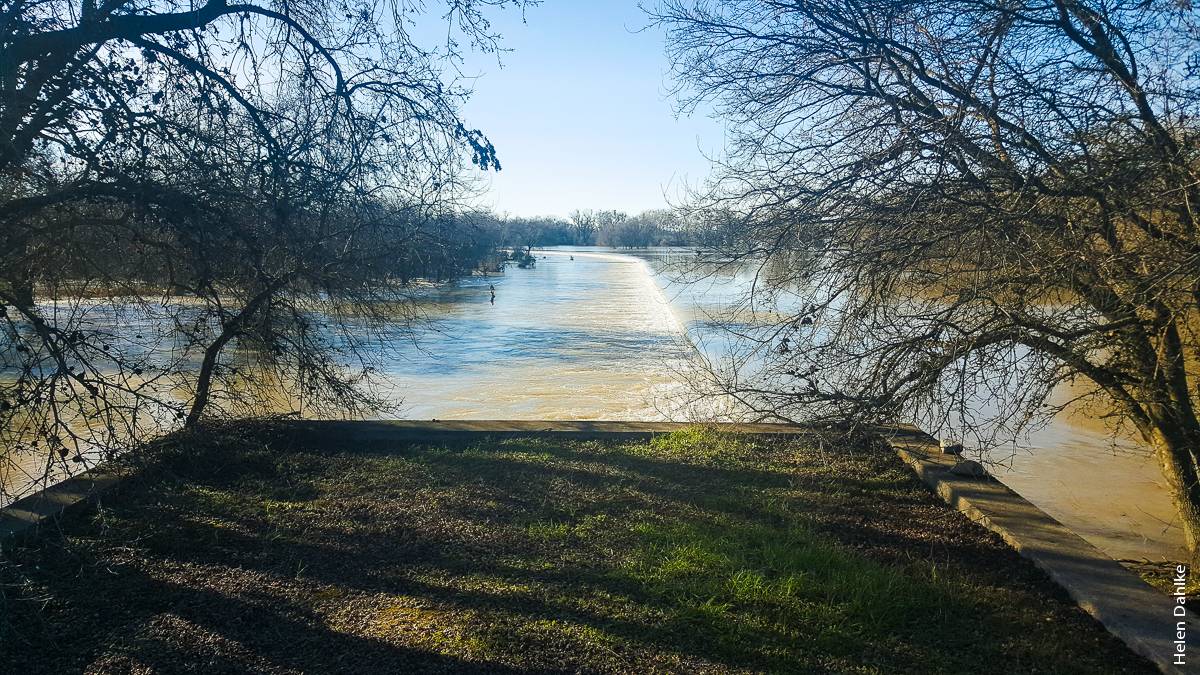
Although aquifer recharge can be conducted with any available water (e.g., stormwater, recycled water, desalination, surface water), high-magnitude streamflows (i.e., flood flows) likely represent the most accessible and largest source of water available for future expansion of groundwater banking (Harter and Dahlke 2014; Kocis and Dahlke 2017; Scanlon et al 2016). Demand for this water during the winter from the agricultural sector is relatively low. Reservoirs often make flood control releases of stored water in anticipation of large storm events, and these underutilized releases are expected to increase in frequency and magnitude in the coming decades as a result of climate warming (Das et al. 2013; Dettinger 2011; Hanak and Lund 2012; Yu et al. 2015). Additionally, despite overallocation of surface water by the State Water Resources Control Board (SWRCB) (Grantham and Viers 2014; Scanlon et al. 2016), there seems to exist an abundance of surface water during the winter and wet years, resulting in flood risk for much of the Central Valley (DWR 2016), which could potentially be reduced by capturing high-magnitude flows.
To evaluate high-magnitude streamflow for groundwater recharge efforts, we conducted a statistical analysis of historical daily streamflow records to provide insights into its physical availability and spatial distribution (Kocis and Dahlke 2017). Our goal was to create an index and web application of high-magnitude streamflow availability for groundwater recharge across the Central Valley, including a relative comparison of watersheds for different time periods (e.g., November to April), using the statistical analyses presented in Kocis and Dahlke (2017), that could be used by stakeholders for improved water resources management.
In 2014, California passed legislation mandating the sustainable management of groundwater basins. One approach for achieving sustainability, called on-farm recharge or agricultural groundwater banking, is capable of capturing large volumes of water, particularly from high-magnitude streamflows that occur during storm events.
Historical data on high-magnitude flows
We used historical daily streamflow data from United States Geological Survey (USGS) stream gauges in the Central Valley that had more than 50 years of data (93 sites total, visible in figure 1). Gauge sites were classified as impaired or unimpaired (i.e., unaffected by artificial diversions, surface water storage or other works of humans; Slack et al. 1994) by cross-referencing the sites with the Hydro-Climatic Data Network (HCDN). Thirteen of the 93 sites were unimpaired.
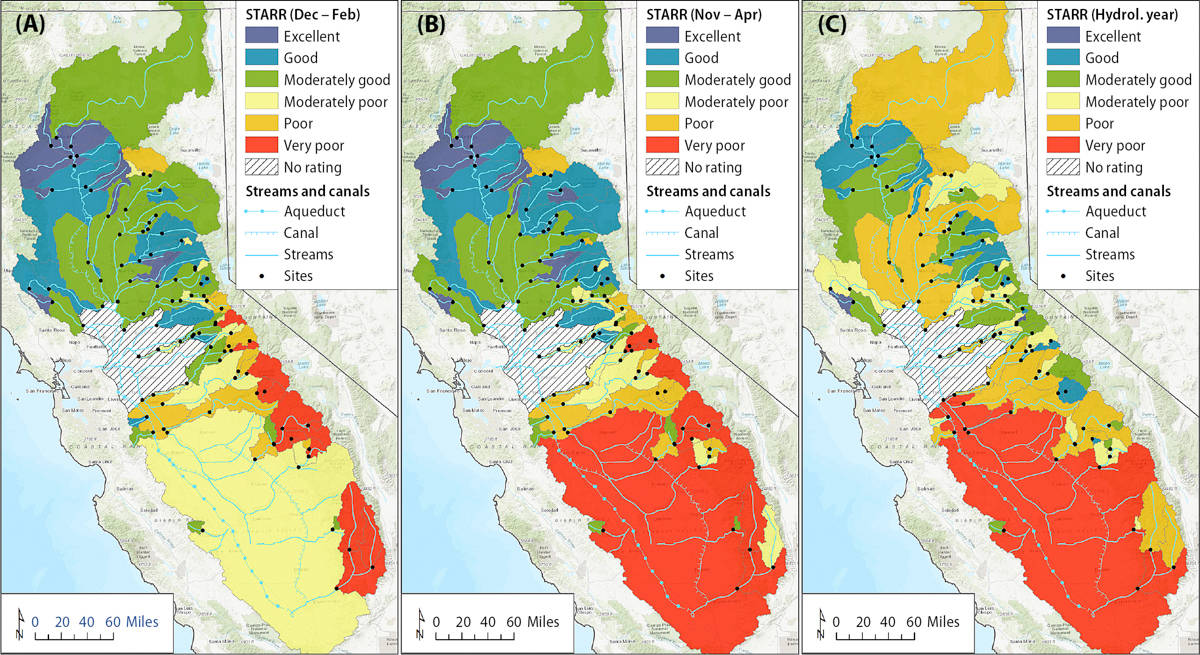
FIG. 1. Streamflow availability rating for recharge (STARR) for the Sacramento River Basin, San Joaquin River Basin and Tulare Lake Basin during December to February (A), November to April (B) and the hydrologic year (C).
This study used the 90th percentile of streamflow, calculated from the full record of available streamflow data, to designate what constituted a physically available high-magnitude flow. Most of the stream gauges are located downstream of large surface water reservoirs, thus they are representative of high-magnitude flows not captured and stored by surface water reservoirs (e.g., flood releases from reservoirs). Using the 90th percentile was motivated by several factors. First, while most surface water in California is legally allocated by the SWRCB, high-magnitude streamflow (i.e., runoff from big storm events including flood flows and reservoir releases for flood control) during the winter is often not. The SWRCB does not currently consider high-magnitude flows for permanent water right/permit applications or water planning in California, but estimates surface water availability purely on long-term average flow, which ignores a large fraction of the streamflow available during the winter rainy season. Second, the 90th percentile is often used by the USGS and the environmental flow community to designate flows as “much above normal,” or as “high” (Henriksen et al. 2006; Olden and Poff 2003; Richards 1990; USGS 2016). Hence, we adopted this threshold for our designation of high-magnitude streamflow.
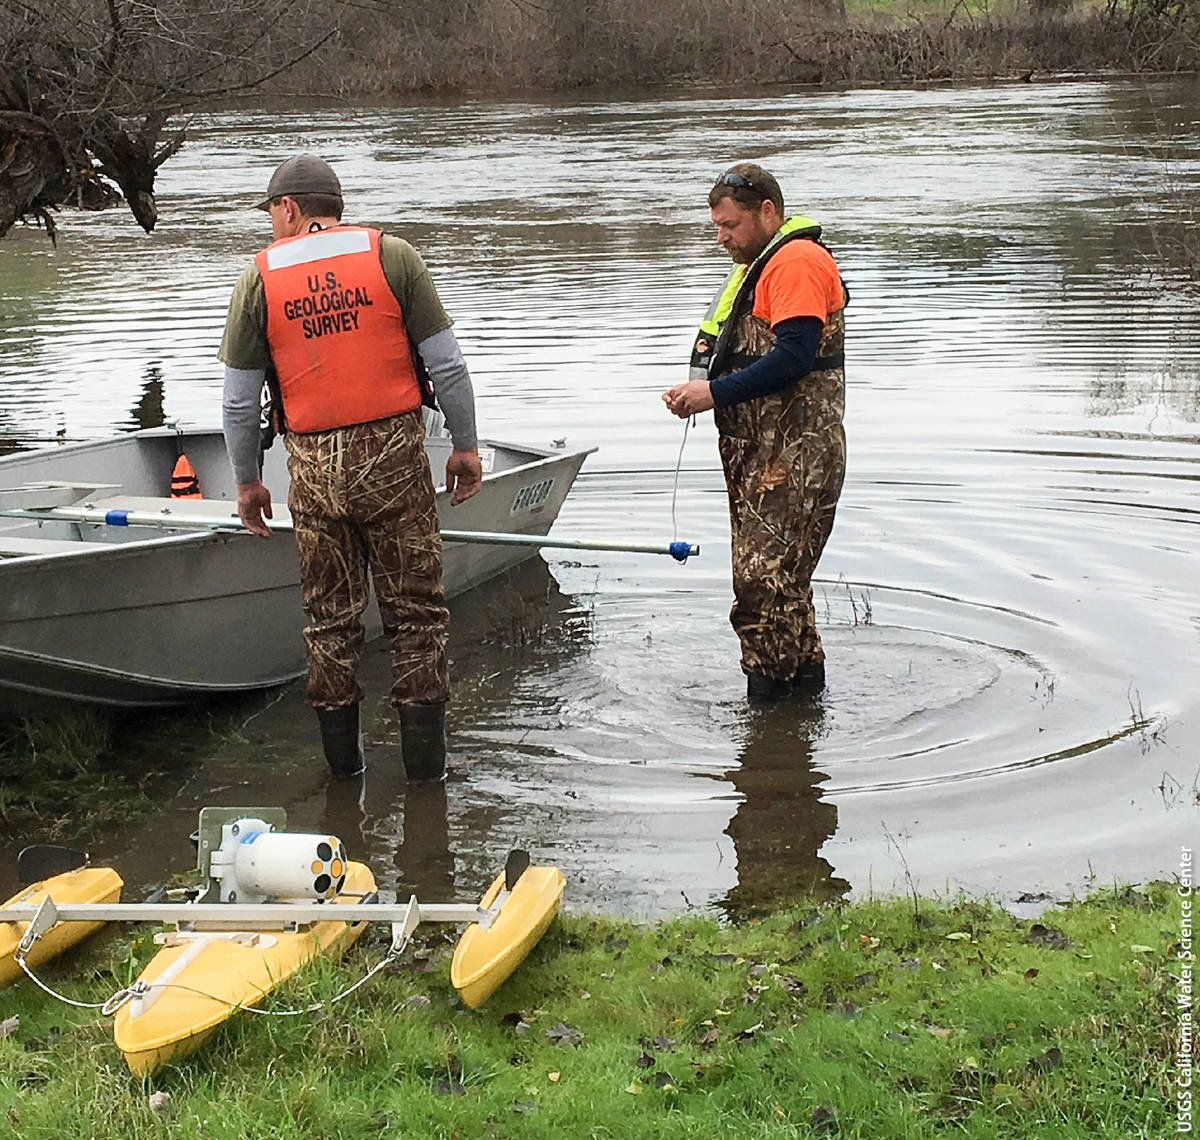
U.S. Geological Survey technicians prepare to go out to the center of the channel in the San Joaquin River below Friant Dam to get an accurate measurement of water flow during releases from the dam for flood control. Capturing such releases for aquifer recharge could potentially reduce winter flood risk in the Central Valley.
Streamflow metrics
For each stream gauge, five statistical metrics were calculated to inform on the availability of high-magnitude flows: magnitude, duration, timing, intra-annual frequency and interannual frequency (Kocis and Dahlke 2017). Magnitude is the total flow volume above the 90th percentile. Duration is the number of days above the 90th percentile. Timing is the day of the hydrologic year (DOHY) of the center of mass (COM) of flows above the 90th percentile; COM is defined by the day when 50% of the total flow volume above the 90th percentile in a given time period (e.g., winter) has passed.
Intra-annual frequency is the count of 1-day peaks that occur over the 90th percentile; a 1-day peak occurs on a day when the flow is higher than both the previous day and the next day. Interannual frequency is the fraction of years with flow above the 90th percentile. Not all years in the historical records have flow above the 90th percentile; therefore, these years were excluded from the calculation of the magnitude, timing, duration and intra-annual frequency metrics. This process is referred to as zero deflation.
Calculation periods
All metrics reflect the average value over specific calculation periods. Given potential changes in the flow regime due to the construction of dams or diversions within the watershed of each gauge, the metrics were calculated over two periods of record: (1) the full record of available data and (2) the record of data since the most recent impairment (i.e., post-impairment period). For the Sacramento River Basin and the San Joaquin Valley (comprised of the San Joaquin River Basin and the Tulare Lake Basin), the post-impairment periods of record are 1970 to 2014 and 1989 to 2014, respectively.
Flow metrics were also calculated for different time periods and the five water year types (critical, dry, below normal, above normal and wet) defined in the San Joaquin Valley Index and Sacramento Valley Index (SWRCB 1995, Null and Viers 2013). Time periods were the hydrologic year (Oct. 1 to Sept. 30), the winter rainy season (November to April), the winter season (December to February) and each month between November and April.
Streamflow availability ratings
We developed a streamflow availability rating for recharge (STARR) based on three of the five high-magnitude streamflow metrics that emerged to be the most indicative for the availability of excess surface water from high-magnitude flow: magnitude, duration and interannual frequency.
STARR was calculated using an empirical weighting method, the rank-ordered centroid weighting method (Barron and Barrett 1996), that combines the weighted, ranked equal-area ratings of the magnitude, duration and interannual frequency metrics for the contributing watershed of each stream gauge. For the watersheds of the 93 stream gauges analyzed by Kocis and Dahlke (2017), STARR was determined for three time periods: the hydrologic year, November to April, and December to February.
Watershed scale
The STARR index displays the high-magnitude flow availability (developed from point gauge locations) for groundwater recharge at the watershed scale. The upstream contributing watershed was derived for each of the 93 stream gauges using the 1-arc-second National Elevation Dataset (USGS 2009). Watersheds were delineated in ArcGIS with a drainage area threshold (flow accumulation threshold) equal to 1% of the maximum flow accumulation. If several stream gauges exist along the same river, the contributing areas were visually overlaid such that smaller upstream watersheds remain on top of larger downstream watersheds. For accuracy, the upstream drainage areas were compared to those provided by USGS.
Four-step process
The STARR calculation process included four steps:
First, three spatial flow metrics, V/A, D/P and YWF, were developed for the watershed of each of the 93 stream gauges. The magnitude, V (in cubic kilometers), was standardized by the watershed area, A (square kilometers). The duration, D, was standardized by the number of days in the calculation period, P (e.g., 90 days from December to February), and the interannual frequency (fraction of years with high-magnitude flow) was left unchanged and notated as YWF.
Then, using an equal-area classification method, the spatial flow metrics were scored from 1 to 6. First, values in each metric were sorted from smallest to largest. Next, the score was determined relative to other watersheds in the study region, the Central Valley, by breaking the metric values into six equal-area classes with the same number of watersheds in each class.
Next, the rank-ordered centroid method (Barron and Barrett 1996) was used to develop an additive multi-attribute model for the three spatial flow metrics to calculate the final numeric STARR value. The model allows developing an empirical formula to calculate the STARR and determining weighting coefficients for the three spatial flow metrics considered in the formula based on their relative importance as outlined in Barron and Barrett 1996. In this formula (see equation (1) below), the interannual frequency was given the highest weight (considered the most important factor), duration was given the lowest weight (considered the least important factor, of the three) and the weight on magnitude was chosen to fall in between. The resulting STARR formula was
(1) STARR = 0.611 × ranked(YWF) + 0.277 × ranked(V/A) + 0.111 × ranked(D/P)
The final STARR ratings were calculated by entering the first round of values from step 2 into equation (1). Using an equal-interval ranking, the resulting numeric STARR values (ranging from 1 to 6) were then split into six equal intervals corresponding to the STARR classes (e.g., 1 < = numeric STARR < 1.83 is very poor). The numerical STARR values were categorized as very poor, poor, moderately poor, moderately good, good and excellent.
Watersheds with a high STARR (i.e., excellent rating) are generally characterized by large high-magnitude flows that persist for a high number of days and recur, on an interannual basis, with high frequency. Conversely, watersheds with a low STARR (very poor rating) generally contribute less high-magnitude flow than other watersheds within the study area, and the flow occurs only for a very short period of time each year, and recurs, on an interannual basis, with low frequency. A high STARR value corresponds to watersheds that have excellent physical surface water availability relative to other watersheds in the Central Valley, while a low STARR value corresponds to watersheds that have very poor physical surface water availability.
Optimal month rating
We used the STARR index to also develop a decision support tool for the optimal time when high-magnitude streamflow is available for recharge across the Central Valley. We developed the optimal month rating (OMR) to answer the question: “For any watershed, what is the month in which most high-magnitude flow is physically available?” The OMR identifies the month within a time period of interest that provides the greatest water availability and highest flow reliability (longest duration, greatest frequency and/or largest volume) and is determined by estimating the highest monthly STARR value for each watershed in a given time period (e.g., November to April).
OMR is determined in a similar fashion to STARR, but instead of comparing one watershed to another watershed, OMR compares the water availability in a single watershed from one month to another month within a given time period. OMR is determined for two time periods: December to February and November to April.
Streamflow availability for recharge highest in Sacramento River Basin
STARR was calculated for the Sacramento River Basin, the San Joaquin River Basin and the Tulare Lake Basin — an area of over 35.4 million acres (about one-third of the land surface of California) (fig. 1). Kocis and Dahlke (2017) estimated that in an average year with high-magnitude flow (e.g., years when streamflow exceeds the 90th percentile flow), between November and April approximately 1.88 million acre-feet (2.31 cubic kilometers) and 0.97 million acre-feet (1.2 cubic kilometers) of high-magnitude flow are exported from the Sacramento River Basin (USGS site 11447650) and the San Joaquin River Basin (USGS site 11303500), respectively, to the Sacramento–San Joaquin Delta.
Most of the watersheds with the greatest high-magnitude flow availability are in the Sacramento River Basin, which generally receives more precipitation than the southern Central Valley. The interannual frequency indicated that those watersheds carry high-magnitude flows on average in 7 to 9 out of 10 years, while watersheds in the San Joaquin River Basin and Tulare Lake Basin carry high-magnitude flows on average in only 2 to 5 out of 10 years (Kocis and Dahlke 2017).
STARR shows distinct patterns for the high-magnitude flow availability in winter and during the hydrologic year (fig. 1; table 1). Between December and February, 30 of the 93 watersheds have excellent or good streamflow availability, an area of over 6.3 million acres, or 17.8% of the study area (table 1). These watersheds are primarily in the Sacramento River Valley and the northern San Joaquin Valley and include mainly unimpaired tributaries from the Coast Ranges and the Sierra Nevada (fig. 1A). Watersheds with poor or very poor December to February STARR are primarily High Sierra watersheds, where streamflow availability during winter is limited because most precipitation falls as snow and only becomes snowmelt runoff during the spring and early summer. In contrast, the Tulare Lake Basin is ranked moderately poor. Here, streamflow availability is limited, occurring only during winter (December to February) when rainfall produces runoff, or flooding during wet years.
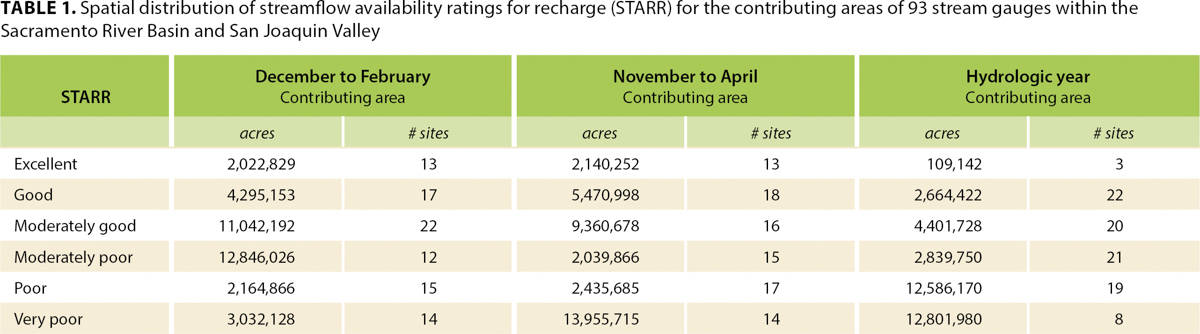
TABLE 1. Spatial distribution of streamflow availability ratings for recharge (STARR) for the contributing areas of 93 stream gauges within the Sacramento River Basin and San Joaquin Valley
For the November to April period, the distribution of watersheds with excellent and good streamflow availability for recharge (fig. 1B, table 1) is similar to that for the December to February period. Most of those watersheds are in the Sacramento River Basin, occupying about 42% of the basin. Streamflow availability for recharge in the San Joaquin River Basin and Tulare Lake Basin is predominately moderately poor to very poor, with a few moderately good ratings on the west side of the San Joaquin River. Most of the valley floor of the Tulare Lake Basin has very poor streamflow availability for groundwater recharge.
During the hydrologic year (Oct. 1 to Sept. 30), streamflow availability for groundwater recharge varies between good and very poor throughout the Central Valley (fig. 1C). The Tulare Lake Basin generally has very poor excess streamflow availability; high-magnitude streamflow availability in the largest tributaries to the San Joaquin River from the Sierra Nevada is either poor or moderately poor. The low ratings can be attributed to the low interannual frequency at which high-magnitude flows occur and the low overall magnitude of those flows compared to the size of the watersheds.
Within the Sacramento River Basin during the hydrologic year, most watersheds below major rim reservoirs, including the upper Sacramento and Feather rivers, are rated poor or moderately poor, while most unimpaired streams and headwater catchments are rated good or moderately good. Unimpaired watersheds in the Sacramento River Basin lack major control structures (e.g., surface reservoirs, major diversions) and therefore carry high-magnitude flow for longer periods throughout the winter and, in some cases, the shoulder months (September to November, March to July), which results in good and moderately good STARR for the hydrologic year. For most of the impaired streams in the Sacramento River Basin, the high-magnitude flow availability in spring, summer and fall is regulated or prevented by major reservoirs.
Optimal months for recharge identified
In the Sacramento River Basin, the OMR indicates that for the December to February period, February is the ideal month for groundwater recharge in terms of streamflow availability for recharge (fig. 2). In the San Joaquin River Basin and Tulare Lake Basin, the ideal month for groundwater recharge is January for the December to February period, and December for some of the Sierra Nevada watersheds. During December to February, water availability stems primarily from rainfall, not snowmelt.

FIG. 2. Optimal month rating (OMR) for groundwater recharge based on high-magnitude streamflow availability in December to February (A) and November to April (B).
Excess surface water availability that includes snowmelt is reflected in the November to April OMR (fig. 2B), which identifies March as the ideal month for the San Joaquin River Basin and Tulare Lake Basin, and February, again, as the ideal month for the Sacramento River Basin. In the Sierra Nevada tributaries, April is the ideal month for streamflow availability, clearly indicating snowmelt as the main source.
Web tool for decision-making
The streamflow availability metrics (magnitude, timing, duration, interannual and intra-annual frequency of flow above the 90th percentile) and STARR and OMR maps are available as an interactive web tool (fig. 3) at http://recharge.ucdavis.edu/STARR . More information on it is provided in the technical appendix.

FIG. 3. Interactive, web-based map displaying the magnitude, timing, duration, interannual and intra-annual frequency of high-magnitude flows for the 93 sites analyzed within the Central Valley. Users can click on a site of interest on the map, which loads a bar graph for the selected high-magnitude streamflow metric, record length and time period. In the example shown above, users can see the average high-magnitude flow volume for the stream gauge at the Mokelumne River below Camanche Dam for each month between November and April and each water year type. The displayed flow volumes are based on estimates considering the full record of streamflow data available for that site.
Web-based decision support tools have proven useful in supporting farmers and landowners in decision-making processes. For agricultural groundwater banking, several such tools help identify suitable on-farm recharge locations. For example, the Soil Agricultural Groundwater Banking Index (SAGBI) ( casoilresource.lawr.ucdavis.edu/sagbi/ ) developed by O'Geen et al. (2015) recommends recharge locations based on soil suitability by considering five factors: soil profile percolation rate, root zone residence time, chemical limitations, topography and soil surface conditions. Crop suitability research for groundwater recharge is available for alfalfa (Dahlke et al. 2018) and almonds (Volder et al. 2016). The California Department of Water Resources recently published a detailed land use survey of cropland parcels within California, distinguishing 12 different land use classes ( gis.water.ca.gov/app/CADWRLandUseViewer/ ). This land use survey represents the most accurate (i.e., in terms of cropping system and spatial accuracy) land use and land cover dataset available to date for water resources planners for water budget calculations.
Our STARR web tool provides another layer of information that growers, landowners and water district managers can use to plan agricultural groundwater banking programs as part of their operations or to develop groundwater sustainability plans. We envision the STARR web tool being used at a local scale with other tools. For example, to identify suitable recharge areas within groundwater management areas, SAGBI could be used to identify areas with suitable soils, land use surveys could be used to identify areas with suitable crops, the eWRIMS (Electronic Water Rights Information Management System) database could be used to identify current surface water right holders, and infrastructure maps could be used to identify areas with the necessary conveyance infrastructure. The intersection of soil suitability, crop suitability, land use, conveyance infrastructure, legal water availability, and physical water availability (STARR) is the ideal location to conduct an agricultural groundwater banking project.
A recent survey conducted by the Public Policy Institute of California indicates that many water district managers cite infrastructure capacity constraints as a major barrier to the expansion of existing recharge programs (Hanak et al. 2018); many water districts and counties currently lack the infrastructure to divert high-magnitude flows (DWR 2017; O'Geen et al. 2015). The STARR web tool can be used to advise the planning and expansion of water conveyance systems at district and watershed scales to deliver water to suitable recharge lands, since it provides detailed information on the volumes and timing of when high flows are available. Comparing peak flow volumes to the capacity of existing conveyance systems allows water managers to determine the need for expansion or new construction of conveyance infrastructure.
Transfers from north to south
As indicated in figure 1, streamflow availability for groundwater recharge in the Central Valley displays a clear north-south gradient, with highest availability in the Sacramento River Basin. The availability of excess surface water is spatially disparate to agricultural land suitable for groundwater recharge. The most highly rated soils (with a SAGBI rating of excellent, good or moderately good) are located on the broad alluvial fans on the east side of the Central Valley (near the Mokelumne, Stanislaus, Merced, Kern and Kings rivers); in the Sacramento Valley, suitable land is limited to narrow alluvial bands along the Sacramento River and its major tributaries.
This spatial disparity in water availability and suitable recharge locations seen in nearly every visualization of STARR suggests long-term investment is needed in statewide water projects that could convey excess surface water from the Sacramento River Basin to suitable land in the southern Central Valley. Water transfers would allow balancing the critically overdrafted Kern, Kings, Tule, Kaweah, and Tulare Lake groundwater basins, where there is a generally high water demand (DWR 2016).
OMR indicates that water transfers from the Sacramento River Basin, where high-magnitude flow is available as early as November, to the San Joaquin and Tulare Lake Basins could be made early in the winter, when crops such as alfalfa and almonds are still dormant and before local flood flows from the High Sierra become available in March or April. Such water transfers would allow local groundwater sustainability agencies to address many of the undesirable results listed in SGMA, including land subsidence, lowering of the water table and groundwater storage depletion.
Additionally, knowledge that in the San Joaquin River Basin and Tulare Lake Basin most high-magnitude flow originates from spring snowmelt could motivate changes in reservoir operation policies; more water from reservoirs could be released during late fall or early winter for groundwater recharge to create increased flexibility for flood management of more intense precipitation events (Hanak and Lund 2012; Maurer and Duffy 2005).
Water rights, legal use of flows
Given that groundwater recharge is not considered a “beneficial use” in the California Water Code (California Water Code 2017), the legal use of the high-magnitude flows calculated in this study remains questionable for the near future. Landowners and water districts planning new groundwater recharge programs will likely have to obtain a new surface water right or change an existing water right.
The SWRCB currently estimates the water availability for a new appropriative surface water right using a method similar to the rational runoff method (Kuichling 1889; SWRCB 2001), which estimates the average annual unimpaired runoff at a diversion point of interest considering only the contributing area, average annual precipitation and the land use within the watershed (SWRCB 2001). This conservative method is used to ensure that there is “unappropriated water available to supply the applicant” (Water Code section 1375(d)), while accounting for “the amounts of water needed to remain in the source for protection of beneficial uses” (Water Code section 1243), such as recreation and the preservation of fish and wildlife habitat.
However, as indicated by Grantham and Viers (2014), in many areas of California, mainly the Central Valley, surface water has been overallocated to the extent that surface water rights account for nearly 10 times the natural surface water supplies. This, theoretically, precludes any additional appropriation of surface water. Yet, over-appropriation is, to a large extent, an artifact of the water availability analysis conducted by the SWRCB, which is based on average annual flows and does not take into account the large variability in streamflow. Hence, new permitting approaches that would legally permit the use of high-magnitude flow for groundwater recharge are needed.
Allowing a water right permit for the diversion of “high flow” could bridge the gap between policy requirements (such as the need for a temporary or permanent water right for surface water diversions), legal requirements (for stream reaches that are already legally over-appropriated) and physical surface water availability for groundwater recharge (in the form of flood flows during above normal or wet years). Such permits would have to agree on legally acceptable high flow thresholds at the point of diversion to ensure that high flow diversions for groundwater recharge do not cause injury to existing water rights holders or environmental flow considerations.
Permits could be restricted to the winter period, from November to March, and define strict in-stream flow requirements (e.g., the passage of channel-forming flows or fall flushing flows for sediment and nutrient transport) (see Kocis and Dahlke 2017 for a more detailed discussion of these considerations). Solving these regulatory challenges to groundwater recharge, along with a potential expansion of infrastructure capacity, will open new avenues to greater water security in California.
Streamflow availability ratings identify surface water sources for groundwater recharge in the Central Valley

