


All Issues
Agricultural burning monitored for air pollutants in Imperial County; exposure reduction recommendations developed
Publication Information
California Agriculture 66(3):85-90. https://doi.org/10.3733/ca.v066n03p85
Published online July 01, 2012
Abstract
Air pollutants, notably particulate matter (PM) with aerodynamic diameter smaller than 2.5 micrometers (PM2.5), are emitted during agricultural burning. We studied a winter period in Imperial County when predominantly bermuda-grass stubble was burned. At four locations, PM2.5 levels were 23% higher from 4 p.m. on burn days to 8 a.m. the following morning than on days when there were no burns. On days when a burn was within 2 miles of a monitoring site, concentrations were 7 to 8 micrograms per cubic meter higher than on days when burns were farther away; measured levels lowered air quality, which potentially approached moderate. In monitoring five specific burns, we found that the levels of particulate matter with aerodynamic diameter smaller than 10 micrometers (PM10) were highly elevated and potentially hazardous directly downwind of one field. In addition, PM2.5 was composed primarily of carbon, and levels of naphthalene, a respiratory carcinogen, were elevated compared with upwind samples. In interviews, most community leaders, residents and farmers thought health educational efforts were needed. As a result, we developed fact sheets and have made recommendations for further actions to reduce people's exposure to smoke from agricultural burning.
Full text
Burning fields to remove crop stubble, weeds and pests occurs worldwide, and California's estimated emissions from the burning of crop residue ranks fifth nationally (McCarthy 2011). These emissions potentially contribute to particulate matter (PM) levels in the San Joaquin Valley, which often exceed standards for ambient air each season of the year (Ngo et al. 2010). Studies have documented thousands of chemicals in smoke; they can exist in gas, liquid and solid form. During burning, plant matter breaks apart and gases condense on particles or form particles. Most particulate matter in smoke is smaller than 2.5 micrometers (μm) in diameter (PM2.5) and can be transported over long distances (Naeher et al. 2007). The California Air Resources Board (CARB) estimates annual tons of particulate matter and gases emitted from field, orchard and weed burning for California counties (CARB 2009); their estimates are derived from burns of crop residue in a laboratory (CARB 2005b).
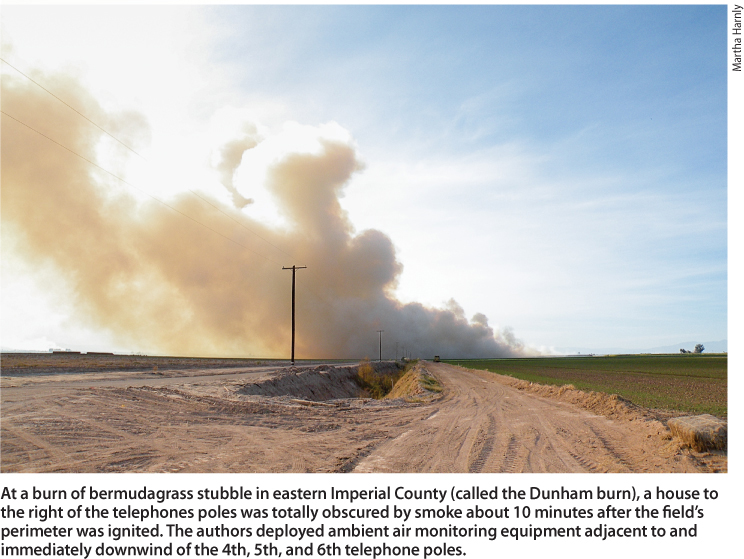
At a burn of bermudagrass stubble in eastern Imperial County (called the Dunham burn), a house to the right of the telephones poles was totally obscured by smoke about 10 minutes after the field's perimeter was ignited. The authors deployed ambient air monitoring equipment adjacent to and immediately downwind of the 4th, 5th, and 6th telephone poles.
Studies have documented emissions of 14 semivolatile polycyclic aromatic hydrocarbons (PAHs), the most abundant of which is naphthalene (US EPA 1996). A respiratory carcinogen (OEHHA 2004), naphthalene is predominantly (88% to 99%) found in the gas phase of air sampling, with the remainder measured in the particulate phase (Kakareka and Kukharchyk 2003). Few ambient air monitoring studies have been conducted in the United States during agricultural burns, either adjacent to burns or in towns and communities (Jimenez et al. 2006; Kelly et al. 2003).
Educational efforts for the general public have mostly focused on smoke from wildfires (US EPA 2003) and have included public health recommendations for those exposed to elevated particulate matter and visibility guidelines for those air levels (Lipsett et al. 2008). CARB has also distributed a lengthy educational pamphlet for farmers (CARB 1992). However, it was unknown whether health educational outreach efforts specifically targeting agricultural burning were needed.
Study area
Particulate matter emissions from field burning in Imperial County — a rural desert county in California's southeast corner — rank among the highest for any county in the state (CARB 2009). The agricultural area of Imperial County is an irrigated desert valley, where a variety of crops including vegetables, hay and grain are grown (fig. 1). Fields of bermudagrass, which is grown both for hay and seed, are burned primarily in the winter, while wheat stubble is burned during the summer.
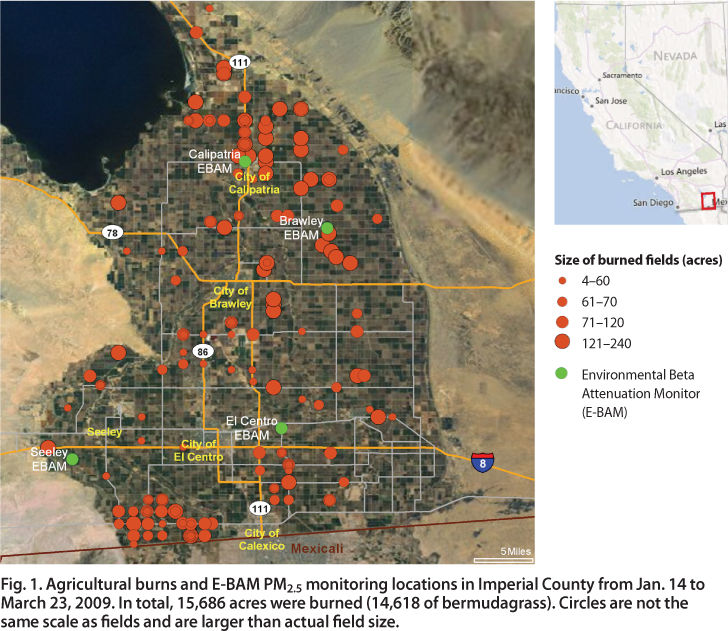
Fig. 1. Agricultural burns and E-BAM PM2.5 monitoring locations in Imperial County from Jan. 14 to March 23, 2009. In total, 15,686 acres were burned (14,618 of bermudagrass). Circles are not the same scale as fields and are larger than actual field size.
Less than 3% of homes in Imperial County use wood as a house heating fuel (US Census Bureau 2009). During the winter when night temperatures drop, inversions commonly occur; cooler ground-level air, including pollutants, are trapped near the Earth's surface by an upper layer of warmer air. For fields to be burned, the Air Pollution Control District requires that the estimated inversion layer must be at 3,000 feet or higher, and the burn must be initiated between 10 a.m. and 3 p.m. Farmers who have applied for burn permits are usually notified by the district the day before the targeted burn date that their fields may be burned. Thus, our air monitoring studies required methods that could be rapidly deployed. Our methods and results are described in greater detail in a report to the funding agency (Harnly et al. 2011).
PM2.5 during a burn season
We selected three schools and one church (fig. 1) based on their proximity (within 2 miles) to burns in previous years and installed portable Environmental Beta Attenuation Monitors (E-BAMs) (Met One Instruments, Grants Pass, OR). We measured hourly average concentrations of PM2.5 and meteorological variables for 69 days starting on Jan. 14, 2009 E-BAM PM2.5 measurements are not recognized as a Federal Equivalent Method or a Federal Reference Method (FRM) (Met One Instruments 2008), one of which is required to determine if levels legally exceed air standards. However, E-BAM measurements have proven comparable to FRM measurements in field tests (CARB 2005a). A record of agricultural burn events was provided by the Air Pollution Control District. During the E-BAM monitoring period, 15,686 acres were burned (including 14,618 acres of bermudagrass) on 35 allowable burn days; the acreage burned daily ranged from 0 to 1,400 acres.
Average 24-hour PM2.5 concentrations (taken between 12:01 a.m. and midnight) were highest — 12 micrograms (μg) per cubic meter — at the northern station (Calipatria) and lowest (6.0 μg per cubic meter) at the western station (Seeley). The lower levels in Seeley may have been because the predominant wind direction was from the west, and sources of pollution, including burned fields, were predominantly to the east of the Seeley station. All daily PM2.5 levels were below the federal standard for unhealthy air, 35 μg per cubic meter. However, at the Calipatria station the 95th percentile of 24-hour concentrations (18.0 μg per cubic meter, n = 69) was above 16 μg per cubic meter, which corresponds to moderate air quality where “aggravation of heart or lung disease in people with cardiopulmonary disease and older adults” is possible (US EPA 2006).
We also compared 8-hour average PM2.5 concentrations at the four locations. There was little difference during the day (8:01 a.m. to 4:00 p.m.), with levels slightly lower on field-burn days compared to no-field-burn days (table 1). In contrast, from the early evening (4:01 p.m.) to the morning of the next day (8:00 a.m.), average PM2.5 concentrations on field-burn days were 23% (2 μg per cubic meter) higher than on no-field-burn days.
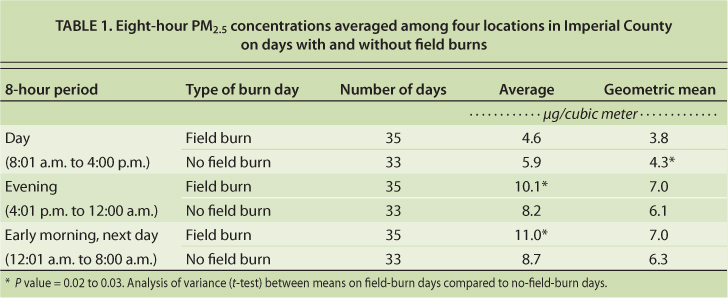
TABLE 1. Eight-hour PM2.5 concentrations averaged among four locations in Imperial County on days with and without field burns
Additionally, on days when there was an agricultural burn within 2 miles of the Calipatria station (n = 9), during the evening-to-morning period the average 8-hour concentrations were 19.5 to 20.7 μg per cubic meter, 170% (6 to 8 μg per cubic meter) higher than on days when there were no burns within 2 miles (table 2). Following the burns near the Calipatria station, on the subsequent 2 days when there were no additional burns (n = 4 or 5), the evening-to-morning levels (13.7 to 15.0 μg per cubic meter) remained slightly above levels on days with no burns (12.6 μg per cubic meter).
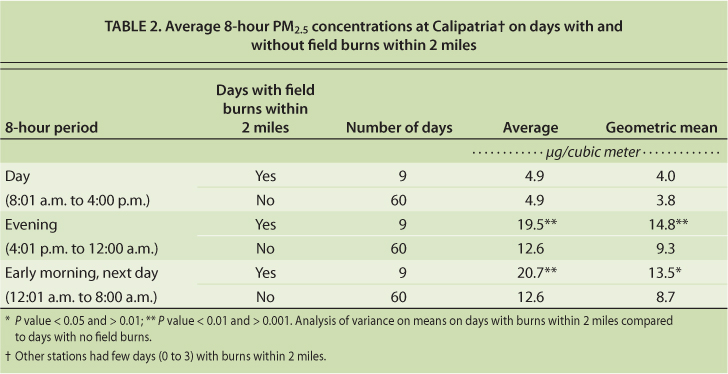
TABLE 2. Average 8-hour PM2.5 concentrations at Calipatria† on days with and without field burns within 2 miles
Higher particulate matter levels from evening-to-morning hours associated with agricultural burning in Imperial County are consistent with air pollution dynamics. Air pollutants may rise during the day as the Earth's surfaces are heated and then be brought down to ground level by the descent of an evening inversion layer. The night and next-day accumulation of smoke is described in a CARB pamphlet for farmers (CARB 1992).
PM and naphthalene during five burns
We monitored five specific burns of 65 to 150 acres of bermudagrass stubble during the E-BAM monitoring period. For four burns, ground-level winds were low at 2 to 3 miles per hour (mph), and the plume from the burn rose up to the apparent height of the inversion layer where it was observed to spread out, sometimes in the opposite direction of the ground wind direction. The ground-level plumes dispersed within about an hour, but the upper plumes remained visible, apparently limited by the inversion layer, until sunset. At one of the five burns, the Dunham burn, the wind speed was higher (5.6 mph), and the ground-level smoke plume engulfed a house on the same property as the burned field and drifted onto an adjacent field.
We deployed portable particulate matter monitors — active-flow and passive personal DataRAM (pDR 1000AN and pDR-1200, Thermo Electron Corp., Franklin, MA) nephelometers — which continuously measured PM2.5 and PM10 (particulate matter less than 10 μm in diameter), respectively. This monitoring was done at three locations surrounding each of the five burns for 24 to 72 hours. Two locations were near the burns (within 0.3 to 3.0 miles) and were places of public access, homes or telephone poles; the other was at the nearest E-BAM, which was farther away (3.5 to 11 miles). At the 15 locations, field difficulties including power outages, supply delivery problems and apparent equipment or software malfunctions limited monitoring to 11 and 13 locations for the PM2.5 and PM10 nephelometers, respectively.
At the 15 targeted nephelometer locations, plus an additional 14 locations near the burns, trained local personnel placed passive samplers (which did not require a field operator or electricity) to measure particulate matter (RJ Lee Group, Monroeville, PA) and naphthalene (SKC Product Code: 575-003, Eighty Four, PA) for 24 to 120 hours and then sent the samplers to our laboratory for analysis. Due to winds shifting from the predicted direction, our samplers were directly downwind only at the Dunham burn. At that burn, although passive samplers were mounted on several telephone poles immediately adjacent to the burned field, only one PM10 nephelometer was successfully deployed.
PM concentrations.
Highly elevated PM10 values were observed at the Dunham downwind monitor: a maximum hourly concentration of 6,500 μg per cubic meter occurred from 1:00 to 2:00 p.m., then a dramatic decline to 4.3 μg per cubic meter by 4:00 p.m. The average 24-hour PM10 concentration at this Dunham location was 276 μg per cubic meter, well above the federal criteria for unhealthy air, 150 μg per cubic meter (US EPA 2006). Although we only successfully deployed one monitor, the highly elevated concentrations were consistent with PM10 levels reported in another study of a burned field (Kelly et al. 2003). Photo evidence was also consistent with visibility of less than 1 mile, which is expected at hazardous air levels (> 526 μg per cubic meter) (Lipsett et al. 2008). As noted, wind speed at this burn was somewhat higher (5.6 mph) than at the other burns (2 to 3 mph).
At several of the other 12 nephelometer locations, much smaller peaks were apparent in PM2.5 and PM10 after the burns were initiated, up to 57 μg per cubic meter of PM10 within the hour. Similar to the E-BAM findings, evening-to-morning peaks in PM2.5 and PM10 (up to 22.0 and 29.6 μg per cubic meter, 8-hour averages, respectively) were observed.
Although all of these peaks were relatively brief (hours), these measurements were collected at places of public access, and even short-term exposures may have health risks. An increase in PM2.5 concentrations in air samples from city centers as low as 10 μg per cubic meter for as little as 2 hours has been associated with increased daily mortality in the surrounding population (Staniswalis et al. 2009).
PM analysis.
At the laboratory, computer-controlled scanning electron microscopy and energy-dispersive X-ray spectroscopy were used to obtain the individual sizes and chemistry of particles collected on the samplers. Then, PM2.5 and PM10–2.5 (particles between 2.5 μm and 10 μm) concentrations and particle size distributions were calculated using assumed particle density and shape factors and a particle deposition velocity model (Wagner and Leith 2001).
In samples from the downwind locations at the Dunham burn, concentrations of both PM2.5 (fine fraction) and PM10–2.5 (coarse fraction) were elevated compared to an upwind sample. The fine fraction was primarily (94%) carbonaceous with a peak at the submicron range (< 1.0 μm), while the coarse fraction had a lower carbonaceous percentage (40%) (Wagner et al. 2012). These carbonaceous percentages were higher than those measured upwind for fine (0%) and coarse (29%) fractions, as well as those reported for fine (34%) and coarse (12%) fractions in San Joaquin Valley ambient air (Ngo et al. 2010).
The coarse fraction in the downwind sample also had higher percentages of potassium, phosphorus and chlorine (32% in the coarse fraction and 1% in the fine fraction). Potassium and chlorine are considered potential indicators of biomass smoke (Kelly et al. 2003; Ostro et al. 2009), and phosphorus is found in most plant material. We also analyzed samples of unburned and burned bermudagrass and found that among inorganic elements, they contained similar peaks of potassium, phosphorus and chlorine (Wagner et al. 2012). Their identification here may assist air pollution researchers attempting to identify sources of particulate matter in air samples.
Naphthalene.
Samples were analyzed for vapor-phase naphthalene by gas chromatography/mass spectroscopy. Concentrations were calculated using an established air-sampling rate. Naphthalene was occasionally detected at the five targeted burns with levels above the reportable limit (0.42 μg per cubic meter) at seven of the 23 locations near the burns (0.3 to 3 miles) and at one of the six more-distant locations (3.5 to 11 miles). The highest level (1.4 μg per cubic meter) was detected in a sampler placed directly downwind of the Dunham burn.
That highest level was lower than a reference level for respiratory effects (9.0 μg per cubic meter) (OEHHA 2004), but only two samples were collected directly downwind and concentrations elsewhere in the plume could have been higher or lower. To compare, vapor-phase naphthalene measured in a laboratory from directly above the burning of agricultural debris was 60 μg per cubic meter (Kakareka and Kukharchyk 2003).
Community interviews
To assess health educational needs, we interviewed community leaders, community residents, farmers and school representatives from the agricultural area of Imperial County. We used a qualitative method called Key Informant Interviews (KIIs), which allows for candid and in-depth responses (Brown 2003) and the characterization of how interviewees discover and act on information. Potential participants were informed that the interview would take 30 to 60 minutes and that responses would be anonymous. If a respondent declined an interview, no information was recorded.
Community leaders.
Ten community leaders were interviewed out of 15 contacted. Those interviewed held management positions within either county (government) environmental health agencies, nonprofit agencies that supported agriculture, or environmental organizations that promoted clean air.
More than half of the community leaders (n = 7) ranked burning as a medium or high concern for their organization. Respondents representing the agricultural industry considered outreach important because, as one respondent said, “The public's view of burning is fairly negative.” Suggestions for educational outreach included training for staff on the health impacts of smoke and “simple recommendations, options of actions to take during a burn.”
Residents.
Seven interviews were conducted after we contacted 15 residents who lived either in single-family homes or apartments within 2 miles of fields. Most (n = 5) considered burning a high or medium health concern compared to other community health concerns. One person said, “You're closing doors and windows, just trying to keep the smoke out.” No respondent had ever called or inquired with government agencies. One respondent explained, “We all have to live with our neighbors… it would be difficult to file a complaint or inquiry.” None of the respondents were aware of any educational materials.
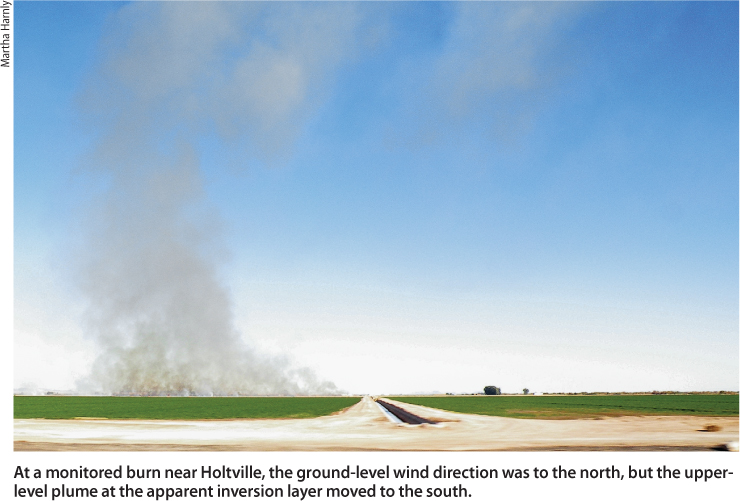
At a monitored burn near Holtville, the ground-level wind direction was to the north, but the upper-level plume at the apparent inversion layer moved to the south.
Farmers.
Of 30 farmers that we contacted, three agreed to participate. All three burned bermudagrass or wheat fields, thousands of acres in some years. The farmers discussed the benefits: as one explained, “Burned fields are more profitable.” All had considered disking their fields or using minimum tillage as an alternative to burning, which they had learned about by trial and error. All three discussed a certificate program used by the Air Pollution Control District to accredit and stimulate financial rewards for farmers who do not burn (Imperial County APCD 2010). All three also had voluntarily notified their neighbors about planned field burns. (Since this study was completed, Imperial County Air Pollution Control District has begun requiring notification of neighbors within one-half mile of a burn [Imperial County APCD 2010]).
School representatives.
Out of 30 contacted, we interviewed five teachers or superintendents who each worked at a separate school or district near historically burned fields. School representatives were concerned about enforcement. Their suggestions included: “Have people call a number if they notice illegal burning or something suspect” and implement “stiff penalties for those who don't [follow burning rules].” They had ideas about community education, such as public service announcements on television. Two respondents, who were not enthusiastic about doing outreach, said, “There's so much that we have to do.” This consideration may have also been part of the reason why the participation rate was low for key informants in this group, and possibly the farmer group.
Fact sheets
Responses from our key informants indicated that educational messages were needed. We developed two-page fact sheets for three Imperial County audiences — the general public, school representatives and farmers. These covered the reasons for burning, burn regulations, potential health impacts and behavioral recommendations to reduce exposures.
In our studies, elevated particulate matter levels and visible drift were observed as far as 500 feet from the edge of burning fields, and wind directions could quickly change. We advised that anyone who could see or smell smoke or was within 300 feet (the length of a soccer or football field) of a burning field should go inside.
If people had to be outside near a burning field, we recommended face-piece particulate respirators (N95, N100 or P100 respirators), which are available at most hardware stores. A worker who must be outdoors and near a burn must be in a respiratory protection program that includes medical evaluations and fit-testing of the respirator's seal on the worker's face (personal communication, B. Materna, California Occupational Safety and Health Administration, Feb. 27, 2011).
A draft of the fact sheet for the general public was tested with community members at a health clinic and shopping center. Although there were complaints about its length, the fact sheet was highly rated for usefulness: all 20 participants gave it either a four (n = 4) or a five (n = 16) on a scale of one (low) to five (high). The final fact sheets were distributed to local organizations and are available on the Internet (CDPH 2011)
Public health recommendations
In our studies, agricultural burning created potentially hazardous air levels immediately downwind; during evening-to-morning hours, PM2.5 levels increased 2 to 8 μg per cubic meter. Many studies have associated total daily human mortality with mean daily (24-hour) particulate matter levels measured in urban centers, and some have observed a relationship at levels as low as 2 μg per cubic meter (Schwartz et al. 2002). In California, increases in children's total daily hospital admissions for respiratory problems are also associated with increases in daily (24-hour) PM2.5 and potassium air levels, the latter an indicator of biomass smoke (Ostro et al. 2009). To protect public health and potentially reduce exposures to smoke from agricultural burns, we recommend additional health education, smoke management and air quality research.
Health education.
Fact sheets are needed for other California counties where agricultural burning takes place, as well as educational materials for outdoor and field workers about respiratory mask protection and smoke visibility guidelines (Lipsett et al. 2008). As interviewees suggested, broader community education could include public service announcements.
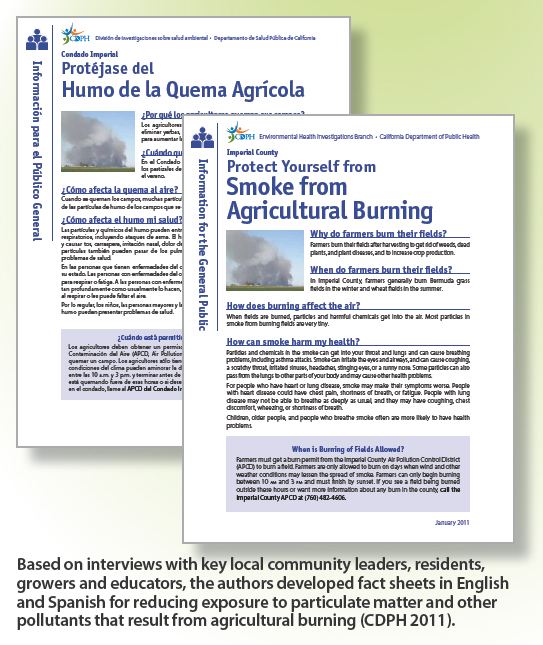
Based on interviews with key local community leaders, residents, growers and educators, the authors developed fact sheets in English and Spanish for reducing exposure to particulate matter and other pollutants that result from agricultural burning (CDPH 2011).
Smoke management.
Currently, CARB declares a permissive-burn day (when burning is allowed with a permit and notification from the Air Pollution Control District) when meteorological conditions ensure the regional dispersion of smoke, for example, a wind speed at 3,000 feet of at least 5 miles per hour (California Code of Regulations 2001). Imperial County's smoke management plan states that the Air Pollution Control District may put in place additional restrictions based on meteorological and air quality conditions, including strong ground-level or gusty winds (Imperial County APCD 2010). We observed substantial drift at a slightly greater wind speed (5.6 mph, or 2.7 meters per second) than that previously suggested for a vertical column of smoke to occur (4.5 mph, or 2.0 meters per second) (Carroll et al. 1977). Local Air Pollution Control Districts could reduce ground-level drift by specifying a ground-level wind speed above which burns should not take place. Additionally, evening-to-morning levels of particulate matter could be reduced if warranted by other restrictions, such as shortening allowable burn hours.
Interviewed residents expressed reluctance to report neighbors who might be out of compliance. Supplemental Imperial County Air Pollution Control District activities could include online instructions about how to make a complaint. In addition, posting visibility guidelines for hazardous drift (Lipsett et al. 2008) and a daily listing of the areas in the county where burns were scheduled would improve community notification.
Research.
Additional air monitoring is needed to further characterize the nature and extent of ground-level plumes and how they are affected by local crop type and conditions. Although crop-specific particulate emission factors (grams particulate matter emitted/kilograms biomass burned) from burning bermudagrass stubble have not yet been developed, factors for other grasses, such as Kentucky bluegrass, are about twice those for rice and wheat (McCarthy 2011). The moisture level of burned residue can also significantly affect particulate matter emissions, with a change in moisture from 10% to 25% more than tripling particulate emissions during the burning of rice, wheat and barley straw (Carroll et al. 1977).
Ambient monitoring should also include indoor air, as outdoor PM2.5 may substantially infiltrate buildings (Lunden et al. 2003), and we observed that outdoor particulate matter increases overnight when people are likely to be inside. Residents may be amenable to researchers installing unobtrusive passive samplers to monitor indoor air. In further studies, methods might be modified to allow the further identification of carbonaceous material, the gaseous component of other PAHs and some of the thousands of other volatile gases found in smoke (Naeher et al. 2007). Information is also needed on whether residents are following recommendations to reduce their exposure to smoke from agricultural burning.
Finally, farmers expressed a willingness to try alternative farming practices, notably tilling. We recommend further study of alternative farming techniques such as conservation tillage, which may reduce the need for burning, conserve water and soil, and reduce air quality impacts (see page 108 ). In addition, integrating livestock grazing with grain and hay farming as a substitute for burning or tilling may reduce pests, herbicide use and erosion and provide additional income (Hatfield et al. 2006). Further study is needed on how farmers could viably integrate alternative techniques into current practices, particularly for local crops such as bermudagrass, and the estimated human health impacts of such changes.
Agricultural burning monitored for air pollutants in Imperial County; exposure reduction recommendations developed

