


All Issues
Scientists, growers assess trade-offs in use of tillage, cover crops and compost
Publication Information
California Agriculture 57(2):48-54. https://doi.org/10.3733/ca.v057n02p48
Published April 01, 2003
PDF | Citation | Permissions
Abstract
Use of cover crops and compost increased soil quality in irrigated, intensive production of lettuce and broccoli in the Salinas Valley. These methods had the beneficial impacts of increasing soil microbial biomass, increasing total soil carbon and nitrogen, reducing surface bulk density and decreasing the potential for groundwater pollution as a result of nitrate leaching below the root zone. These soil benefits did not lead to lower yields and occasionally resulted in fewer weeds and lower lettuce corky root disease. Although surface minimum tillage reduced yields, it led to reduced potential for nitrate leaching below the root zone. Use of conventional tillage, cover crops, and compost produced high vegetable yields and acceptable net economic returns over a 2-year period, but broccoli was more profitable than lettuce under this regime. Understanding the trade-offs of various costs and benefits will help growers choose management practices that optimize economic and environmental benefits.
Full text
Soil quality research focuses on soil organic matter (SOM), its activity and function, and related chemical and physical properties. It also considers the larger picture, including impacts of soil management on production, pests, and economics. Use of cover crops, compost, and reduced tillage may increase SOM, especially the active fraction of SOM that is largely composed of decaying plant material and microbial cells, and plays an important role in nutrient cycling and retention (Paul and Clark 1996). These methods may also increase nutrient availability, leading to less reliance on fertilizers that are derived from nonrenewable fossil fuel, and improve soil physical properties such as aeration and water infiltration (Reeves 1997). They can improve soil quality by minimizing nitrate leaching below the rootzone, reducing groundwater contamination (Jackson et al. 1993).
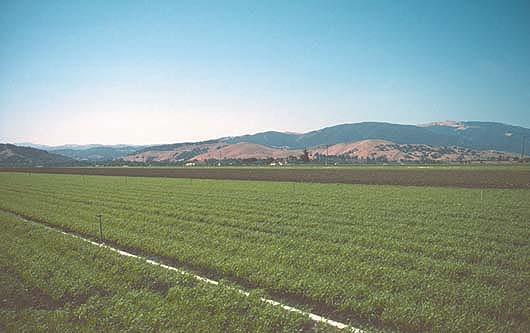
Merced rye cover crop on semi-permanent beds in Salinas Valley vegetable production during the winter. Beds were retained for a 2-year period. The +OM treatment received a cover crop and a compost application each year.
Adoption of these practices will be enhanced if: (1) farmers face few economic disadvantages due to the new procedures; (2) the start-up costs and effort are feasible; and (3) new practices do not result in onset of new problems. In this on-farm research, farmers participated in the design and implementation of experiments to assess the multiple trade-offs involved in transitioning to new management practices.
In an on-farm experiment in a vegetable production field in the Salinas Valley, a multidisciplinary approach was used to evaluate responses to tillage and organic matter (OM) management. Conventional tillage (subsoiling, disking, and surface mulching to a depth of 20 inches) was compared to minimum tillage where only the surface layer of semi-permanent beds is tilled to a depth of 8 inches. Also, organic amendment (+OM) and no organic amendment (−OM) treatments were compared. Organic matter was added to the soil in the form of both cover crops and compost, to incorporate carbon (C) and nitrogen (N) sources like plant residues, that are readily available to plants, and more resistant sources of C and N that remain after the composting of manure, municipal yard waste, and other plant materials. Many conventional and organic vegetable growers use both inputs in their crop rotations, and so these materials were used together to study their effects on SOM and other variables. Soil microbial biomass is one measure of the readily available, active fraction of SOM, and it usually represents < 5% of the total C and N in the SOM (Paul and Clark 1996). Total soil C and N contain many diverse compounds that are resistant to breakdown in soil, and typically change more slowly in response to management than the active fraction of SOM (Wander et al. 1994). The objectives of the 2-year experiment were to determine the effects of alternative tillage and OM management practices by: (1) monitoring changes in crop yield, nutrient uptake, and soil parameters throughout a 2-year period; (2) documenting effects on weeds, pathogens, and insect pests; and (3) assessing the total economic costs and net returns incurred while adopting practices conducive to increasing soil quality.
Soils and management practices
A 20.5-acre field trial site was established in April 1998 in the Salinas Valley of California. The Salinas silt loam soil had a pH of 7.0, and contained 28% sand, 52% silt, and 20% clay. The four treatments were: minimum tillage +OM inputs; minimum tillage −OM inputs; conventional tillage +OM inputs; and conventional tillage −OM inputs. Treatments were replicated four times, and each plot was 1.3 acres. Two replicate areas were sampled per plot.
Typical vegetable production with conventional tillage disturbs the soil to approximately a 20-inch depth and beds are re-made between each crop. The 'Sundance' system for minimum tillage, however, utilizes disks to incorporate crop residues, cultivate the tops and sides of the beds and lister bottoms, shanking the furrows in a single pass. This method tills to approximately 8 inches deep. No subsoiling was done in the minimum tillage treatments. The same 40-inch-wide beds remained in place in the minimum tillage treatments for the entire study, but were re-made between each crop or cover crop in the conventional tillage treatments.
In treatments receiving added OM, compost was added two times per year at 4 tons per acre per application, and a Merced rye (Secale cereale cv. Merced) cover crop was grown each year during the fall or winter when no vegetable crops were present. Compost was applied either immediately before or after the cover crop. The compost was commercially available and had a mean C: N ratio of 17:7. Starting materials for the compost were municipal yard waste (30%), salad packing plant waste (5%), with the remainder composed of manure, clay, finished compost, and baled straw. The amount of total N added percompost application was approximately 80 pound/acre, but this N is not readily available, and is released slowly through time. Consequently, growers apply other fertilizer materials to supplement the N supplied by the decomposition of the compost and cover crops. Currently, accurate methods do not exist for growers to monitor N availability from these materials, and trial and error is often used for determining supplemental fertilizer needs.
Four vegetable crops were grown during the course of the study. Crisphead lettuce was planted in May 1998, January 1999 and June 1999. Broccoli was planted in November 1999, on the east half of the field, and December 1999 on the west half of the field. These were counted as the same crop for the purpose of this study. All crops were direct-seeded.
Sprinkler irrigation was used during the germination and establishment stages of the crops and cover crops. After thinning the cash crops, surface drip irrigation was applied two to three times per month. The entire field received the same fertilizer applications. Nitrogen fertilizer inputs were as follows for the four vegetable crops: 134.2 pound/acre (May 1998 lettuce crop); 84.8 pound/acre (January 1999 lettuce crop); 112.5 pound/acre (June 1999 lettuce crop); and 148.4 pound/acre (2000 broccoli crop). A pre-plant fertilizer of 300 pound/ acre of 5-25-25 before each cover crop and broccoli crop was applied, and one to four applications of liquid 20% ammonium nitrate through the drip tape after thinning each vegetable crop were applied. There was one application of 300 lb/acre of ammonium sulfate prior to planting broccoli.

Sampling occurred at harvest of each of the cash crops and the fall/winter cover crops (n = 32). At each sampling point, soil cores were taken to a depth of 36 inches. Soil analytical methods included gravimetric moisture, potassium chloride extractions for inorganic N, chloroform fumigation extraction for soil microbial biomass (MBC), and anaerobic incubation for potentially mineralizable N. The latter two analyses were only done on the surface soil (0 to 6 inches in depth). In addition, cores for total soil C and N were taken at the end of the experiment at this depth, and for bulk density, also at a typical plowpan depth. Aboveground plant biomass was collected from 1.2-square-yard areas. Total soil C and N and plant nitrogen were analyzed by the DANR Analytical Laboratory. Weed densities were taken during each cropping cycle in one 27-foot-by-50-foot area per plot, whereas weed seedbanks were evaluated by germination tests after washing seeds from soil at four times during the study.
Since soil management is known to affect certain diseases, such as corky root disease (van Bruggen et al. 1990) and Sclerotinia minor (Bell et al. 1998; Jackson et al. 2002), root-susceptible diseases were monitored. Corky root disease was evaluated on a severity scale from 1 (low severity) to 12 (high severity). For corky root, 10 plants were sampled per sampling point. The percentage of sampled plants with symptoms of Sclerotinia minor infection or big vein was assessed in a 695-foot-by-13-foot area per plot. Counts were made of the number of Pea Leafminers that flew and stuck to a sticky card in a bucket cage containing one plant (n = 80).
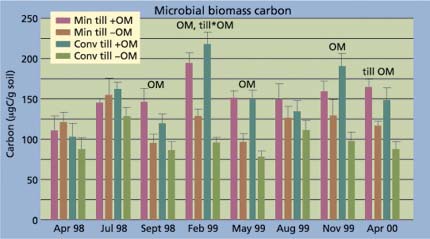
Fig. 1. Soil microbial biomass carbon (MBC) in the 0-to-6-inch layer of soil. Treatment effects are labeled for each sampling date when the main effects of tillage (till) or organic matter (OM) or their interaction (till*OM) was significant at P ≤ 0.05. Mean ± SE shown only in the positive direction.

Fig. 2. Soil gravimetric moisture in the 0-to-6-inch layer of soil. Treatment effects are labeled for each sampling date when the main effects of tillage (till) or organic matter (OM) or their interaction (till*OM) was significant at P ≤ 0.05. Mean ± SE shown only in the positive direction.
Soil responses
After 2 years of cover crop and compost additions, total soil C and N in the surface 0-to-6-inch layer were higher than in non-amended soils (table 1). The addition of OM amendments caused bulk density to decrease in the surface layer, but not at a lower depth. Lower bulk density is known to be beneficial for increasing water infiltration, soil aeration, and root growth (Russell 1973), although no measurements of these effects were conducted in this study. Tillage treatment did not have a significant effect on either total soil C or N, or bulk density.
Soil microbial biomass C, which is a measure of the active SOM, in the surface 0-to-6-inch layer was responsive to OM inputs (fig. 1). At the onset of the experiment in July 1998, when only compost had been applied in the +OM treatments, no treatment differences were observed before cover cropping occurred. After the first cover crop in September 1998, soil microbial biomass (MBC) increased in the +OM treatments, and typically remained higher than the treatments with no OM inputs. MBC in the −OM treatments was typically about 30% to 40% lower than in the +OM treatments from the fall of 1998 through spring 2000. MBC was affected little by minimum vs. conventional tillage during most of the 2-year experiment, but it was higher with minimum tillage at the end of the study, indicating that the active fraction of SOM had begun to slowly increase after this length of time.
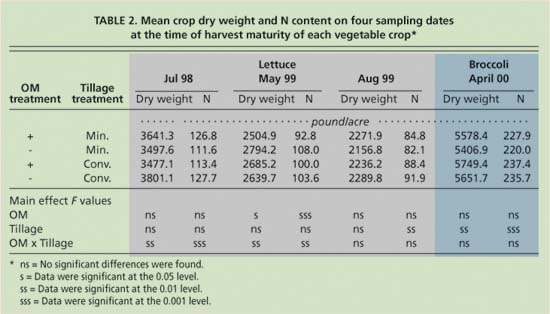
TABLE 2. Mean crop dry weight and N content on four sampling dates at the time of harvest maturity of each vegetable crop*
Soil moisture content was substantially higher in the surface layer after the cover crops were grown due to irrigation (fig. 2). In 1999, this continued through the winter. Minimum tillage decreased the moisture content in the surface layer beginning with the first cover crop in September 1998. Although the differences were small (i.e., 1% to 2% gravimetric moisture), they were consistent through the rest of the experiment. Minimum tillage may have resulted in impedance of lateral and upward movement of water from lower depths in the soil, and therefore in less water in the surface layer where most of the roots of the vegetable crops are located (Gallardo et al. 1996).
Nitrate in the top 3 feet of the soil profile was lower in the +OM treatments, beginning with the first cover crop in the fall of 1998 (fig. 3), undoubtedly due to the uptake of nitrogen by the cover crop. Across both tillage treatments, differences were largest between the +OM and −OM treatments during the fall and winter (135 to 310 pounds nitrate-N/acre) and less when crops were present (approximately 70 to 90 pounds nitrate-N/acre). Minimum tillage also decreased nitrate in the soil profile. There were approximately 45 to 135 pounds more nitrate-N/acre with conventional than with minimum tillage across both OM treatments. The conventionally tilled soils without OM inputs tended to have the most nitrate in the soil profile, thereby increasing the potential for nitrate leaching below the root zone during fall and winter rains.
Ammonium was typically less than 20 pounds N/acre in the top 3 feet of the profile (data not shown) and so was much lower than nitrate. In the surface soil, ammonium was significantly lower after cover cropping, but otherwise did not show consistent responses to the management treatments. Since ammonium is rapidly converted to nitrate in these soils (Calderón et al. 2001), ammonium concentrations are less indicative of N availability than are nitrate concentrations.
Plant biomass and nutrient content
Lettuce and broccoli fresh weights in 1999 and 2000 were highest in the treatment receiving conventional tillage, cover crops, and compost (fig. 4). Addition of OM increased fresh weight or dry weight, or both fresh weight and dry weight, for crops produced in 1999 and 2000, compared to −OM treatments (table 2, fig. 4). For the two 1999 lettuce crops, minimum tillage decreased crop fresh weight compared to conventional tillage, but the type of tillage did not affect dry weight. There may be a relationship with soil moisture since the surface layer (0 to 6 inches) was drier in minimum tillage treatments on both sampling dates (fig. 2) as described above. Soil moisture at lower depths, however, was similar between the two tillage treatments for these lettuce crops (data not shown). For broccoli in 2000, dry weight decreased with minimum tillage, and fresh weight tended to be lower with minimum tillage.
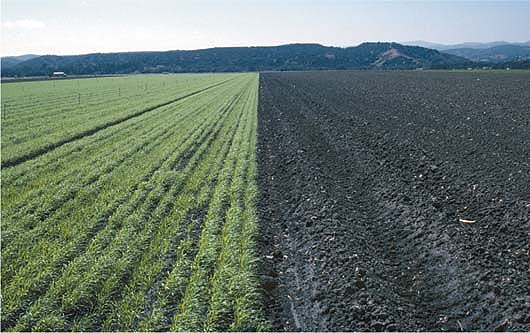
Two minimum-tillage treatments shown side by side: at left, the +OM treatment (cover crops on bed tops and added compost); at right, the −OM treatment (no OM inputs other than unharvested crop residues).
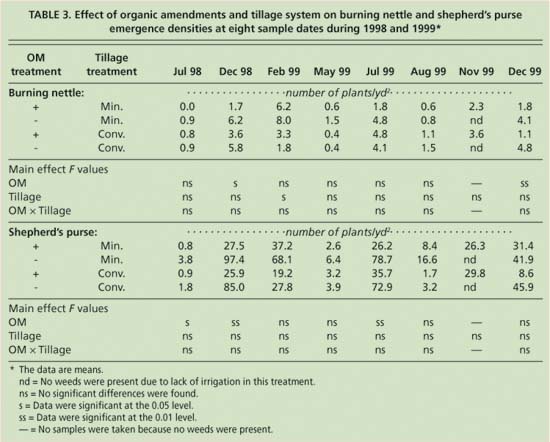
TABLE 3. Effect of organic amendments and tillage system on burning nettle and shepherd's purse emergence densities at eight sample dates during 1998 and 1999*
Nitrogen in the vegetable crops did not show consistent treatment effects (table 2). For example, uptake of N by lettuce was lower with OM inputs only in the May 1999 crop. Uptake of N was also lower with minimum tillage in the August 1999 lettuce crop, and the April 2000 broccoli crop. Minimum tillage resulted in lower tissue phosphorus concentration in both 1999 lettuce crops and the 2000 broccoli crop (data not shown). Lack of disruption of lower soil layers could have resulted in lower temperatures and lower rates of net mineralization in situ, as is typically found in no-till soils (Silgram and Shepherd, 1999).
Cover crop biomass and N were not affected by tillage treatment in either year. Aboveground biomass was 4,142 and 2,660 pounds dry weight/acre and 131 and 122 pounds N/acre in 1998 and 1999, respectively. The C:N ratio was 14 in 1998 and 10 in 1999, assuming that carbon was 45% of plant dry weight, as is typical of most plant material.
Weeds, insects and diseases
The most abundant weed species were shepherd's purse (Capsella bursa-pastoris) and burning nettle (Urtica urens). For samples taken in July and December 1998, and July 1999, the density of shepherd's purse plants was lower where OM inputs had been added (table 3). The density of burning nettle plants was reduced in December 1998 and December 1999 in +OM treatments, and by conventional tillage in February 1999. More extensive analysis showed negative correlations between microbial biomass and weed densities, possibly due to microbial effects on weed emergence (Fennimore and Jackson, in press). Organic amendments were associated with lower numbers of viable burning nettle seed in the soil in 1999, but no other effects of tillage or OM inputs on seedbanks of either species were observed (data not shown).
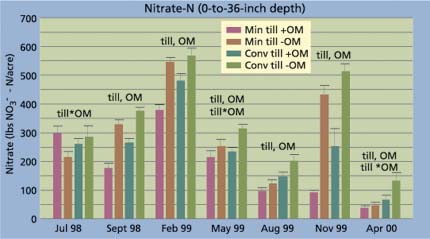
Fig. 3. Soil nitrate pools in the 0-to-36-inch profile. Treatment effects are labeled for each sampling date when the main effects of tillage (till) or organic matter (OM), or their interaction (till*OM) was significant at P ≤ 0.05. Deep layers of soil were not sampled in April 1998. Mean ± SE shown only in the positive direction.

Fig. 4. Fresh weight of the harvestable vegetables. Treatment effects are labeled for each sampling date when the main effects of tillage (till) or organic matter (OM), or their interaction (till*OM) was significant at P ≤ 0.05. Mean ± SE shown only in the positive direction.
Leafminers were present on both of the lettuce crops that were sampled in 1999, but at higher densities in the fall crop than the spring crop (data not shown). All leafminers found were the pea leafminer, Liriomyza huidobrensis, and only a few parasites were found, mostly Diglyphus intermedius. There were no significant treatment effects.
Corky root disease, caused by Rhizomonas suberifaciens, was lower in the +OM treatments in May 1999, even though the severity of this disease was low throughout the field (data not shown). Lettuce drop symptoms caused by Sclerotinia minor were observed on less than 2% of the plants, and there were no treatment differences. Shallow minimum tillage, however, has been shown to increase this disease in other studies, possibly because sclerotia accumulate in the surface soil (Bell et al. 1998; Jackson et al. 2002). Downy mildew, the most important foliar disease of lettuce, was absent from all lettuce crops. Big vein disease, which is caused by a virus-like agent, was only present in the May 1999 crop. No evidence of damping-off diseases was found, although these diseases can be associated with decomposing cover crop residue.
Economic analysis and fuel use
The grower supplied information for each operation including the date, labor and time required, and materials and equipment used. Fresh yield data were also provided for the entire field. Costs and returns were then calculated from the baseline data and crop yields, using actual market prices and costs from local input suppliers. The Budget Planner program calculated total costs, gross returns, monthly cash flow and equipment schedules, and summaries of water, fertilizer, energy and labor use throughout each crop and cover crop season for each of the four management treatments. Rents were estimated to be $1,000/acre/cash crop in this district. Non-cash overhead includes equipment costs. To convert yield data from the grower (box/acre) for the whole field to yield per treatment, we used the relative differences in fresh harvestable yield in 1.2-square-yard areas that had been obtained from the same crop.
Production costs differed with each management system, depending on the amount of tillage and land preparation, the use of a cover crop prior to planting, and the harvesting costs associated with differences in crop yield due to tillage or OM management (table 4). The costs of using a cover crop resulted in additional irrigation, seed, and tillage costs, averaging $265/acre for each cover crop. The costs (not including harvest costs) of the four compost applications and two cover crops over the 2-year study period averaged $288/acre/cash crop for the minimum till +OM system, and $337/acre/cash crop for the conventional tillage +OM system. The difference in management costs between minimum tillage and conventional tillage was that minimum tillage cost $575 less per acre for the 2-year study. Approximately half of the savings was in reduced fuel use with an average reduction of 32 gallons per acre. The rest of the savings was in reduced labor and equipment ownership costs.
Fuel use was 2.2- to 3.8-fold greater with conventional tillage than minimum tillage (table 4). Fall tillage operations to disk, chisel and shape beds accounted for the largest difference between conventional and minimum tillage operations. Incorporation of the cover crop and compost utilized 10% to 30% of the fuel used for each of the crops produced in the spring.
Net returns for the lettuce crops were lowest in the conventional tillage +OM system (table 4), despite the tendency for higher harvest yields in this treatment (fig. 4). The total returns from higher yields were offset by the costs of the OM inputs and increased harvest costs compared to the conventional tillage treatment that did not receive compost and cover crops.
For the broccoli crop in 2000, net returns were highest in the conventional tillage +OM system, which produced higher fresh yields than the other treatments (table 4, fig. 4). The high management costs of this treatment were compensated for by a much greater yield increase for broccoli than for lettuce. Note that it was not possible to collect samples on all three dates when the grower harvested the broccoli crop. The small plot data are for only the second harvest date. The data can be considered a good representation of actual yield, however, because the harvest on this date was very much larger than any of the other harvests.
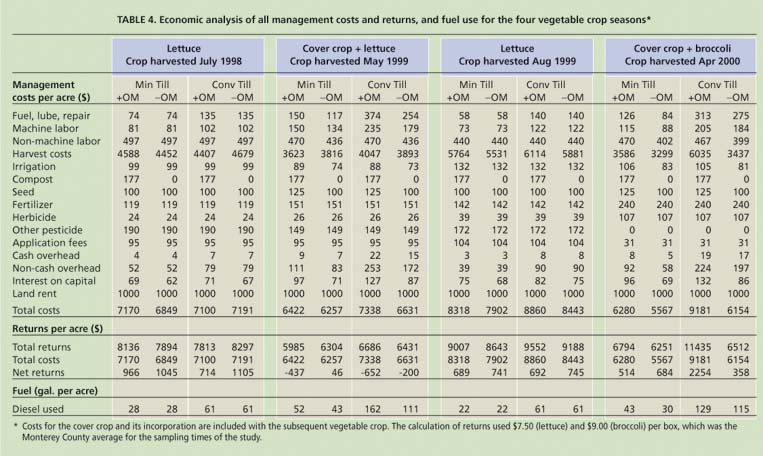
TABLE 4. Economic analysis of all management costs and returns, and fuel use for the four vegetable crop seasons*
The ranking of net returns for the entire 2-year study is as follows (fig. 5), from lowest to highest: minimum tillage +OM inputs ($1,732/acre), conventional tillage −OM inputs ($2,008/acre), minimum tillage −OM inputs ($2,516/acre) and conventional tillage +OM inputs ($3008/acre). The typical practice, conventional tillage without OM inputs, was not the most economically advantageous for either lettuce or broccoli.

Above, deep subsoil tillage in the conventional tillage plots after the last lettuce crop in the fall. Large blocks of soil are brought the the soil surface, and thereafter beds are shaped and smoothed. Right, dried cover crop residue of Merced rye cover crop on semi-permanent beds after Sundance tillage in the minimum tillage +OM treatment.
Implications for management
There are trade-offs to consider with the adoption of alternative OM and tillage practices to improve soil quality. In this study, soil quality was enhanced by cover crops and compost due to increased SOM and microbial biomass, and reduced potential for nitrate loss. Lower soil nitrate was not associated with lower crop yield, as demonstrated by the fact that highest fresh weight of vegetables typically occurred in the treatment using conventional tillage, cover crops, and compost, for which nitrate tended to be lower in both shallow and deep layers compared to lower-yielding treatments.
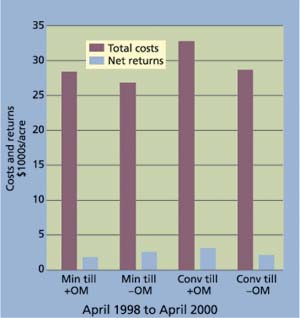
Fig. 5. Total costs and returns by treatment for the 2-year study period from April 1998 to April 2000.
Minimum tillage in our project involved disking the top few inches of soil on semipermanent beds. Neither SOM nor soil moisture in the surface layer increased with minimum tillage, as might have been expected if minimum tillage were similar to no-till management elsewhere in the USA (Carter 1991). Frequent surface tillage probably disrupted the surface layer in a similar fashion as conventional tillage. The lack of soil disruption in lower layers may have created differences in compaction, aeration and temperature, which could have affected water movement and N mineralization at lower depths, such that moisture in the surface layer (0-to-6-inches depth) and nitrate in lower layers (6-to-36-inches depth) were lower than with conventional tillage and could have reduced growth and N uptake of crops grown with minimum tillage. Higher soil moisture in the surface layer of conventional tillage treatments, where lettuce roots are densely congregated, may have contributed to higher fresh weight of lettuce compared to minimum tillage.
In terms of a qualitative assessment of soil quality, the system using minimum tillage with OM inputs ranks higher than other treatments. This treatment tended to be associated with higher total soil C and N, and lower bulk density in the surface soil after 2 years, and higher soil microbial biomass during much of the 2-year period. In addition, the potential for nitrate leaching below the root zone was lower than in any other treatment. Yet, minimum tillage with OM inputs did not produce high vegetable yields, possibly due in part to slight N, P and moisture limitation, nor was it economically advantageous despite low fuel and input costs.
Conventional tillage with OM inputs appears to be a more attractive option for farmers. This treatment enhances some attributes of soil quality and also produced high lettuce and broccoli yields. Although the increase in lettuce yield was not high enough to offset the costs of using the OM inputs, economic returns across the 2-year period were highest for this system, largely due to high yields of broccoli. If farmers were to use this treatment with intermittent use of minimum tillage (e.g., between summer crops or to incorporate a cover crop), they could effectively reduce tillage costs and fuel use, without the deleterious effects on productivity that were observed with continuous minimum tillage over a 2-year period.
Scientists, growers assess trade-offs in use of tillage, cover crops and compost

