


All Issues
Characteristics of farms applying for cannabis cultivation permits
Publication Information
California Agriculture 73(3):128-135. https://doi.org/10.3733/ca.2019a0019
Published online September 12, 2019
PDF | Citation | Permissions
NALT Keywords
Abstract
Cannabis producers in California can now participate in a regulated supply chain — but little is known, despite considerable speculation, about which types of producers are likely to seek legal status. Growers' decisions about joining the legal market are central to questions about how formalization will transform cannabis production in California, and in particular whether small farms, which were encouraged under Proposition 64, can remain part of the industry. We combine data on the location and characteristics of cannabis farms in 2012 and 2016 with applications for cultivation permits from 2018 to investigate farm characteristics associated with cannabis formalization in Humboldt County. We find strong evidence that the farms most likely to start the permit process are larger, existed in 2012 prior to the start of the “green rush” and expanded at greater rates between 2012 and 2016. The evidence is consistent with concerns that formalization of the cannabis industry may lead to industry consolidation, as has been the trend in California's agricultural and timber industries more broadly.
Full text
Agriculture in the United States has undergone massive consolidation over the past 50 years and the same is true in California. Several economic and market factors have contributed to farm consolidation, but new regulations on agriculture have also played a role (Dunn 2003; Howard 2015). Compliance costs associated with increased regulatory burdens can decrease producer profits and limit market entry (Thilmany and Barrett 1997). Small producers may be particularly harmed by the need to achieve compliance, as economies of scale provide larger producers an advantage (Dean et al. 2000). Small firms may lack sufficient capital to change production methods to comply with regulations, or even to manage the burdens associated with reporting. (See McCullough et al. 2017 for a more comprehensive discussion of regulatory costs to California farmers.)
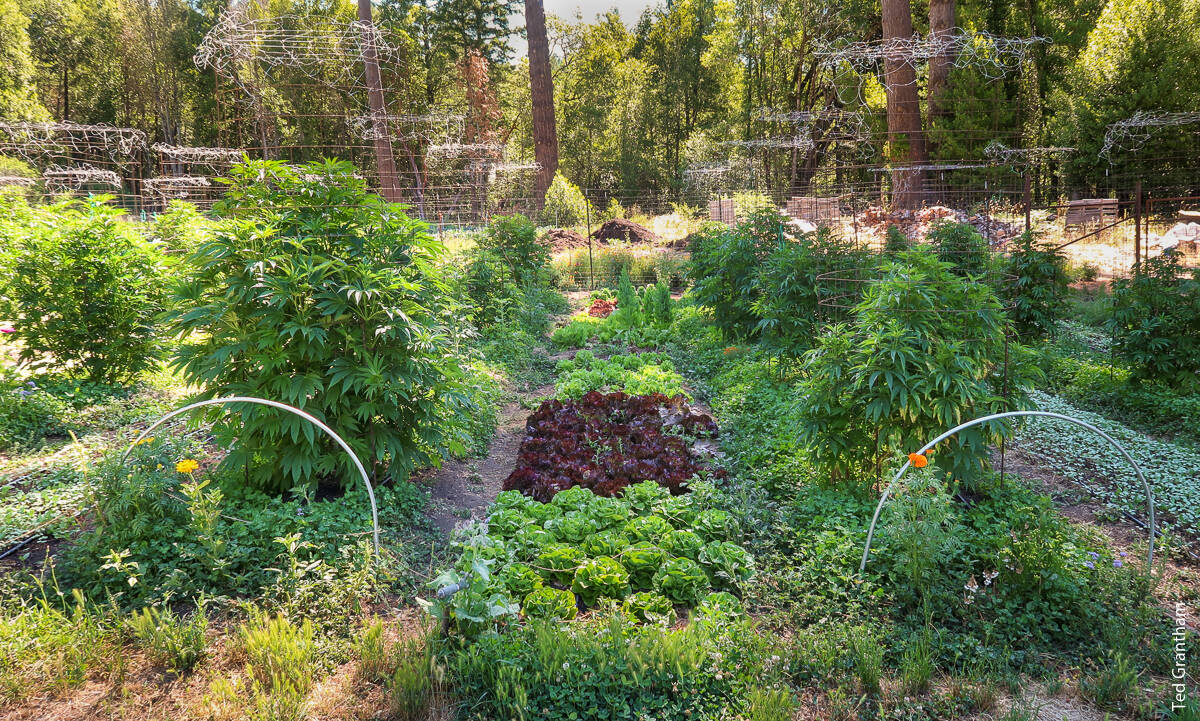
In Humboldt County, a permitted cannabis grow is integrated with a small-scale commercial vegetable farm operation. Results from a recent study suggest that cannabis farms with more plants are more likely to apply for cultivation permits than farms that grow fewer plants.
The cannabis industry has historically resisted widespread farm consolidation, perhaps due to its status as an unregulated, and illicit or semi-licit, activity. While the amount of cannabis produced in California is substantial (Macewan et al. 2017), evidence from 2016 suggests that most outdoor cannabis was then produced on farms smaller than one acre (Butsic et al. 2018). When Proposition 64 legalized nonmedicinal cannabis in 2016, its size provisions explicitly acknowledged the state's desire to see cannabis farms remain small (California NORML 2016b). Initial regulations limited each permit to an area no greater than one acre and limited each entity (person or corporation) to only one permit. Federal laws against cannabis have also encouraged small farms: Farmers with more than 99 plants potentially face federal minimum sentences of five years in prison (California NORML 2016a).
Local permitting may also favor smaller producers. Each jurisdiction in California can create its own permitting system, and possessing a local permit is a condition for obtaining a state permit. Most local jurisdictions place limitations on field sizes, and these limitations can encourage small-scale farming. While local permits may provide an avenue for local governments to protect small farmers (for example, by restricting field size), they also add another layer of regulation, potentially increasing entry costs.
Beginning with California's first attempt to implement a comprehensive regulatory system for the cultivation and distribution of legal cannabis, through the 2015 passage of the Medical Marijuana Regulation and Safety Act, stakeholders have expressed concerns that the permitting process privileges large farms over small. MacEwan et al. (2017) calculate that, due to the nature of regulatory costs, the type of small cannabis farmer prevalent in Northern California is the “least likely to participate in the regulated market.” (MacEwan et al. estimate that total regulatory costs for typical outdoors producers range between $207 and $248 per pound.) Yet to date, empirical evidence on cannabis producers' engagement with the formal market under the new regulatory framework has been lacking. In particular, there is a large evidence gap about the types of farms that participate in the regulated market and those that do not. The gap exists partly because of a lack of public data about growers who have not applied for permits. We remedy that gap by combining information about farmers who have started the permit application process with a unique dataset of cannabis farms in Humboldt County in 2012 and 2016. We then ask:
-
Were there size differences between farms that started the permit application process and those that did not?
-
Were farms that expanded between 2012 and 2016 more likely to apply for permits than those that did not?
-
Were farms created between 2012 and 2016, during the peak of the “green rush,” more likely to apply for permits than farms already producing cannabis in 2012?
-
Were there other significant differences in farm and parcel characteristics between farms that applied for permits and those that did not?
Linking farms with permit applications
Humboldt County is one of the largest cannabis-producing regions in California and perhaps the world. Cannabis farming began there in the early 1960s, with rapid expansion following in the 1970s, and cannabis has been among the most valuable crops in the county at least since a proposition legalizing medical cannabis was approved by voters in 1996 (Budwig and Bank 2013). Recent studies suggest that at least 5,000 cannabis farms operate in Humboldt County (Butsic et al. 2018). (By way of comparison, the 2017 federal agricultural census [USDA-NASS 2019] identified 849 noncannabis farms in the county, not including timber operations.) In the lead-up to the enactment of regulated cultivation of cannabis — which began for the medicinal market in 2016 and for the adult-use market in 2018 — the region experienced a cannabis boom, with the number of plants under cultivation increasing by 150% between 2012 and 2016 (Butsic et al. 2018). This time of massive cannabis expansion is often referred to locally as the “green rush.”
To track both permitted and unpermitted cannabis growers, we used data created by Butsic et al. (2018). In their study, Butsic et al. hand-digitized cannabis farms (both greenhouse and outdoor grows) using very high-resolution satellite imagery. Cannabis production was measured in both 2012 and in 2016. Outdoor plants were counted and the number of plants inside greenhouses was estimated based on greenhouse size. Of the 1,724 farms in the dataset, 942 started producing cannabis between 2012 and 2016 (“new farms”) and 782 produced at least some positive amount in both 2012 and 2016 (“existing farms”).
For permit data, we used publicly available data from the Humboldt County Planning Department, compiled from applications for commercial cannabis cultivation permits (Humboldt County Planning and Building Department 2018). We were able to combine the farm location data with the permit data based on the unique parcel identification that existed in both datasets. In total, applications were received for cultivation on 1,945 unique parcels. Of these, 533 were located within our study area (322 from existing farms and 211 from new farms). We also include data (see online technical appendix) describing farm/parcel characteristics. Locational variables such as distance to public roads and cities are used to proxy for transportation cost, while distances to endangered and threatened fish species (chinook salmon and steelhead) habitat proxy for the environmental sensitivity of a site. Distance to ocean provides a summary measure of the coastal environment of the farm. Biophysical characteristics such as slope and presence of prime agricultural soils are used to describe the growing conditions of a site, while zoning designations are used to identify areas where growing cannabis is allowed (Butsic et al. 2018). We also determined if a timber harvest plan had been associated with a parcel at any point since 1997.
Methods to compare farms by permit application decision
The overall aim of our empirical analysis is to describe the type of cannabis farms likely to apply for a permit. To do this we use a twofold approach. First, we compare farms that applied for a permit and farms that did not in terms of the means of their farm and parcel characteristics. We use a simple two-tailed test to determine if the univariate mean differences between these groups are statistically significant. We focus on differences in farm size (i.e., number of plants), farm-size expansion during the “green rush” period (2012–2016) and tenure of the farm.
In a second step we estimate models of application decisions using multivariate regressions, which allow us to isolate the impact of each characteristic while controlling for variation in others (Wooldridge 2010). We implement two such models. Our main specification (equation 1) is a probit model in which the binary dependent variable (Applyi) is equal to 1 if a permit application was submitted for parcel i. (An alternative logit specification produced nearly identical results.) The size of the farm is included with a quadratic specification and the other parcel and farm characteristics (the vector X) enter the model linearly as independent variables. We use the probit model to estimate the marginal contribution of each of these variables to the likelihood that a parcel applies for a permit.
Applyi = β0 + β1Sizei + β2Sizei2 + Xiβ + εi (1)
We also estimate a linear probability model of the binary application decision that includes watershed fixed effects (equation 2). The watershed fixed-effects model includes a dummy variable for each of the 59 watersheds (σj) in the sample, so coefficient estimates are identified by within-watershed variation. Because some predictors of application are likely correlated within geographic regions, estimating the model in this manner allows us to purge higher-level effects common at the watershed level from the parcel-level estimates (Wooldridge 2010). We use the same vector of covariates for the fixed-effects model as for the probit model.
Applyij = β0 + β1Sizeij + β2Sizeij2 + Xijβ + σj + εij (2)
We include the quadratic term on farm size to increase the goodness of fit in our model and allow a more flexible relationship between farm size and permit application. The other covariates included in our regression are useful predictors of permit application, as they explain site-specific characteristics as well as proxy for potential land-use opportunities. They have been found to be significant predictors of farm location (Butsic et al. 2017) or farm abandonment (Butsic et al. 2018). Importantly, these other covariates are primarily time-invariant or predetermined at the time growers decide whether to apply for permits. Specifically, we include variables of environmental sensitivity (distance to steelhead and chinook salmon habitat) as proxies for potential challenges in obtaining approval from the Regional Water Quality Control Board. We include zoning information to help describe the other potential uses of the parcel if it were not being used for cannabis. Finally, we include a variable indicating if the area had ever had a timber harvest plan since 1997. We include this variable to see if past land use (i.e., timber harvest) influences the likelihood of permit application.
Clear patterns in farms' decisions about applying for permits
The average farm size in 2016 was 432 plants, with a median of 263 plants, a minimum of 14 and a maximum of 12,901 (fig. 1). Over 90% of farms produced fewer than 1,000 plants and fewer than 2% produced more than 2,000. Examining permit application rates by farm size reveals a distinct size gradient (fig. 2), as application rates increase substantially over farm-size categories. This pattern holds for both existing and new farms, but the rise is much sharper for the latter. Approximately 10% of small new farms (i.e., new farms with fewer than 250 plants) apply for a permit, but rates jump to 61% and 50%, respectively, for the largest farm size groupings.

FIG. 1. Distribution of sample by farm size in 2016 for new and existing farms, shown as a histogram of cannabis farm size by farm category, where size is determined by the number of cannabis plants on the property in 2016. Existing farms are defined as properties with a strictly positive (>0) number of cannabis plants in 2012, while new farms are defined as properties that produced zero cannabis plants in 2012.
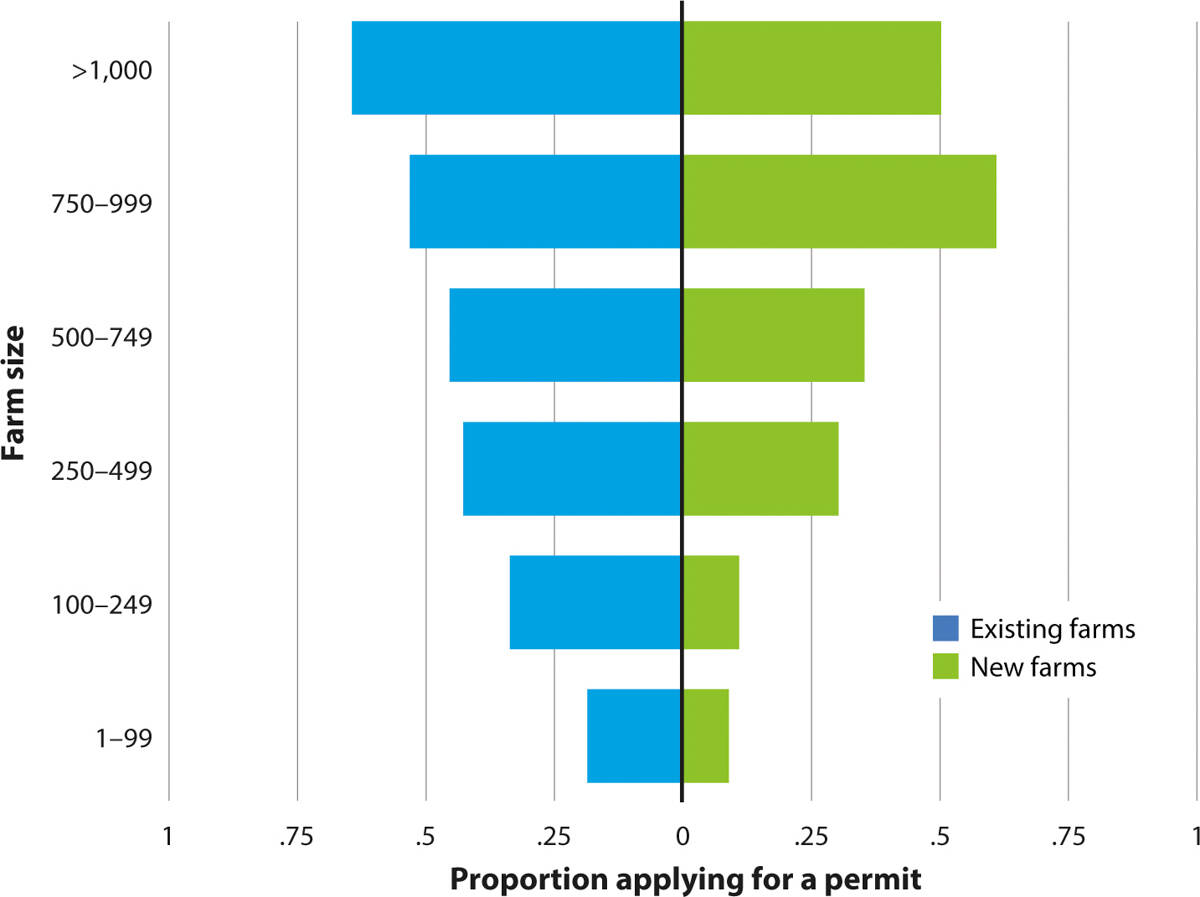
FIG. 2. Probability of applying for a permit by farm size for new and existing farms. For both existing (blue) and new (green) farms, bars represent unadjusted proportion of each farm-size group that applied for a permit. Existing farms are defined as properties with a strictly positive (>0) number of cannabis plants in 2012, while new farms are defined as properties that produced zero cannabis plants in 2012.
We found a significant difference in size (p<.01) between farms that applied for a cannabis permit in 2016 (mean size of 633 plants) relative to those that did not apply (mean size of 345 plants) (table 1). The trend according to which larger farms applied for permits at higher rates held true regardless of production type (greenhouse or outdoor). The size differences are proportionally similar for both greenhouse and outdoor plants, so we do not find evidence that the relationship between farm size and permit application is solely driven by production method.

Our regression models (table 2) confirm that this result is robust to controlling for other covariates. In all our regression specifications, the coefficient on the total number of plants (in hundreds) in 2016 is positive and statistically significant at the 1% level. The effect size of the number of plants indicates that, controlling for parcel characteristics, an increase of 100 plants increases the probability of applying for a permit by 2.4% (column 2), with the slope of the relationship declining for extremely large farms (fig. 3). The overall marginal effect is similar for existing and new farms, (table 2, columns 4 and 5), though the declining marginal effect for very large farms is driven by new farms (fig. 3), and is robust to the inclusion of watershed fixed effects (table 2, column 3). The pattern also holds for size in 2012. Restricting the sample to existing farms, an increase of 100 plants in 2012 increases the probability of application by 3.1%.
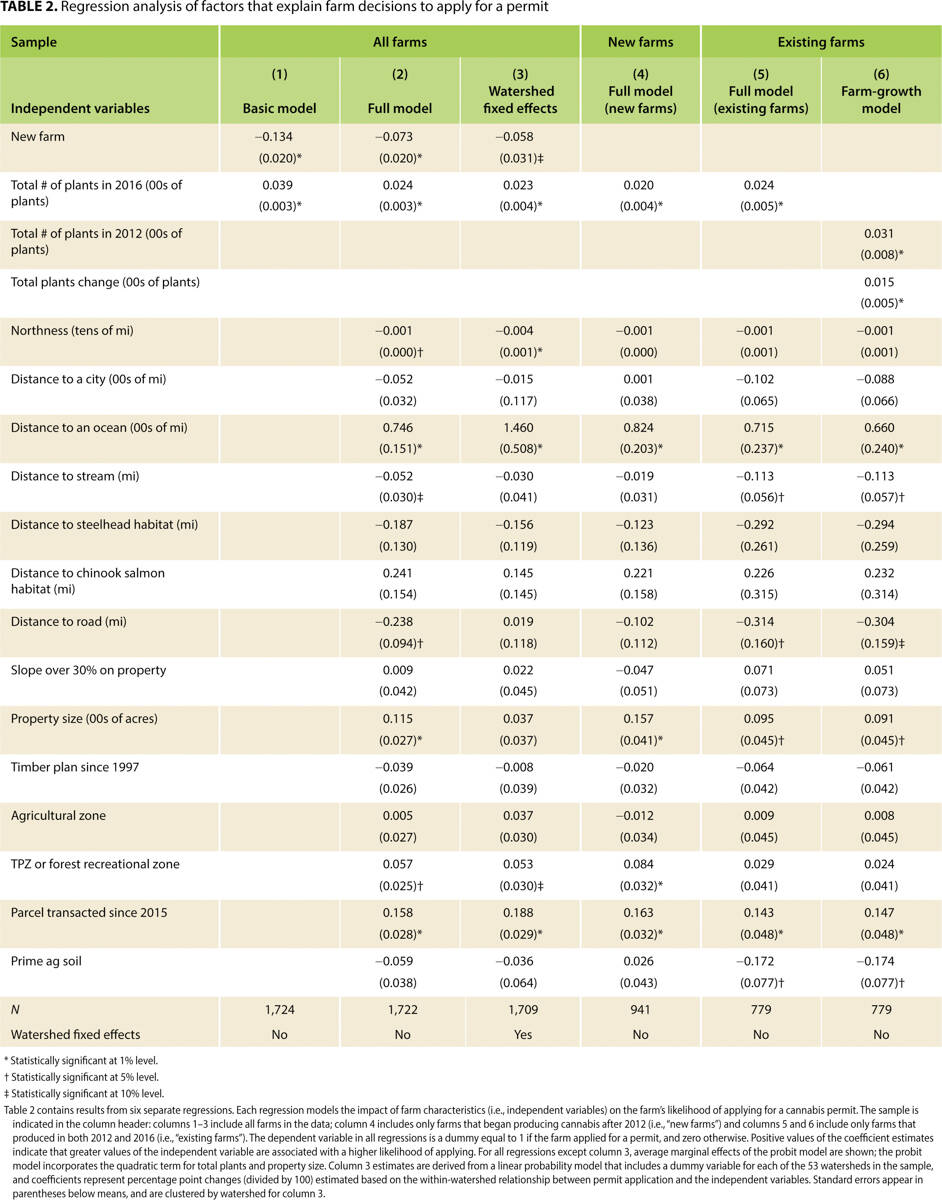
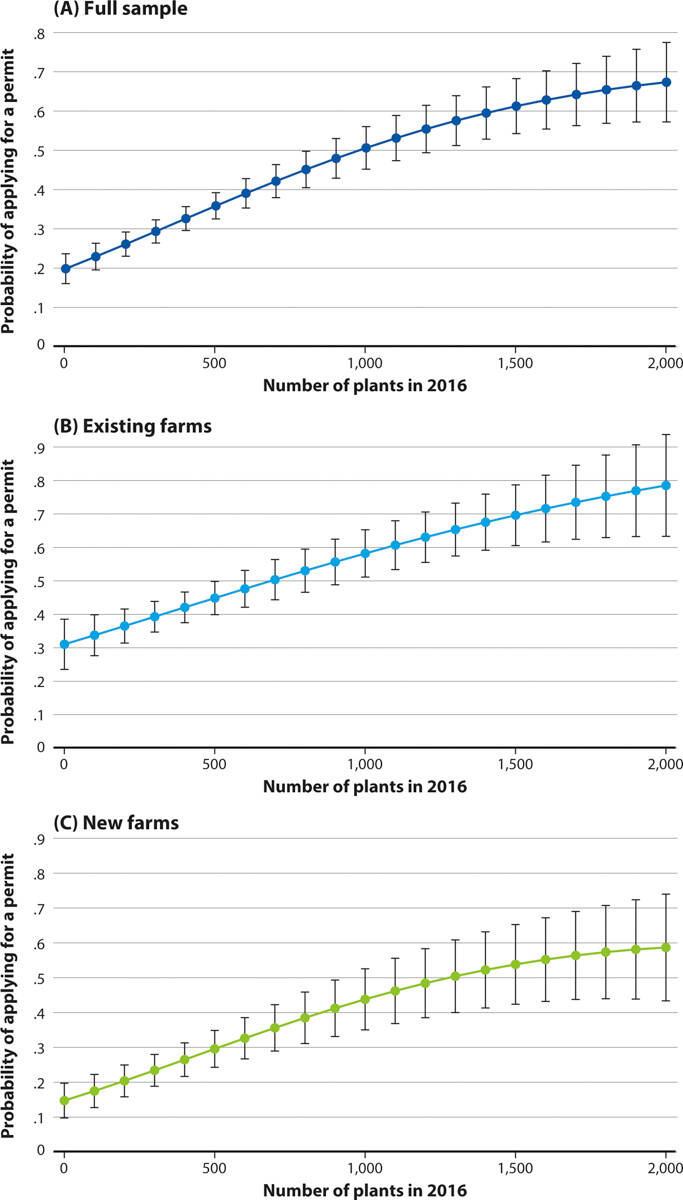
FIG. 3. Predicted probability of permit application by farm size. Predicted probabilities derived from marginal effects estimated from equation (1). Panel A corresponds to column (2) of table 2. Panel B corresponds to column (5). Panel C corresponds to column (4).
Growth rate
We first categorize growth of existing farms according to the proportionate change in plants produced between 2012 and 2016. The “declining production” group consists of farms that shrank by more than 5% (accounting for 11% of the existing-farm sample); “minimal change” farms experienced between –5% and 5% growth (39% of the sample); “moderate growth” farms grew between 5% and 50% (14%) and “high growth” farms grew by more than 50% (37%). Within the sample of existing farms, there is a clear gradient of application rates with respect to growth between 2012 and 2016 (fig. 4). The farms least likely to apply are those that declined in size, followed by those with minimal growth. Application rates for existing farms that grew moderately jump to over 40%, with high-growth farms the most likely to apply. Note that across all expansion rates for existing farms, application rates are significantly higher than the average rate for new farms.
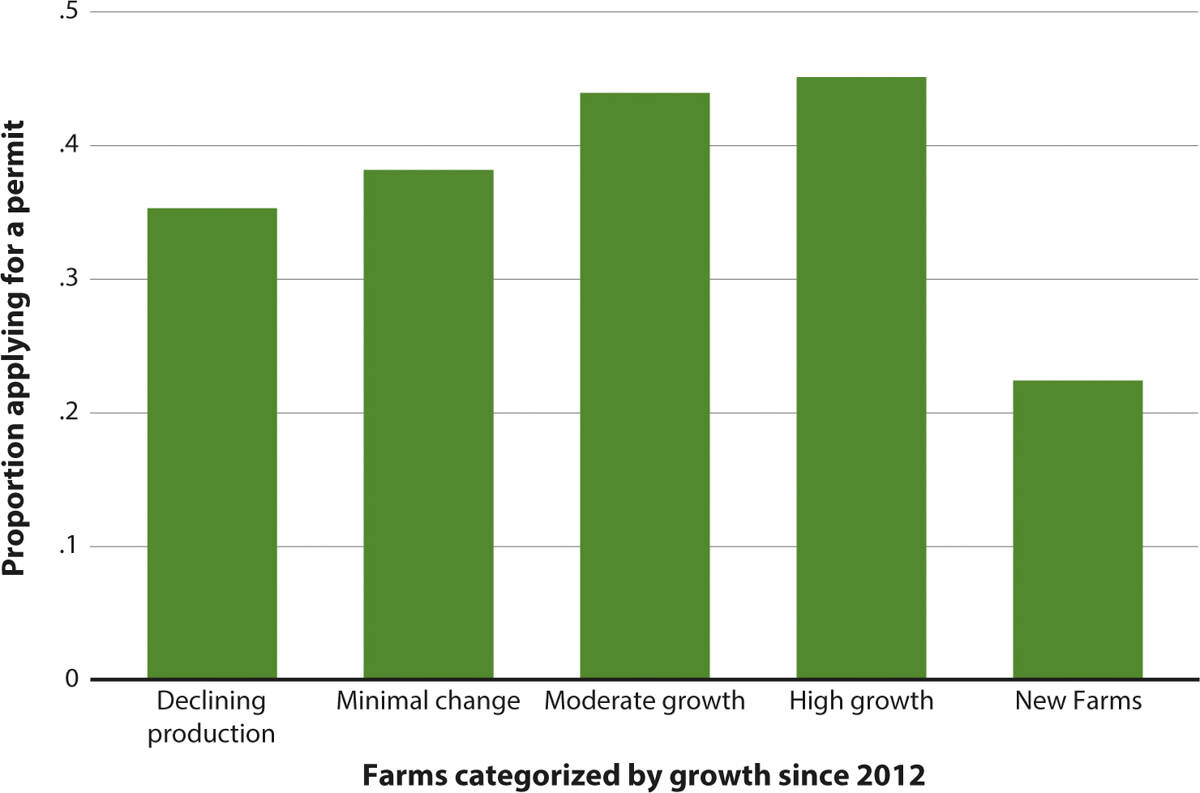
FIG. 4. Probability of applying for a permit by farm growth between 2012 and 2016. The height of each bar corresponds to the proportion from each group that apply for a permit. The leftmost four bars are subgroups of existing farms (i.e., produced cannabis in both 2012 and 2016), while the rightmost bar consists of all farms with positive 2016 cannabis production but no 2012 production (“new farms”). The “declining production” group consists of farms that shrank by more than 5% (11% of the existing farm sample); “minimal change” farms had between –5% and 5% growth (39%); “moderate growth” farms grew by between 5% and 50% (14%) and “high growth” farms grew by more than 50% (37%).
Statistical tests confirm this trend. Existing farms that applied for permits displayed a mean expansion of 212 plants between 2012 and 2016, while the mean expansion for farms that did not apply was 130 plants (table 1). This difference of 82 plants is significant at the 1% level. Our regression results also find expansion associated with permit application (table 2). In column 6, an increase of 100 plants among existing growers (i.e., total plants change) is associated with a 1.5% higher probability of applying for a permit, with the result positive and statistically significant at the 1% level.
Old farms and new farms
Older farms are 25% larger, on average, than new farms. Both predominantly produce cannabis in greenhouses, where multiple crops can be produced each year. This increases potential revenue, though the share of greenhouse production is slightly higher among new farms than existing farms (95% compared to 88%). However, new farms are far less likely to apply for permits than existing farms. The univariate comparison shows that, on average, a new farm was 22% less likely to apply for a permit than a farm that already existed in 2012. Our regression results indicate that this relationship is robust to controlling for associated covariates, including farm size. The coefficient on new farms is statistically significant and negative in all regression specifications. Controlling for other factors, new farms are approximately 7.3% less likely than existing farms to apply for a permit, with the magnitude of the effect slightly reduced when relying only on within-watershed variation (table 2, columns 2 and 3). Small new farms are very unlikely to apply for a permit, even in comparison with existing farms of similar size (fig. 2).
Other factors in permit status
Regression results indicate that farms which have not applied for permits tend to be located further north, closer to both cities and the coast and further away from roads (table 2). They are also more likely to be located on prime agricultural soils, which is a listed requirement for obtaining a permit. However, there seems to be no effect associated with flat terrain or agricultural zones, which are also requirements for permits. These results suggest that siting criteria in the permit ordinance do not appear to be positive independent drivers of application decisions.
In contrast, farms that did apply for permits tend to be located closer to streams and chinook salmon habitat, even as permit eligibility requires the use of non-diversionary water sources (table 2). Applying farms are also more likely to be located in forest recreation or timber production zones (TPZs) and to have been transacted at least once since 2015. They also tend be located on larger parcels. However, from comparing the results in columns (2) and (3), it is clear that a number of regression outcomes between permit applications and parcel characteristics (excluding those related to farm size, timing of production, land sales and coastal location) are not robust to the inclusion of watershed fixed effects. This suggests the existence of underlying geographic drivers which might influence these relationships.
Small farms face an uncertain future
Cannabis has been profitably produced in California, primarily on small farms, for decades (Polson 2013; Short Gianotti et al. 2017). As cannabis becomes increasingly legal, production practices have become more standardized, and many small farms fear that the increased regulatory costs associated with formalization will force them to either shut down or remain on the black market (Wagner et al. 2018).
Here, we use empirical data on farm location and permit status to investigate differences between cannabis farms that applied for permits to produce in the legal market and those that did not. We find strong evidence that farms with more plants are more likely to apply for permits than farms that grow fewer plants. This is consistent with the argument that increased formalization disfavors small-scale farms (Guthman 2004, 2014). A potential implication of this trend is that continued cannabis expansion in California may disproportionately favor the establishment of large farms, despite measures seemingly designed to prevent this outcome. Small cannabis farms may face challenges similar to those faced by small farms producing other crops (Tourte and Faber 2011) — and if small farms are valued, additional policy solutions are required.
While our results point toward a robust positive relationship between size and permit application (e.g., table 1), we cannot definitively attribute the cause to either the fixed cost of initial application or ongoing costs associated with regulatory compliance. Small farms, for example, may be less able to engage with the legal supply chain or obtain favorable pricing in the legal market, or they may systematically differ from larger farms in risk tolerance. Thus, because we are unable to directly control for these factors in the regression analysis, it is unclear which of these potentially omitted variables might be driving the size-application relationship. That ambiguity suggests a topic for future study.
We also find that existing farms that expanded during the “green rush” years were more likely to apply for permits. This finding could arise via multiple pathways. Perhaps farms that expanded during this time were those endowed with, or able to accumulate, sufficient capital to enter the regulated market. Alternatively, some farms may have invested more heavily specifically in anticipation of formalization and legal marketing opportunities. We also found that farms that were established after 2012 were less likely to apply for permits, all else equal. Whether these newer farms will continue to operate illegally or abandon their operations remains unknown. Nevertheless, it suggests potential divergence in formalization strategies between newer entrants and older producers. Whether that divergence is driven by systematic differences in operators' human capital and experience levels, in financial capital or in other unobserved factors like risk tolerance or “taste”-based considerations (i.e., attitudes toward cannabis production) remains a subject for further research.
Indeed, while formalization is clearly favored by larger farms, we do find evidence that smaller farms traditionally associated with Northern California cannabis production have not been completely shut out of the legal market. Though permit application rates for the smallest farms are substantially lower than those for large farms, the small farms that do apply tend to be farms with longer production histories.
Our work documents permit applications at a dynamic moment in formalization, and we suggest that the trends we have seen to this point may change going forward. Many farms that applied for permits may not complete the application or gain approval, or may fail to receive necessary permits from state offices. Likewise, new cannabis investments continue in the county and some farms that initially resisted formalization may now decide to join the market. New cooperative businesses that specifically focus on supporting small farms are emerging, and these organizations are assisting small farmers in the permitting process. The final chapter of formalization is yet to be written.
Characteristics of farms applying for cannabis cultivation permits

