


All Issues
Soil testing for P and K has value in nutrient management for annual crops
Publication Information
California Agriculture 70(3):152-159. https://doi.org/10.3733/ca.2016a0007
Published online August 01, 2016
NALT Keywords
Abstract
Adequate nutrients in forms available to plant roots are essential for sustainable crop production. Soil testing for phosphorus and potassium availability allows growers and crop advisers to determine whether a soil is likely to respond to fertilization. As yields have risen with improved management and production systems, crop nutrient demand and the removal of nutrients with harvested crops have increased. An in-depth discussion of soil tests for phosphorus and potassium and their use in California cropping systems is clearly needed. We review how these nutrients become available to plant roots, how samples are taken and test results interpreted, complementary ways to assess the adequacy of supplies and what research is needed to improve soil testing for phosphorus and potassium.
Full text
Phosphorus (P) and potassium (K) are essential nutrients required in rather large amounts by crops. The application of fertilizers is often required to meet the crops’ demand, with the application rate depending on the availability of nutrients in the soil. Insufficient application rates result in lower yields and may reduce soil fertility over time as the availability of nutrients decreases. In contrast, the application of excess nutrients increases production costs and may cause environmental problems.
Soil testing is one of the most cost-effective nutrient management tools available to growers and crop advisers. It can guide fertilization decisions for individual fields, and it can assess whether a soil is likely to respond to fertilization (Cox 1994). Soils differ in their capacity to supply nutrients to crops.
Early research has shown that many soils in California do not supply sufficient P to annual crops, and P fertilization has often been found to be highly beneficial (Jenny et al. 1946). Tree crops, in contrast, are less likely to have a yield response to P fertilizer. Few cases of K deficiency were reported in the first half of the 20th century (Jenny et al. 1946). With a few exceptions, K has not received much attention since then. We focus on P and K here, but our discussion applies to other nutrients, such as calcium or magnesium, as well. One exception is soil sampling for residual soil nitrate-N. Nitrate is directly plant available, but much more mobile in the soil than P and K and thus easily lost.
An in-depth discussion of soil tests and their use with a focus on California cropping systems is currently missing, but clearly needed. Improved management and varieties have increased productivity considerably in California. Most recently, the shift to semipermanent drip irrigation systems has further increased crop yield. As a result, nutrient removal is higher and soil nutrient depletion faster because of the more confined root zone.
A positive response to P and K fertilization is now much more likely even on soils that have long been considered sufficiently fertile. For these reasons, and because environmental concerns with overfertilization are being raised more frequently, the value of soil testing has increased.
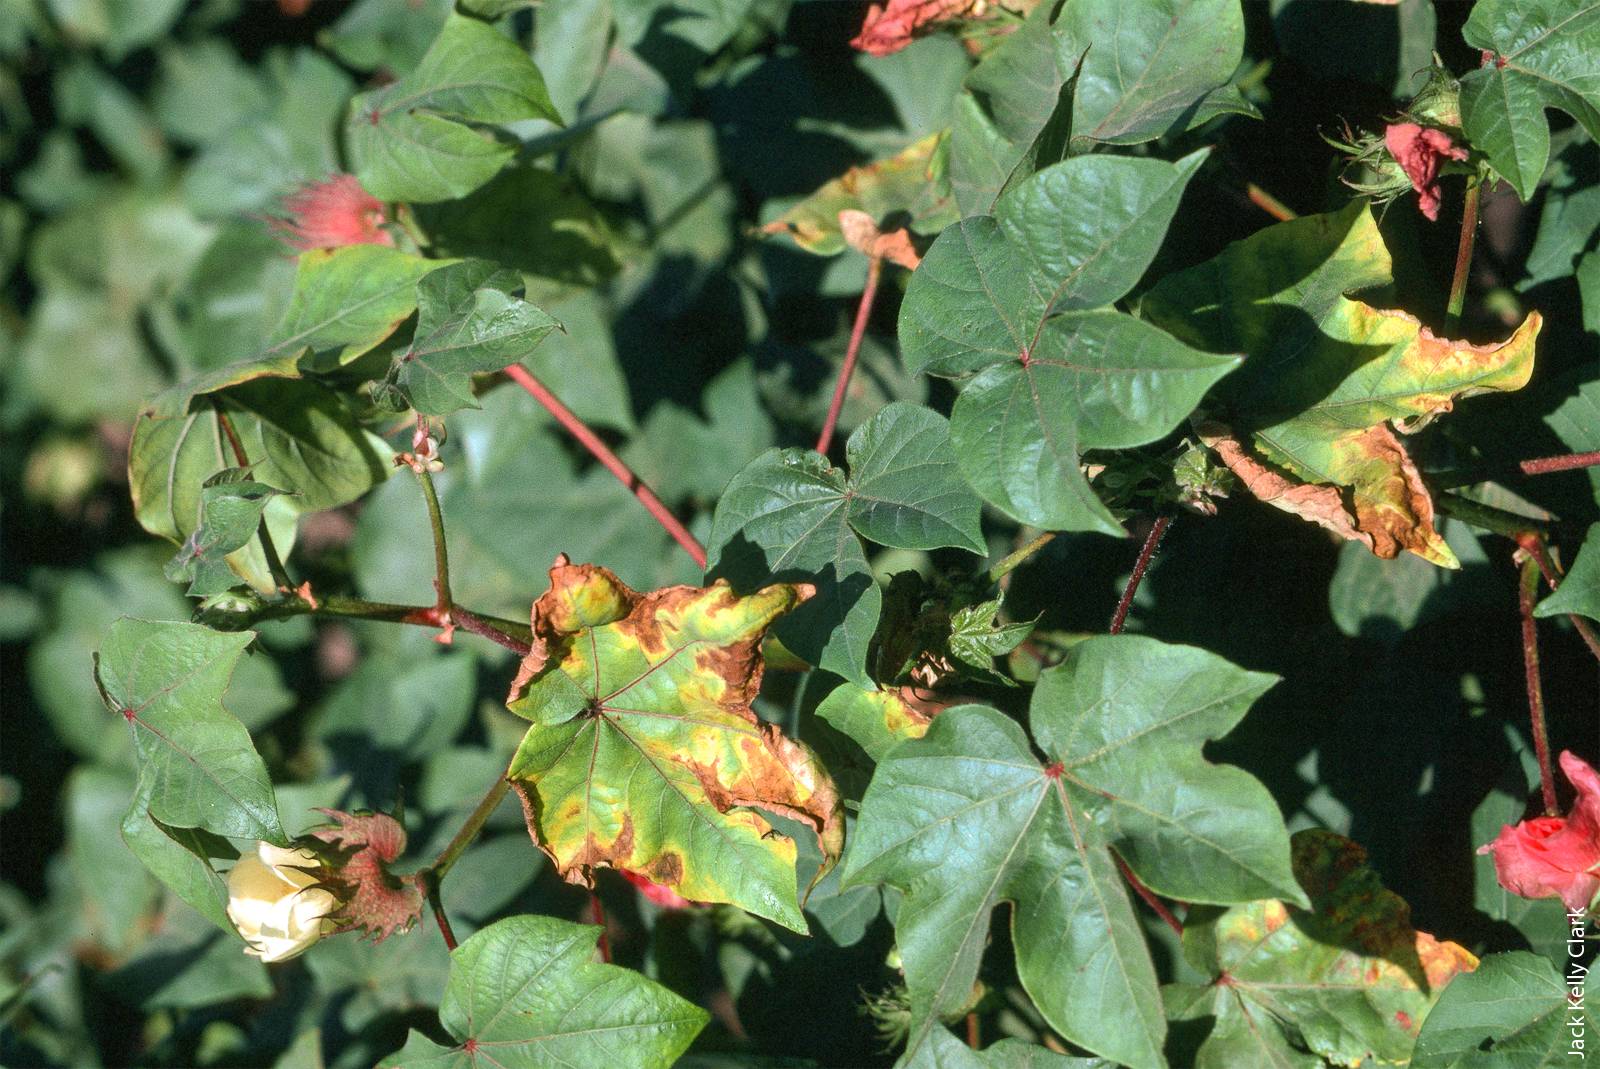
Soil testing can be used to assess nutrient availability and determine fertilization rates. The foliage damage in this cotton plant was caused by a potassium deficiency.
Soil tests as tools
To be useful, the results of a specific soil test need to be calibrated with the yield response (Mikkelsen 1955). Critical yield response values commonly used in California are given in table 1 for select annual crops. The calibration is done by comparing the yields of a fertilized plot and an unfertilized control. The yield response from many fields is then plotted against the soil test values of those fields, and the soil test values at which a yield response is likely versus unlikely are determined (fig. 1). Based on these results, fertilization recommendations can be developed in rate trials on responsive sites.
For meaningful test results and their correct interpretation, it is important to take a representative sample of the field and to be aware of what soil tests measure and what their limitations are.


Fig. 1. Example of a field calibration of the Olsen P test for cotton conducted in the San Joaquin Valley. Each dot represents one field trial. The study concluded that a response to P fertilization is likely when the Olsen P value is below 5.2 parts per million (ppm) and unlikely when the value exceeds 7.8 ppm (redrawn from Mikkelsen 1955).
Misconceptions about soil tests
Many growers and crop advisers lack confidence in soil test results — at least partly due to prevailing misconceptions about what information they provide and how it should be interpreted.
For example, soil tests do not represent all pools of nutrients available to crops, which may limit their accuracy in some soil types. Furthermore, soil test values are an index of nutrient availability and cannot be used to calculate the amount of available nutrients in pounds per acre.
Nonetheless, with a good understanding of soil chemistry and laboratory methodology, soil test values can be interpreted correctly for specific fields and cropping systems and can be combined with other tools and approaches to make informed decisions about P and K fertilization rates.
Soil P pools and availability
Phosphorus exists in soil in many different forms, which greatly differ in their plant availability (Fixen and Grove 1990). Plant roots take up P in the form of phosphate (H2PO4− or HPO42−) from soil solution. Generally less than 1 pound per acre, or less than 1% of the total quantity of P in the soil, is in soil solution (Pierzynski 1991). Therefore, soil solution P needs to be replenished constantly during the growing season to meet the demand of crops.
Phosphate in soil solution is in equilibrium with phosphate adsorbed to the surface of minerals or bound to cations. Depending on solution P concentrations, reactions with minerals and cations may replenish the solution P pool or bind solution P. The strength of the interactions between phosphate and minerals varies. Weakly bound P equilibrates rapidly with the soil solution and replenishes solution P. This pool is often called labile P. Over time, labile bonds may be transformed into stronger bonds resulting in precipitation of low-available P minerals. In contrast, P may be released from the nonlabile pool and become plant available (Pratt and Lippert 1986).
The primary cations involved in these reactions with phosphate are calcium (Ca2+), aluminum (Al3+) and iron (Fe3+). In neutral and alkaline soils, different forms of Ca-phosphate most strongly determine P concentration in solution, and thus P availability. In acidic soils, P solubility is mainly controlled by interactions between phosphate, Al and Fe ions (Pierzynski et al. 2005). Phosphorus availability is generally highest in slightly acidic soils with a pH around 6.5 (Stevenson and Cole 1999).
One- to two-thirds of the P in mineral soils is in the organic form (Condron et al. 2005; Sharpley 1985). Mineralization of organic P is mediated by soil microorganisms and can significantly contribute to the P nutrition of plants (Oehl et al. 2001). Many different forms of organic P are found in soil, their availability ranging from very labile to highly recalcitrant.
Traditionally, fertilizer application rates have been expressed in units of P2O5, which is not a form of P found in soil. Elemental P is converted to P2O5 by a multiplication factor of 2.29.
Soil P tests
Because of the low solubility of major P forms, the concentration of P in soil solution is generally low and not a good measure of P availability. Soil P tests aim to extract solution P and the labile inorganic P pool. Due to the complexity of the soil P pools, it is not possible to determine the exact amount of P that will become plant available during the season. Instead, soil tests provide an index of the labile plant-available P in a soil (Fixen and Grove 1990) by extracting a fraction of the P in the soil that has been found to be correlated with the yield response of crops to P fertilization (fig. 1). As this fraction is not identical to plant-available P, soil test results cannot be used to calculate the available P in pounds per acre and compare this value with the P demand of a crop.
The two most commonly used soil tests in California are the Olsen and Bray-P1 tests. Both tests measure solution P and extract labile fractions of phosphates of Ca, Al and Fe. The contribution of these different pools to the P extracted differs due to differences in pH and chemical composition of the extractant (Beegle 2005).
The Olsen P method uses a sodium bicarbonate solution adjusted to a pH of 8.5 (Olsen et al. 1954). This test is widely used in soils with a mildly acidic to alkaline pH (Gavlak et al. 2005). The Bray-P1 test uses an acidified ammonium fluoride solution with a pH of 2.6 to extract P (Bray and Kurtz 1945). The Bray-P1 soil test is often used in acid to neutral soils (Gavlak et al. 2005).
For both tests, however, the optimal pH range is soil-specific. Some studies have reported that the Olsen P test performed reasonably well in acidic soils (John et al. 1967; Smyth and Sanchez 1982). Similarly, in some alkaline soils, the Bray-P1 test is well correlated with the Olsen P test (Ebeling et al. 2008). In California, the Bray-P1 test is generally used in soils with a pH below 6.0 and the Olsen P test in soils with a pH of 6.0 or higher (CPHA 2002).
As these soil tests extract different fractions of the labile P pool, it is best to use the same test over the years for the same field, so that the results can be compared with the values of previous years. With both tests extracting adsorbed inorganic forms of P, they tend to underestimate P availability in soils with a high soil organic matter content, where the mineralization of organic P may contribute considerably to the available-P pool (Steffens et al. 2010).
Soil K pools and availability
Plants take up K in the form of K+ from soil solution. Soluble K is only a small pool that is constantly replenished by exchangeable K and to some degree by stable, or nonexchangeable, K (Römheld and Kirkby 2010). Potash (K2O), which is used for fertilizer application rates, is not a form of K found in soil. Elemental K is converted to K2O by a multiplication factor of 1.2.
Exchangeable K is held on negatively charged sites of clay minerals and soil organic matter. It is in equilibrium with K in soil solution, being released when the concentration of K in solution is low, for example, due to plant uptake (Römheld and Kirkby 2010). The capacity of a soil to exchange K and other cations such as Ca2+, sodium (Na+) and magnesium (Mg2+) is reflected in its cation exchange capacity (CEC). Solution K and exchangeable K represent the available-K pool.
Most K in soil is present as a component of primary minerals (structural K) or fixed in clay minerals and not immediately available. Available K may be fixed in some soils by clay minerals and thus made unavailable. In California, K fixation occurs in some soils formed from Sierra Nevada alluvium, located on the east side of the San Joaquin Valley. In contrast, soils formed in Coastal Range alluvium do not fix K, except to a small extent in deeper horizons. In general, K-fixing soils are either weakly developed soils with high mica content or intermediately developed soils with high vermiculite clay mineralogy (Pettygrove and Southard 2003).
As much as 80% of applied K can be fixed and become temporarily unavailable to plants (Cassman et al. 1990; Hartz et al. 2002). Nonexchangeable K becomes only slowly plant available. However, there is no clear boundary between exchangeable and nonexchangeable K (Öborn et al. 2005). Depending on the minerals present and their weathering stage, nonexchangeable K can contribute significantly to plant supply (Kuhlmann and Wehrmann 1984; Öborn et al. 2005; Wang et al. 2011).
Potassium is readily available from crop residues, as it is not incorporated into organic molecules in plant tissue. It can be released from residues even before they decompose.
Soil K tests
In California, soil K availability is most often determined from soil samples by extraction with an ammonium acetate solution at neutral pH (Allen et al. 1994). This procedure extracts soil solution K, exchangeable K and possibly a small proportion of the nonexchangeable pool (Haby et al. 1990). While soil solution K and exchangeable K can be determined accurately, soil tests may not always extract the fraction of the nonexchangeable K that becomes crop available (Rengel and Damon 2008; Römheld and Kirkby 2010). Soil tests measuring exchangeable K are a significantly less precise measure for yield response in K-fixing soil (Cassman et al. 1990; Rees et al. 2013).
Soil test sampling
One of the most challenging aspects of soil testing is to ensure that the sample taken is representative of the field. A test result from a nonrepresentative sample has little value.
Taking a representative sample
Most commonly, soil cores are taken from the entire area of the field or management area in a W-shaped sampling pattern or by walking a zigzag course around or through the area (fig. 2). Atypical areas, such as corners or edges of former fields or fencerows that are now in the field, should be excluded (Pennock et al. 2008). To capture the variability within fields, it is generally recommended to take 20 to 30 cores from random locations within each field (James and Wells 1990). The composited cores should be thoroughly mixed and submitted for laboratory analysis following instructions of the lab where samples are submitted (Pennock et al. 2008).

Fig. 2. Soil sampling plan to obtain a representative sample from a field or management area. The sampling points are shown on a Google map using the SoilWeb application (available at casoilresource.lawr.ucdavis.edu/soilweb/ ). The two soil series, Brentwood silty clay (BrA) and Myers clay (MS), are best sampled separately.
Soil test results can vary depending on the time of the year the samples are taken (Childs and Jencks 1967). Samples for P and K are best taken in late fall or early spring. They should not be taken when fertilizer has been applied recently. To monitor trends in nutrient availability over the years, it is important to always take samples during the same season and from the same depth. In annual crops, the top 12 inches are generally sampled. Taking samples to the same depth is especially important for P because P moves very slowly down the profile due to its immobility in soils (Beegle 2005).
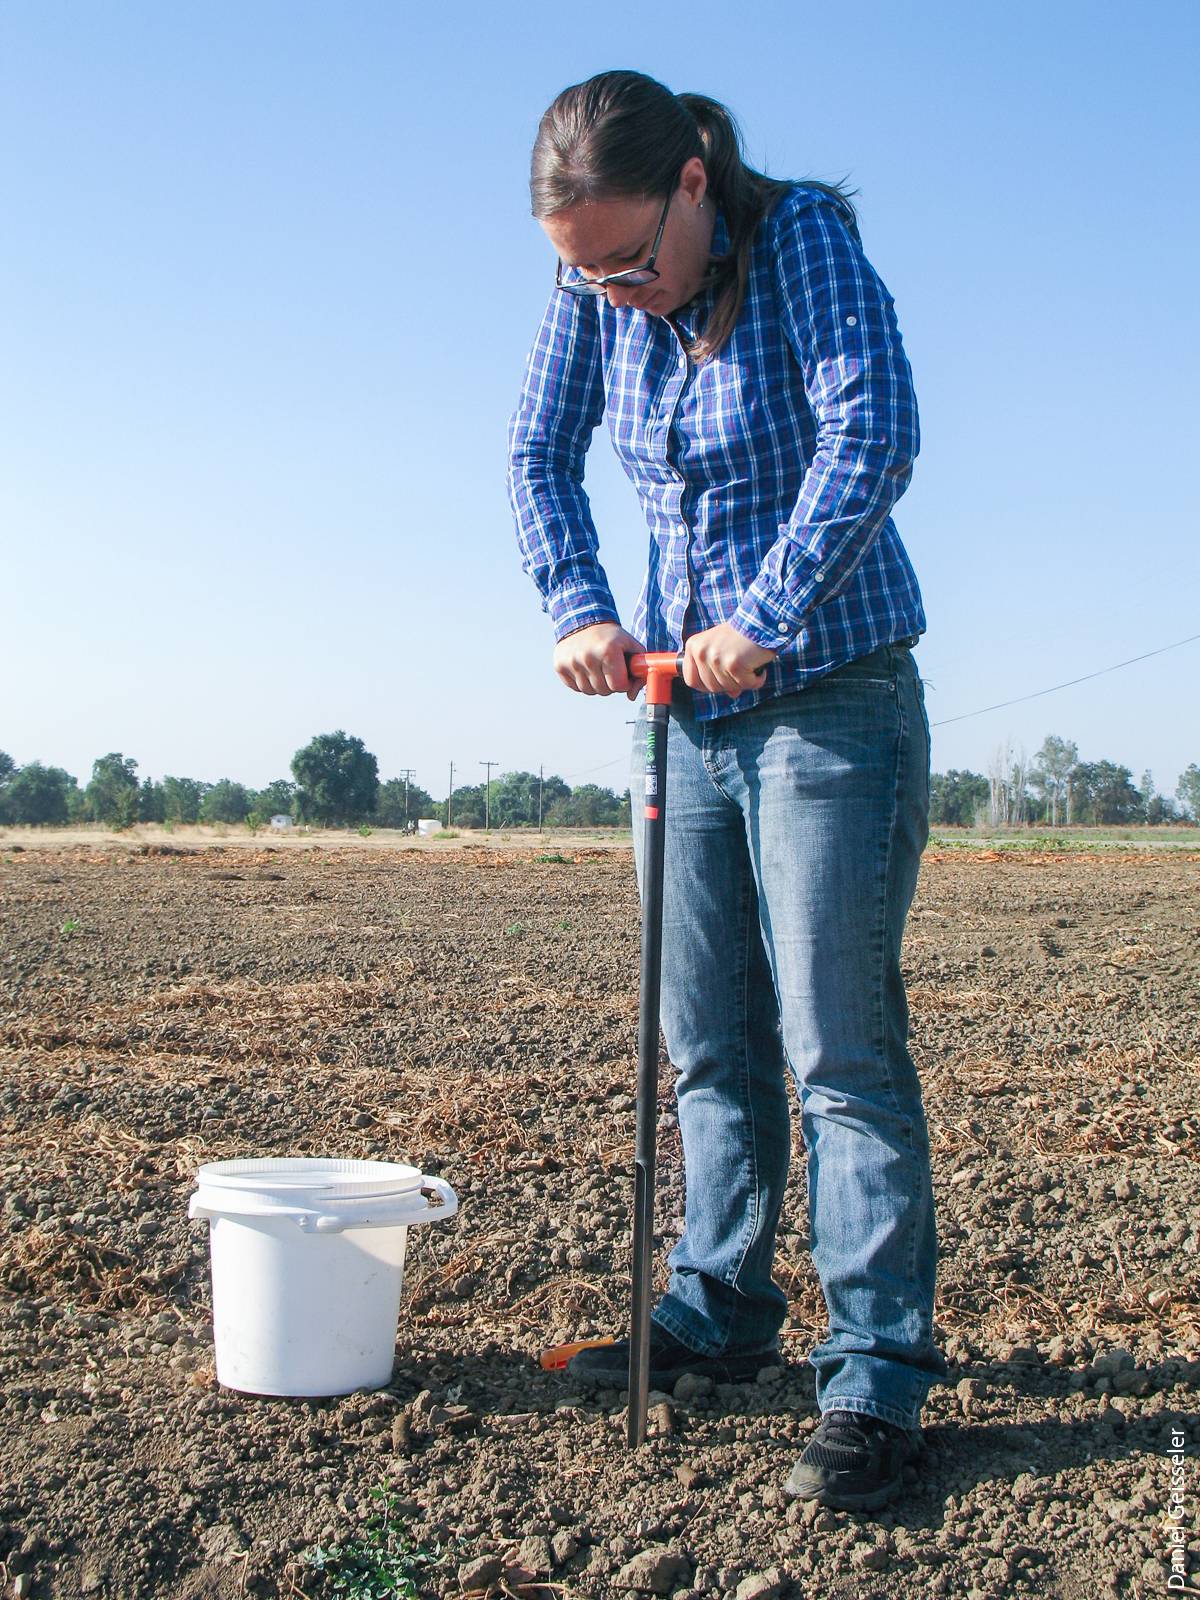
UC Davis researcher Patricia Lazicki takes a soil sample from a field in the fall after harvest of the crop. To obtain a representative sample, it is generally recommended to take 20 to 30 cores from random locations within a field.
Spatial variability
Even when care is taken to collect a representative sample, the results of the soil test may still not be very useful when the field is not uniform. When soil properties, past management, plant development or yield history differ within a field, the field should be divided into different management areas with similar characteristics, and a sample from each area should be taken (fig. 2). A convenient way to check for differences in soil properties is to use the interactive application SoilWeb (available at casoilresource.lawr.ucdavis.edu/soilweb/ ).
The immobility of P also means that banded P can result in fairly long lasting zones of high P test values in no-tillage systems (Beegle 2005). If the location of the band is known, it is generally recommended to take one core from the band for every 20 cores taken. More often than not, the exact location of the bands is not known. In this case, twice as many cores from random locations in the field should be taken compared to the number taken from a field without fertilizer bands.
Sampling drip-irrigated fields
Some special considerations apply to drip-irrigated fields. With subsurface drip irrigation, the active root zone from which crops draw most nutrients is confined to the region wetted by the drip tape. With the soil volume explored by roots being limited, the potential for a positive response to nutrient application is increased (Hartz et al. 2005; Hartz and Hanson 2009). Therefore, critical soil test values may be higher for drip systems than for furrow-irrigated fields.
Due to the restricted soil volume roots have access to, nutrient concentrations can vary considerably across the bed with distance from the drip line. Depending on the amount of nutrients applied relative to crop uptake and their mobility in soil, nutrients may accumulate or be depleted around the emitters (Carrijo and Hochmuth 2000; Hartz 2008; Palacios-Diaz et al. 2009).
A recent study in drip-irrigated tomato fields found that the variability across the bed can be captured by taking more than one core from the top 20 inches at each sampling location within a field — for example, taking three cores at a distance of 5, 10 and 20 inches from the drip tape in the center of a 60-inch bed (Lazcano et al. 2015). The cores can be pooled for analysis.
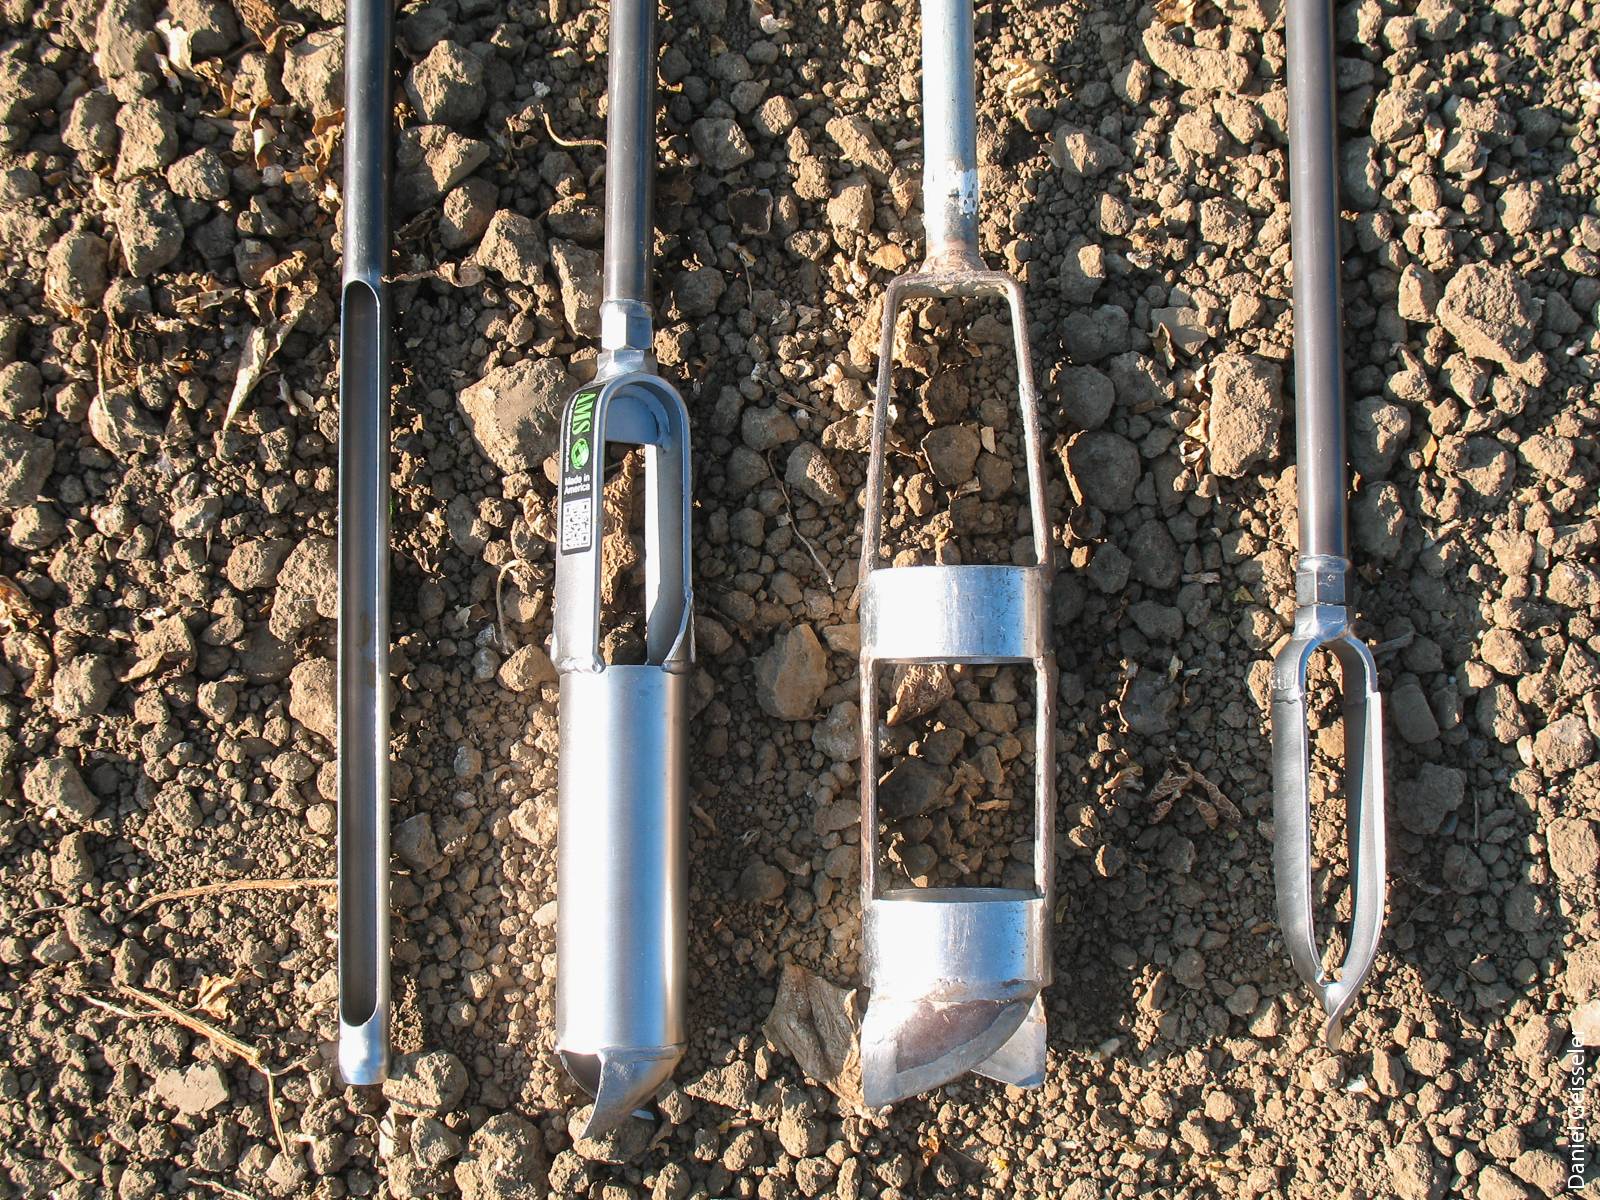
Different tools are available for soil sampling, including (left to right) soil probe, closed bucket auger, open bucket auger and Dutch auger. Under most conditions, the standard soil probe is the best option for most alluvial cultivated soils. Bucket augers work well in stony soils. Open bucket augers are useful in wet clay rich soils. Dutch and Edelman augers may be a better choice than soil probes in stony soils and soils where woody roots are present.
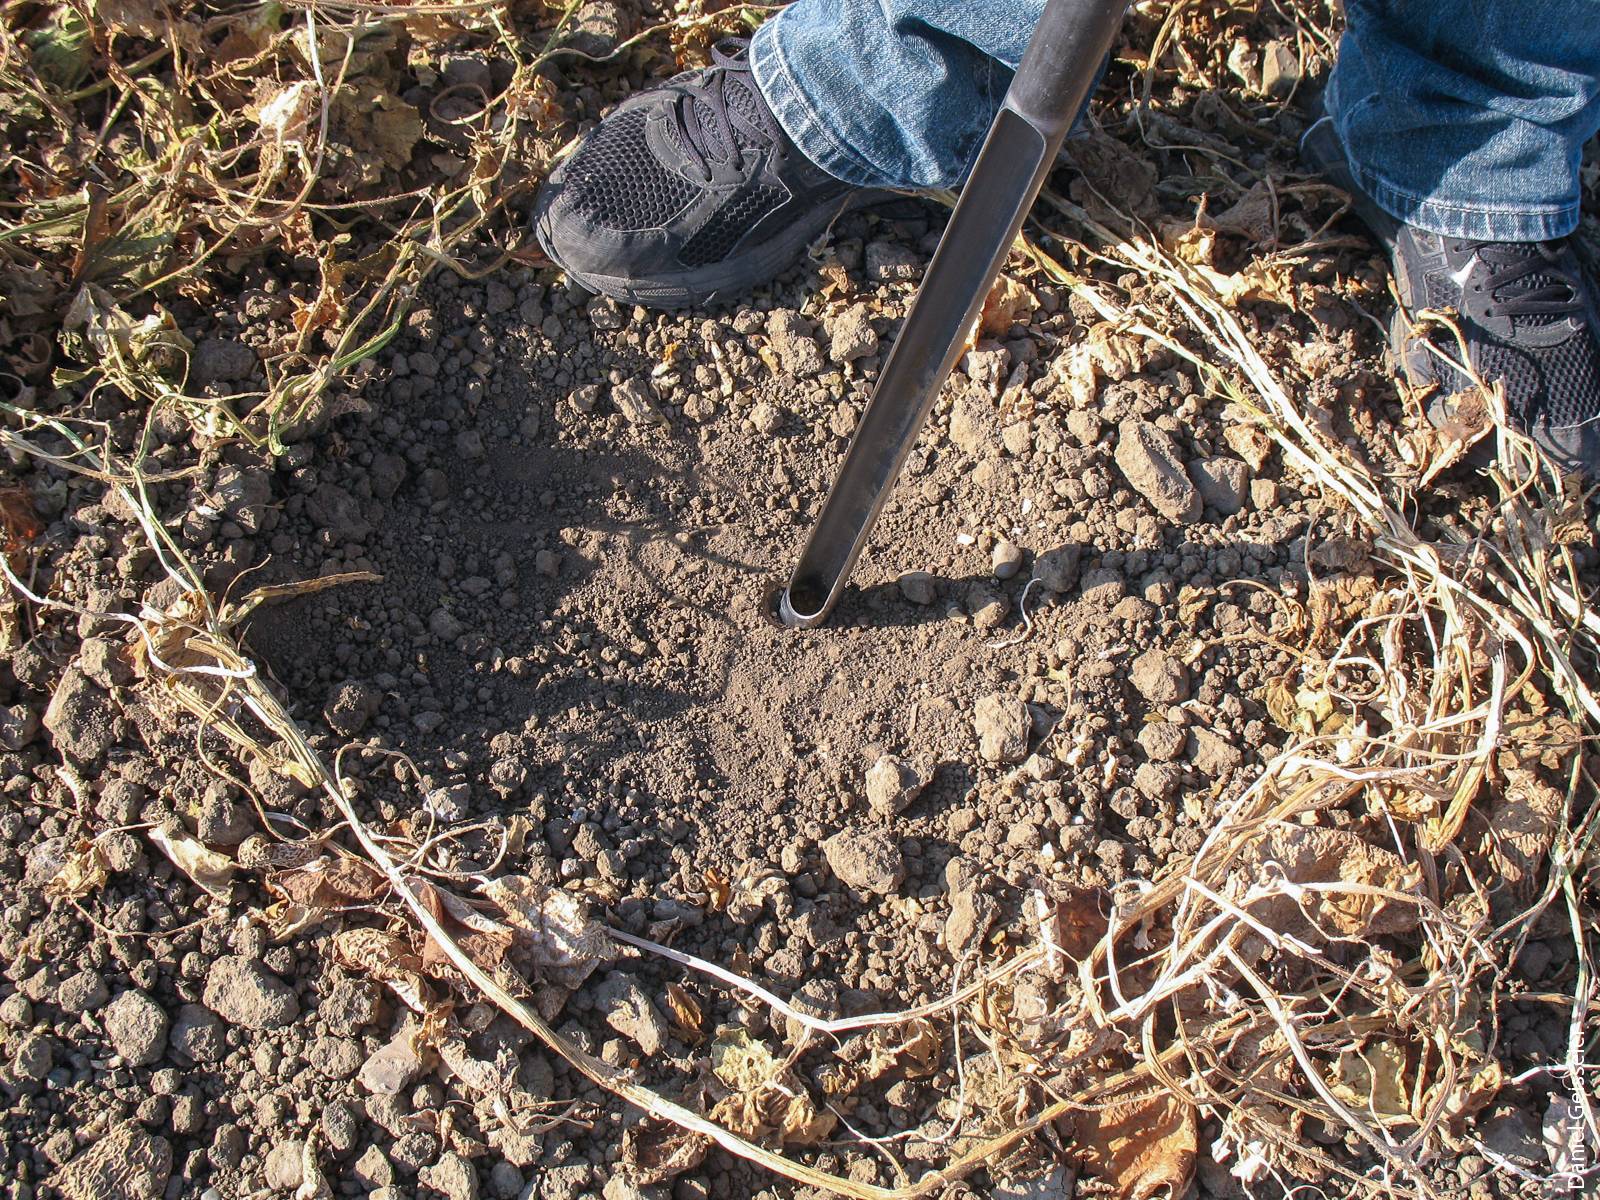
Residue on the soil surface needs to be removed before the soil sample is taken.
Limitations of soil tests
Soil tests cannot capture all the factors that determine the efficiency with which crops acquire nutrients from the soil, such as crop species, variety and the effects of soil properties on root growth (Cassman, Roberts, et al. 1989; White 2013). For example, rooting depth and root density determine how well a plant can access the pool of potentially available nutrients in the tested layer and in the subsoil (Gahoonia and Nielsen 2004; Richardson et al. 2011; Samal et al. 2010).
Depending on the distribution of nutrients in the soil profile and rooting depth, crops may take up a considerable proportion of nutrients from the soil below the sampled layer. Winter wheat, for example, has been found in one study to acquire 50% of its K from the subsoil (Kuhlmann and Barraclough 1987). Furthermore, nutrient availability, especially that of P, depends on soil temperature, decreasing in cool soils (Johnstone et al. 2005).
Phosphorus values in soil taken after a crop of lowland (flooded) rice are not reliable because drainage of flooded soils increases amorphous iron oxide levels and P immobilization (Sah and Mikkelsen 1986). A field study on major rice soils in California found that wheat and barley grown following lowland rice may suffer P deficiency despite soil test values above the critical level (Brandon and Mikkelsen 1979).
Differences among labs
Test results and fertilization recommendations obtained for a field sample may differ considerably among labs (Follett et al. 1987; Jacobsen et al. 2002). Proficiency testing programs allow labs to monitor the accuracy of their analytical methods, but test results can be affected by sample handling and preparation before analysis.
The amount of P extracted is affected by the speed and time of shaking, as well as the temperature of extraction. This may contribute to some differences among soil test labs (Schoenau and O'Halloran 2008). In the case of K, shaking time may affect the amount of K extracted with ammonium acetate (Haby et al. 1990). Exchangeable K is generally determined on air-dried soils. Air drying and how the samples are dried may have a variable effect on soil test K values (Haby et al. 1990; Khan et al. 2013).
Preparation of samples, including drying, grinding and extraction can be time consuming, so soil test labs may use procedures that reduce processing time, which in turn may lead to significant differences in the test values among labs. Furthermore, some soil test labs use multi-element extractants that allow a determination of P, K and other nutrients in the same extract (Allen et al. 1994). An equation is then used to convert the results to Olsen P or ammonium acetate extractable K. While the correlation between two soil tests may be quite good across a large number of samples, some fields may not follow the general trend (Burt et al. 2002).
The variability among labs makes it hard to detect long-term trends in nutrient availability when labs are changed repeatedly over the years. However, reliable labs should be consistent within and among years.
Using soil tests with other tools
Because of the limitations of soil tests described above, nutrient management decisions should not be based solely on test results. Soil tests are a valuable tool for assessing nutrient availability in annual crops, but to accurately evaluate the nutrient availability in a field and to determine optimal fertilizer rates, they are best combined with other tools, such as plant tissue analysis, nutrient budgets and on-farm strip trials.
Plant tissue analyses
While soil testing identifies potential nutrient deficiencies before planting, plant analysis allows in-season monitoring and, depending on the time of sampling, adjustments to the fertilizer program (Westfall et al. 1990).
As is the case with soil testing, the validity and usefulness of plant tissue analyses rely on representative sampling and proper sample handling (Jones and Case 1990). Furthermore, the concentration of elements can change rapidly with time and plant developmental stage, so tissue samples need to be taken at a stage for which critical values have been established (Munson and Nelson 1990). The concentration of elements is also affected by cultivar, cultural practices and environmental conditions (Munson and Nelson 1990; Westfall et al. 1990).
Plant tissue tests do not detect excess soil P supplies (Mallarino 1995; Mallarino and Higashi 2009). In contrast, they do show excess soil K: vegetative tissue K concentrations tend to increase in the presence of excess soil K, a process known as luxury consumption (Hawkesford et al. 2012).
Nutrient budgets
Large amounts of P and K can be removed with harvested crops. To maintain adequate nutrient availability over the years, the input of nutrients needs to balance nutrient exports. A nutrient budget, in its simplest form, compares fertilizer inputs with the amount of nutrients removed with harvested crops (output). The nutrient concentrations in harvested plant parts and the amounts of P and K removed from the field at harvest are listed in tables 2 and 3 for select annual crops.
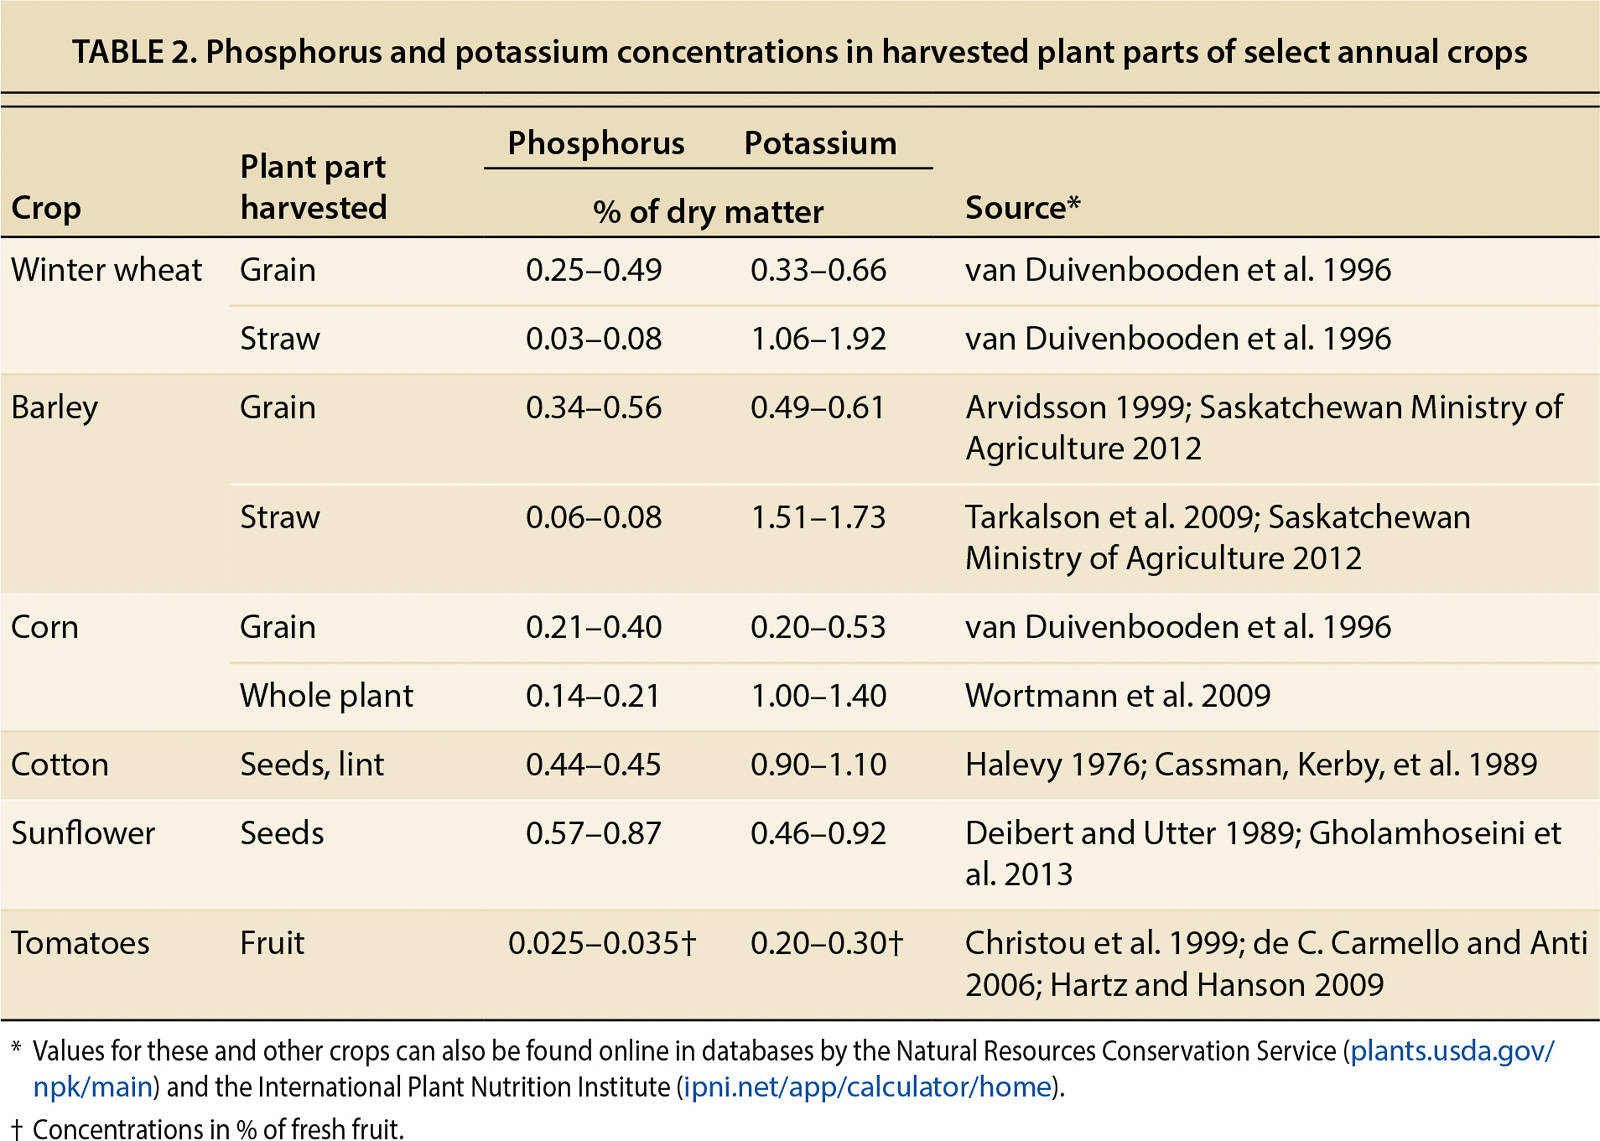

TABLE 3. Estimated phosphorus (as P2O5) and potassium (as K2O) removed from field with harvested crops based on average yields in California
Nutrient budgets are less reliable for soils where large losses may occur or for high-fixation soils. In general, losses of P and K are minor. There are some exceptions where losses can be significant. Phosphorus is lost from fields with surface runoff or when erosion takes place (Sharpley et al. 2000). Phosphorus leaching losses can be significant in fields with a history of high manure or fertilizer applications, which lead to an accumulation of P in the profile (Brock et al. 2007; Fortune et al. 2005; Hartz and Johnstone 2006; McDowell et al. 2001).
Potassium can be leached in soils with a very low CEC (Wulff et al. 1998). The CEC of a soil mainly depends on its clay content, the dominant clay minerals present and the soil organic matter content. In California, with the exception of very sandy soils with a low soil organic matter content, the CEC is generally sufficient to prevent K leaching even when large amounts of fertilizer are applied. Potassium may also be leached in very clay-rich soils when cracks are present, allowing K in soil solution to bypass exchange sites (Alfaro et al. 2004).
On-farm trials
For some crops, on-farm trials have led to the development of optimal fertilizer application rates based on soil test results (e.g., Miller et al. 1996). On-farm trials give growers the opportunity to evaluate different application rates on a limited area under field- and farm-specific conditions, such as soil types, climate, crop variety and crop management (Hicks et al. 1997). Based on the results, growers can then decide whether to adopt these rates on part or all of the acreage (Hicks et al. 1997).
Application rates can be tested in small plots or field strips. Field strips are generally more convenient to establish and manage (Hancock 1992). A uniform and representative part of the field needs to be chosen for the trial. The field should not be deficient in other nutrients. Except for the different fertilizer rates, the strips are managed identically. The strips should be large enough so that field equipment can be used for all operations. The strips should also be wide enough to permit harvesting, soil testing and plant tissue sampling from an area that is not affected by the management in the rest of the field (Hancock 1992). For fertilizer trials in row crops, it is generally suggested that the strips be at least two rows wider on each side than the harvested area. When the comparison includes foliar fertilizers, the border area may need to be wider.
The simplest trial includes two treatments, the new application rate and the normal practice, which serves as the control. When the goal of the trial is to determine whether P and K fertilization is beneficial, fertilizer is applied to a single strip in a field that is otherwise not fertilized; the application rate could be the amount generally removed with the harvested crop. If the goal is to determine whether the normal annual application rate is adequate, one or several different rates can be applied to strips — for example, 20 pounds P2O5 per acre or 50 pounds K2O per acre more or less than the rest of the field.
When possible, the treatments should be replicated, either by establishing several strips with the same treatment in one field or repeating the trial in several fields. The decision whether to include replicated strips as well as the size of the test strips depends on how readily the results will be accepted. Carrying out a trial is meaningful only if growers feel comfortable enough adjusting their management when the trial shows that the new practices are superior.
Future research
Research addressing the following issues will help increase the value of soil testing. Current soil tests extract inorganic forms of labile P. Development of tests that can assess the mineralization potential of organic P would greatly improve the value of testing in soils with a high organic matter content and in production systems where mineralization of organic P amendments, such as animal manures and composts, contribute significantly to the plant-available P pool.
Standard soil K tests are not accurate predictors of fertilizer K availability in K-fixing soils. Much progress has been made recently identifying K-fixing soils in California. A soil test that can accurately and reliably determine the K fixation potential of a soil, yet is simple enough to be adopted by commercial soil test labs, still needs to be developed. An improved understanding and quantification of the capacity of different crops to access nonlabile K would further improve the value of soil testing, not just in K-fixing soils.
Under drip irrigation, the wetting pattern and thus the zone where roots have access to nutrients is more limited than under furrow- or flood-irrigated systems. To ensure appropriate interpretation of soil test values in drip-irrigated fields, current critical soil test values may need to be reevaluated. In addition, there is a need to refine nutrient response curves to soil test values to ensure appropriate application rates.
Test procedures and resulting values among commercial labs may differ, making it difficult for growers to compare the results with published critical values. The industry might benefit from routine comparisons of soil test values reported by different commercial labs: the samples would be taken from selected field sites, require sample preparation before analysis and preferably be blind submissions. Such a program might increase standardization of methods and raise awareness of differences among labs.
Soils differ in their capacity to supply nutrients to crops. Despite its limitations, soil testing is a cost-effective way to assess nutrient availability for specific fields. With the information provided in this article, growers and crop advisers can use soil testing for fertilization decisions that result in efficient and sustainable use of fertilizers.
Citations
Soil testing for P and K has value in nutrient management for annual crops

