


All Issues
Mapping forests with Lidar provides flexible, accurate data with many uses
Publication Information
California Agriculture 69(1):14-20. https://doi.org/10.3733/ca.v069n01p14
Published online January 01, 2015
Abstract
The use of remote sensing for forest inventory, fire management and wildlife habitat conservation planning has a decades-long and productive history in California. In the 1980s, mappers transitioned from aerial photography to digital remote sensing, in particular Landsat satellite imagery, which still plays a significant role in forest mapping, but today mappers increasingly rely on Lidar analysis. In California, where forests are complex and difficult to accurately map, numerous remote sensing scientists have pioneered development of methodologies for forest mapping with Lidar. Lidar has been used successfully here in a number of ways: to capture forest structure, to map individual trees in forests and critical wildlife habitat characteristics, to predict forest volume and biomass, to develop inputs for forest fire behavior modeling, and to map forest topography and infrastructure. Lidar can be costly to acquire and difficult to analyze, but as costs decline and new data processing methods are developed, it is likely that forest managers who need detailed information on forest structure across large spatial scales will incorporate Lidar data into their mapping toolkits.
Full text
Mapping has always been critical for forest inventory, fire management planning and conservation planning. In California, these tasks are particularly challenging, as our forests exhibit tremendous variability in composition, volume, quality and topography. Also, California is a fire-prone state, and our forests are used by a large number of important wildlife species. Perhaps it is due to this natural complexity that researchers have focused on California forests to pioneer solutions to many of the difficult problems in remote sensing.

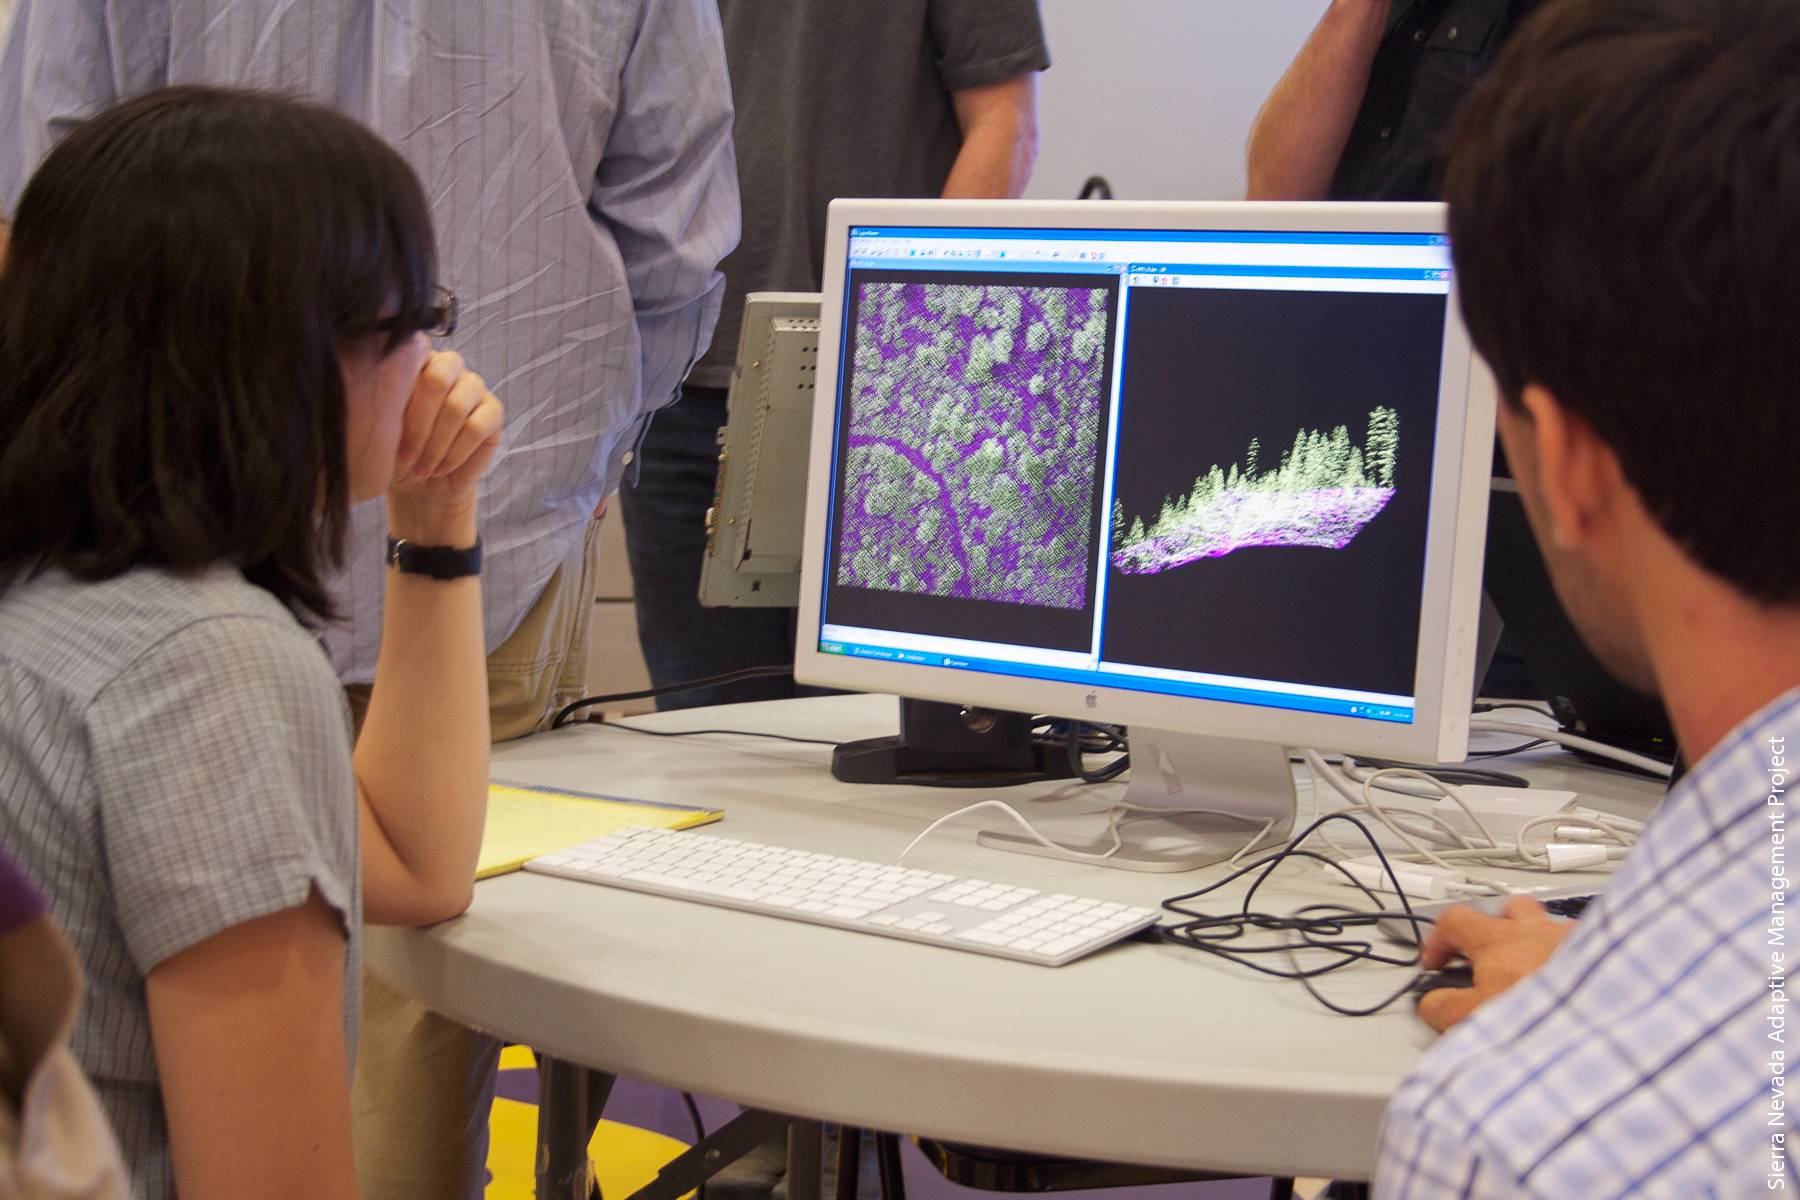
Collections of Lidar points show trees in the Sierra National Forest, where much of the research on remote sensing has occurred.
Prior to about 1980, forest inventory and habitat mapping largely relied on manual interpretation of vertical-view aerial photography (Arvola 1978; Colwell 1964, 1965), but the launch of Landsat-1 and Landsat-2 satellites from Vandenberg Air Force Base in California in 1972 and 1975 (Lauer et al. 1997) permanently changed the way forests were mapped. Digital mapping of canopy, phenology and condition over large scales and through time became possible. The early excitement about Earth observation satellites in terms of forestry applications (Colwell 1973; Fritz 1996; Gregory 1971; Strahler 1981) foreshadowed three decades of intense and increasing use of Landsat imagery by land managers, regulatory agencies, scientists and nongovernmental organizations in California to map forest vegetation and mortality, explore forest change detection, map fire severity and map wildlife habitat. Landsat was the workhorse of forest remote sensing before the turn of the century, but advances in sensor design, data processing and information synthesis then revolutionized the field (Wulder et al. 2003).
The MODIS satellite was launched in 1999, making it possible to study forests at a global scale at a temporal resolution not available before (Lefsky 2010; Running et al. 2004). At the local scale, high-resolution stereo-matched optical imagery was used to map forest structure (Gong et al. 1999; Gong et al. 2000; Sheng et al. 2001; Sheng et al. 2003). Landsat-8, launched in 2013, and high-resolution optical sensors such as Worldview-2 and ?3 continue to be useful for forestry. But more recently, Lidar (light detection and ranging) has become an operational, accurate and reliable tool for detailed mapping of forests.
Lidar technology
Lidar is an active remote sensing technology used to measure distances with high accuracy. This technology provides horizontal and vertical information at high spatial resolution and vertical accuracies, offering opportunities for enhanced forest monitoring, management and planning (Dubayah and Drake 2000; Lim et al. 2003; Reutebuch et al. 2005). Lidar systems for forestry are classified according to the platforms they are mounted on (airborne, spaceborne or ground based), on the way returned signals are recorded (discrete return or full waveform) and on the footprint size (i.e., the horizontal illuminated area) — a small footprint covers ? 3 feet (? 1 meter) or less, a large footprint covers tens of meters. The most common Lidar systems used today are small-footprint, discrete return laser scanners mounted on aircraft (although this is rapidly changing). The laser scanner measures distances to a target by emitting pulses at rapid frequency, up to 150 kilohertz (kHz), and recording the time it takes for each pulse to complete the distance from the scanner to the object and back to the scanner.
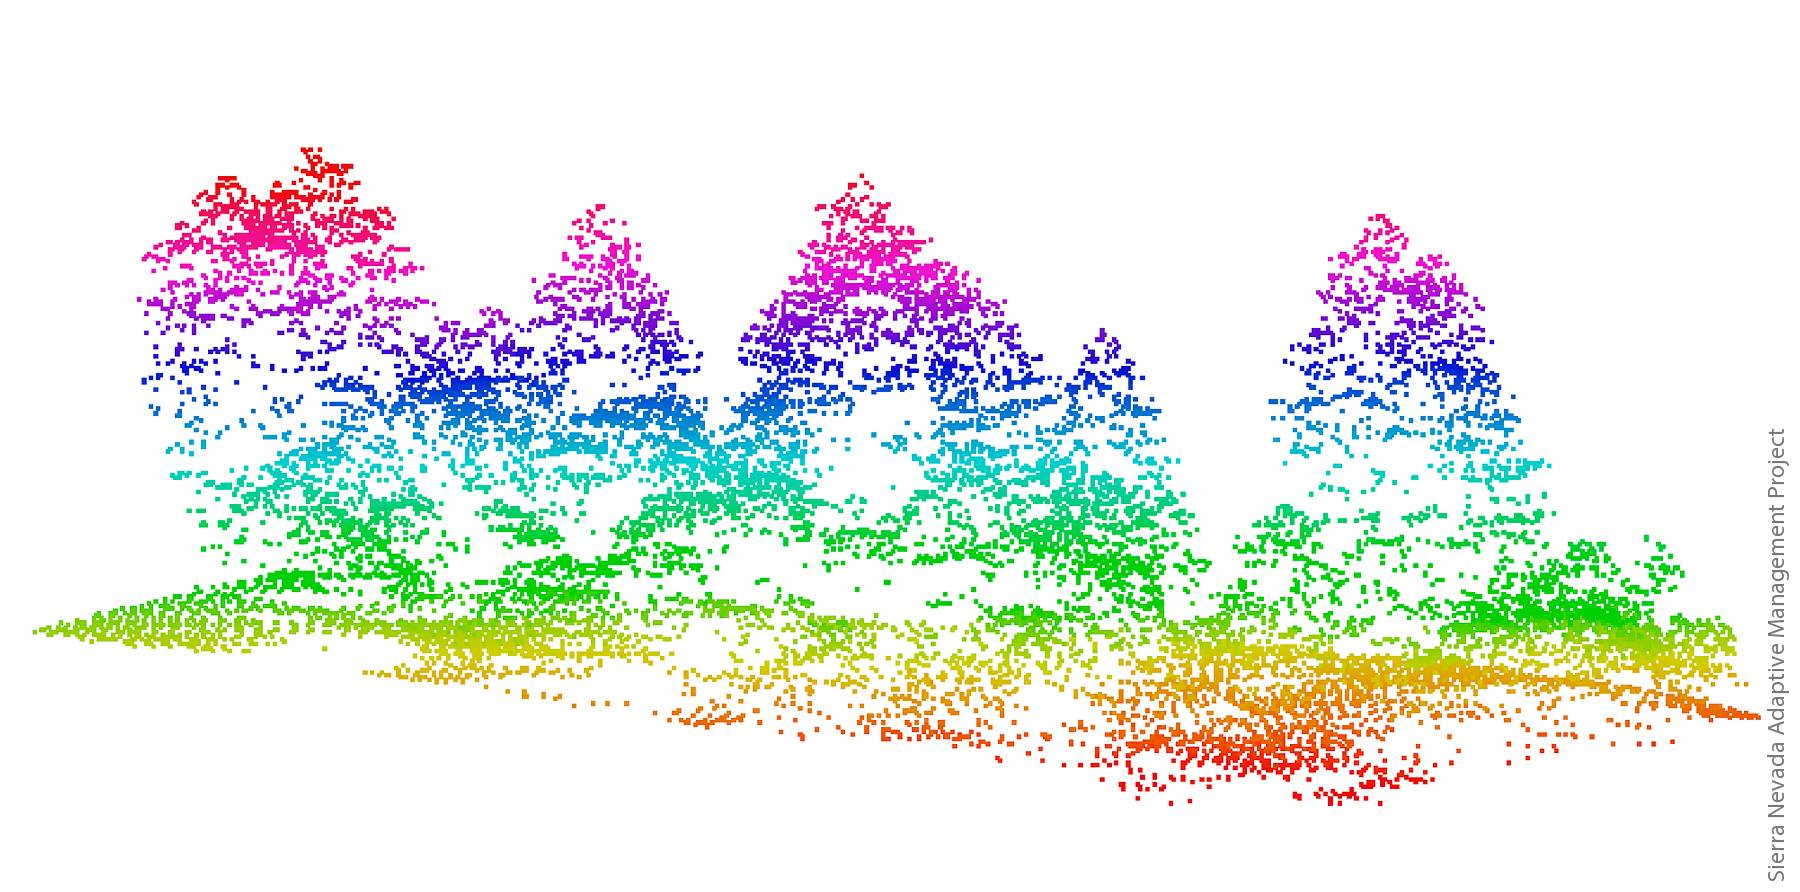
Each Lidar point represents a pulse return, encoding its location and its height above sea level by color. The technology can delineate individual trees in oak savanna and mixed-conifer stands.
Airborne laser scanning systems have four major components: a laser scanning unit, a global positioning system (GPS), an inertial measurement unit (IMU) and a computer to store data. The first three components yield the precise time and the position of the laser unit when each pulse is emitted. With discrete return Lidar systems, multiple returns (up to five) from a single outgoing pulse can be recorded to produce vertical information about vegetation above the ground as well as at the ground surface. The result is a dense, three-dimensional point cloud representing the vegetation and ground surface topography of the surveyed landscape.
Full waveform Lidar systems record the entire waveform of the reflected laser pulse, not only the peaks as produced by the discrete multiple return Lidar systems. The reflected signal of each emitted pulse is sampled in fixed time intervals, typically 1 nanosecond (ns), equal to a sampling distance of 6 inches (15 centimeters) at a typical flying height. This provides a quasi-continuous, extremely high-resolution profile of the vegetation canopy structure, making it suitable for wildlife habitat mapping and the analysis of vegetation density, vertical structure and fuels analysis. The downside of the waveform technology is the huge amount of data that needs to be stored and processed; full waveform data sets drastically increase processing time and complexity compared with discrete data, and there are fewer commercial software packages designed to process full waveform data over large project areas.
Lidar use in California forests
Since about 2000, Lidar has been increasingly used by researchers to map California forests. Lidar has been used successfully to capture forest structure, to map individual trees in forests and critical wildlife habitat characteristics, to predict forest volume and biomass, to develop inputs for forest fire behavior modeling and to map forest topography and infrastructure. We reviewed 24 peer-reviewed papers covering this research (table 1). Some papers focus on oak woodlands and savannas (Chen et al. 2006; Chen et al. 2007) and coast redwood (Chen 2010; Gonzalez et al. 2010), but the majority focus on the conifer and mixed-conifer forests in the Sierra Nevada. The Sierra National Forest is the forest that has been most often remotely sensed in California; nine of the papers we reviewed focused on this forest; it has been mapped with large- and small-footprint, discrete and waveform Lidar, as well as with Landsat, Quickbird and other sensors.
Forest structure.
Understanding the structure of forests — the tree density, volume and height characteristics — is critical for management, fire prediction and wildlife assessment. Optical remote sensors such as Landsat do not provide detailed depictions of forest structure. Several Lidar studies of California forests focus on using Lidar to develop forest structure parameters, such as tree height and trees per acre. There are typically two methods to perform large-scale forest inventory with small-footprint Lidar data: (1) at the scale of individual trees and (2) at the stand or plot scale.
The ability to delineate individual trees from a Lidar point cloud has been proven for heterogeneous and complex forests such as oak savanna (Chen et al. 2006; Chen et al. 2007) and mixed-conifer stands (Li et al. 2012). Delineating the individual trees is done by segmenting the Lidar-derived canopy height model — the raster image interpolated from Lidar points depicting the top of the vegetation canopy (e.g., Chen et al. 2006) — by delineating the trees directly from the point cloud (Li et al. 2012) or by a combination of these methods (Jakubowski, Li et al. 2013). After accurate segmentation, relationships can be derived between Lidar-and field-measured structural attributes such as tree height, crown diameter and canopy base height, which are directly measured, and basal area, diameter at breast height, wood volume, biomass and species type, which are derived by correlations (Chen et al. 2006; Chen et al. 2007).
The development of plot- or stand-scale predictions of forest structure with Lidar requires regression between field data and Lidar metrics derived from the point cloud (e.g., height and height profiles and percentages) that reports overall goodness-of-fit measures (e.g., correlation coefficient R2) and measures of uncertainty (e.g., root-mean-squared error, RMSE). Jakubowski, Guo, Collins et al. (2013) found that many forest canopy structure metrics resolved at the plot scale (e.g., canopy height, canopy base height, canopy cover, basal area) were estimated well with discrete Lidar data (R2 = 0.87 for canopy height).
There is a trade-off between detail, coverage and cost with Lidar. The accurate identification and quantification of individual trees from discrete Lidar pulses typically require high-density data. Jakubowski, Guo and Kelly (2013) investigated the relationship between Lidar pulse density and the ability to predict commonly used forest metrics at the plot scale in Sierra Nevada mixed-conifer forests. Results show that the accuracy of predicted plot-scale metrics remains relatively high until about 0.1 pulse per square foot (1 pulse per square meter). However, higher-density (up to 1 pulse per square foot, or 10 pulses per square meter) data are necessary for metrics related to coverage (e.g., tree density, canopy base height and shrub cover) and for the delineation of individual trees.
Studies using large-footprint, full waveform data for forest inventory in the Sierra Nevada forests have demonstrated the ability of full waveform Lidar to retrieve accurate canopy fuel maps needed for fire behavior modeling (Peterson et al. 2005) and to provide an accurate estimate of leaf area index at multiple spatial scales (Tang et al. 2014). Zhao et al. (2013) compared the abilities of an airborne and a ground-based full waveform system to retrieve foliage profiles in the Sierra National Forest and showed the benefits of integrating terrestrial and airborne Lidar data for a detailed description of forest canopy structure.
Hyde et al. (2006) explored the potential of retrieving accurate canopy height from large-footprint satellite Lidar waveform data over forests in the Sierra National Forest. They focused on the synergic use of Lidar with other sensors, in particular Landsat ETM+, to increase canopy height prediction accuracy. Chen (2010) also used large-footprint satellite Lidar waveform data over forests but concentrated on coastal California forests in Mendocino County (dominated by coast redwood and Douglas fir) and Santa Clara County (coast live oak forest and blue oak woodland, with some mixed-evergreen forest). Chen studied the effect of footprint size on canopy height estimation and showed the need to reduce footprint size to 32 feet (10 meters) or less if meter-level accuracy is to be achieved.
Wildlife.
Several studies of California forests have used Lidar to capture important habitat characteristics relevant to forest-dwelling wildlife, such as nesting or denning structures. Hyde et al. (2005) examined the ability of large-footprint Lidar to retrieve forest structural attributes (slope, elevation, aspect, canopy cover, crown shape and the spatial arrangement of canopy-forming trees) that are important for California spotted owl (Strix occidentalis occidentalis) in the Sierra National Forest. They found good agreement between field and Lidar measurements of height, cover and biomass at the footprint level and canopy height and biomass at the stand level. Garcia-Feced et al. (2011) performed a similar assessment with small-footprint discrete data in the Tahoe National Forest. They mapped the canopy cover and the number, density and pattern of all the large residual trees within 656 feet (200 meters) of four nest sites for spotted owls.
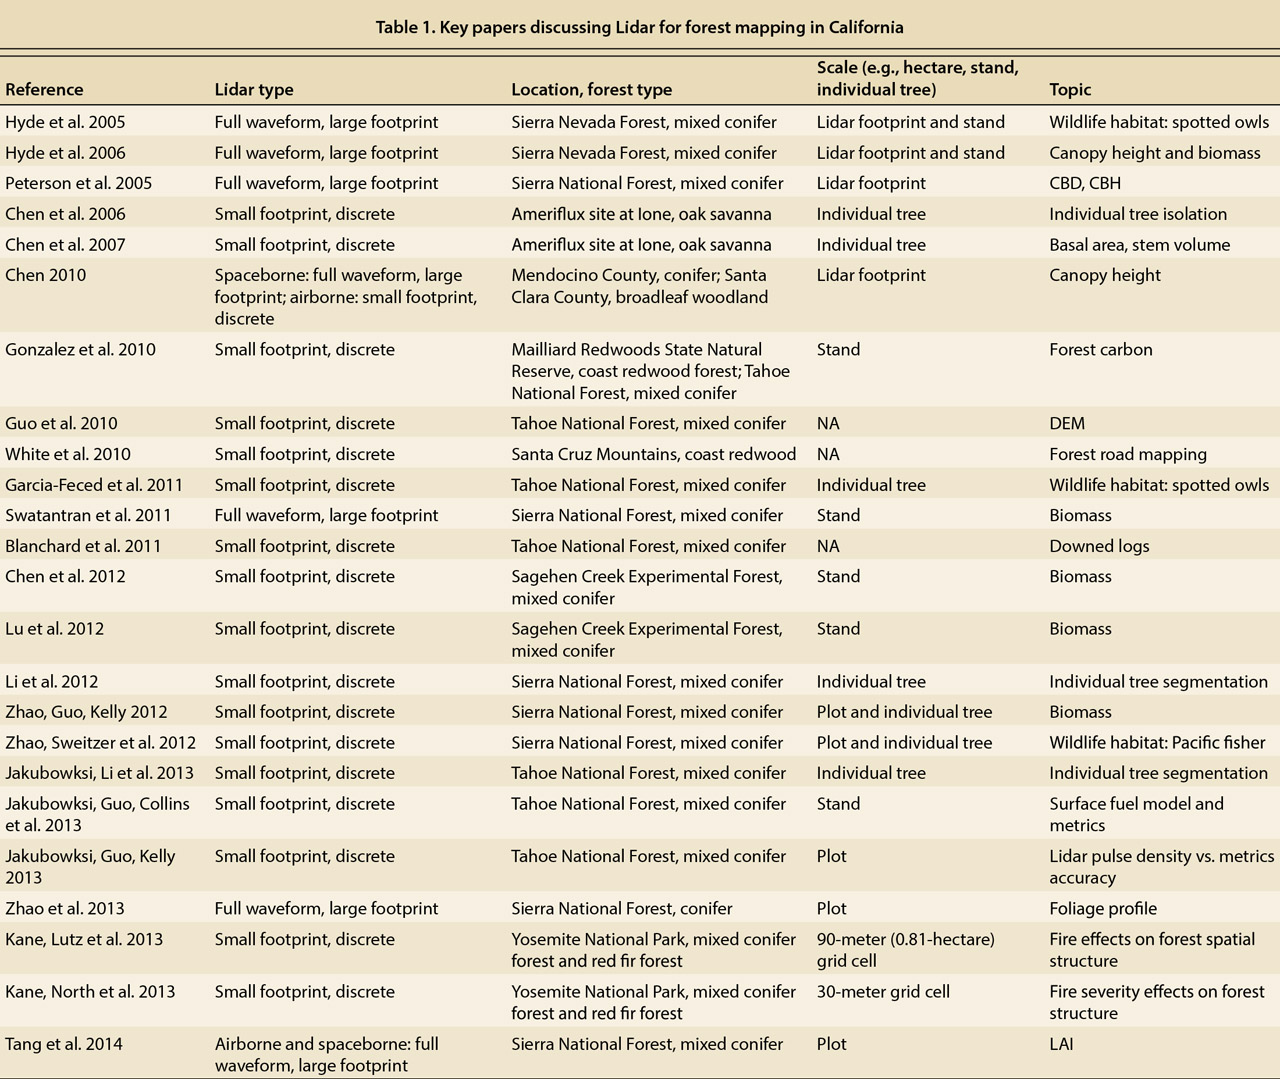
UC Berkeley Ph.D. student Marek Jakubowski uses a laser range finder (on tripod) in Tahoe National Forest to measure the distance and direction to trees. Researchers have found good agreement between Lidar and field measurements.
Resting and denning structures are considered to be the most important habitat elements required for maintenance of Pacific fisher (Martes pennant) populations, and literature has shown strong associations between fisher denning activity and its surrounding forested environment. Zhao, Sweitzer et al. (2012) compared trees used by fishers for denning with trees not used by fishers and found that denning structures were associated with high canopy cover, large trees and high levels of vertical structural diversity, and that the denning structures were located on steeper slopes, potentially associated with drainage areas with streams or access to water.
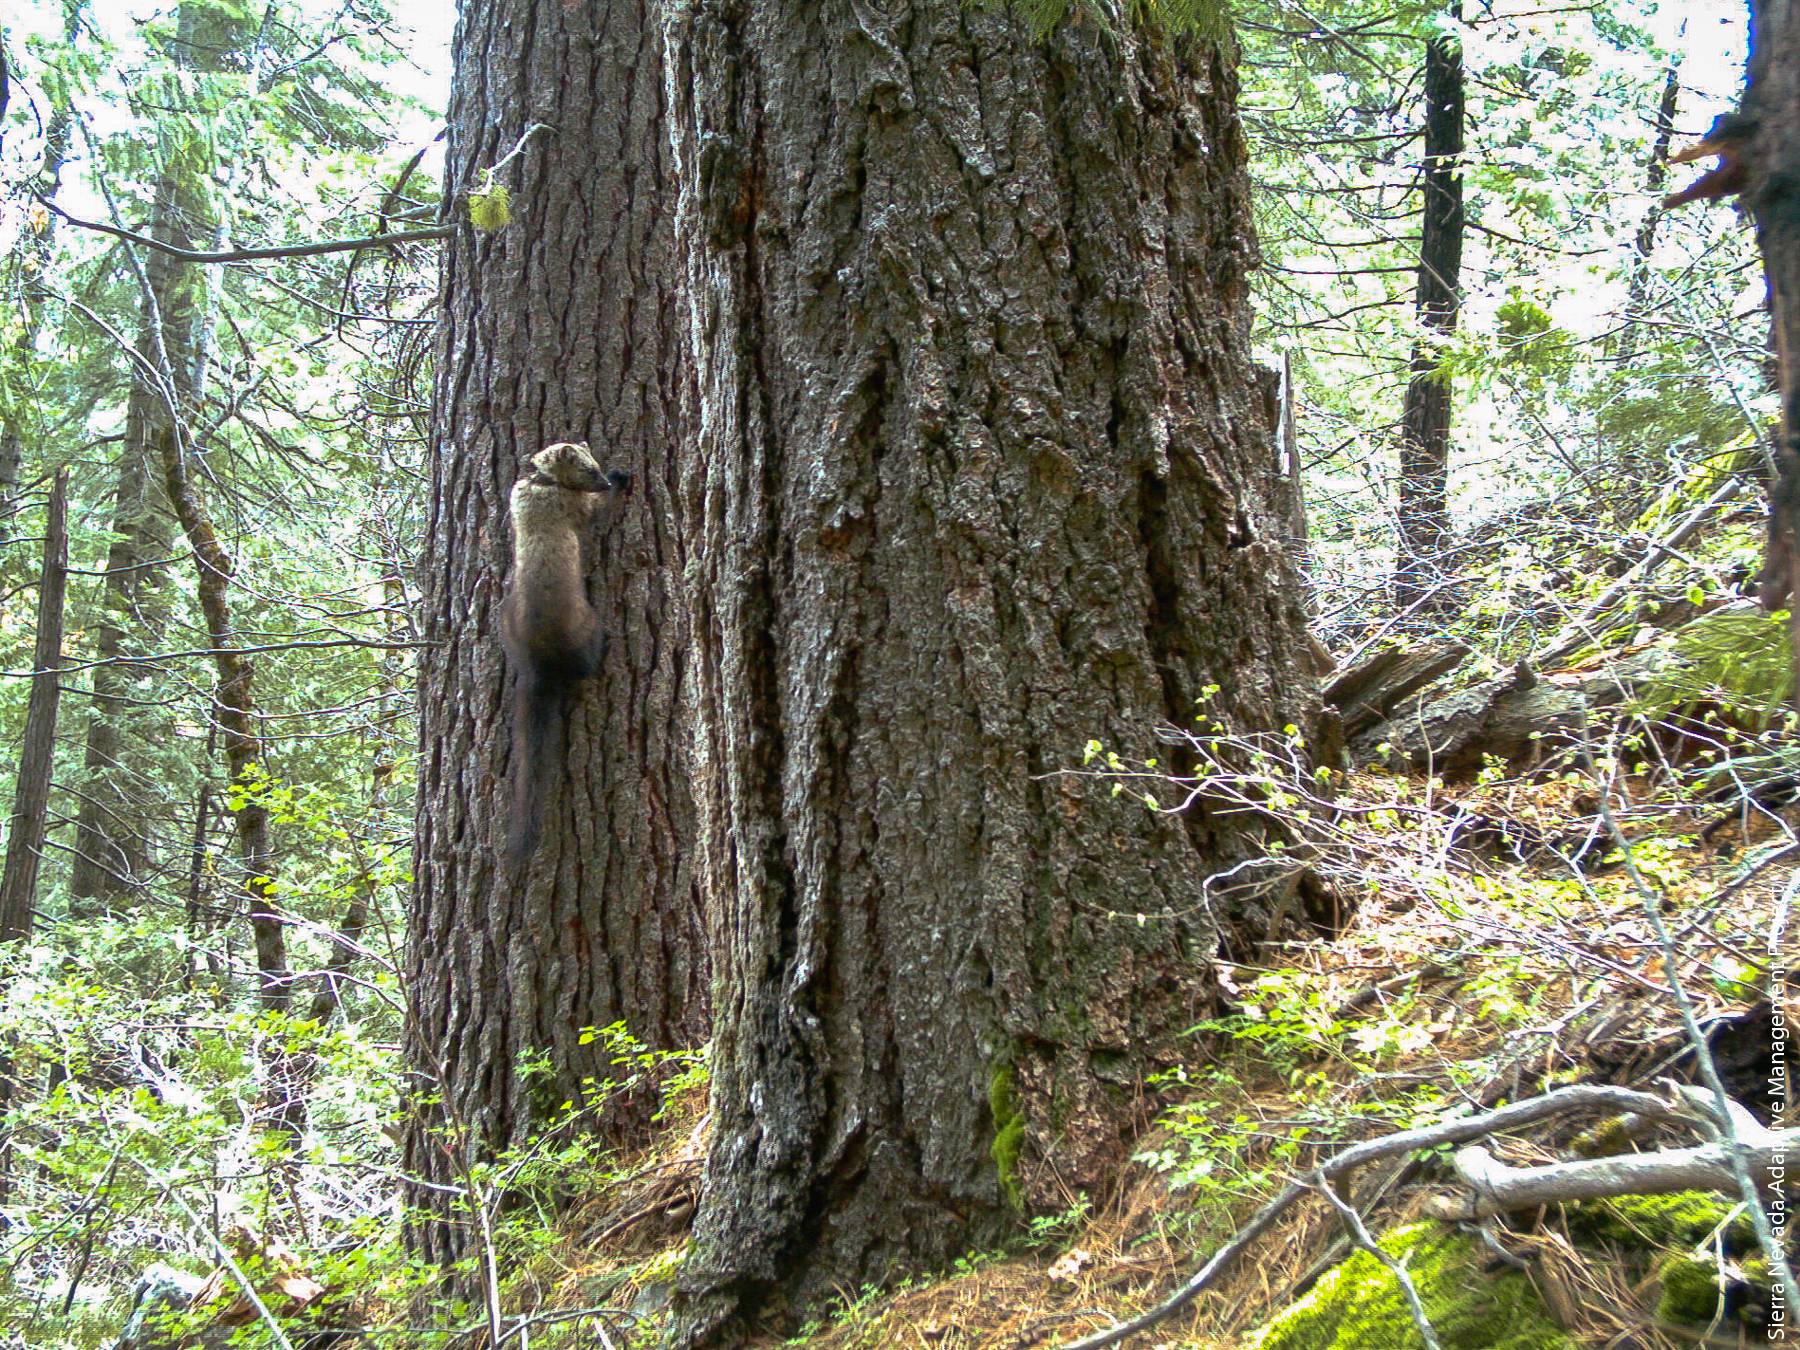
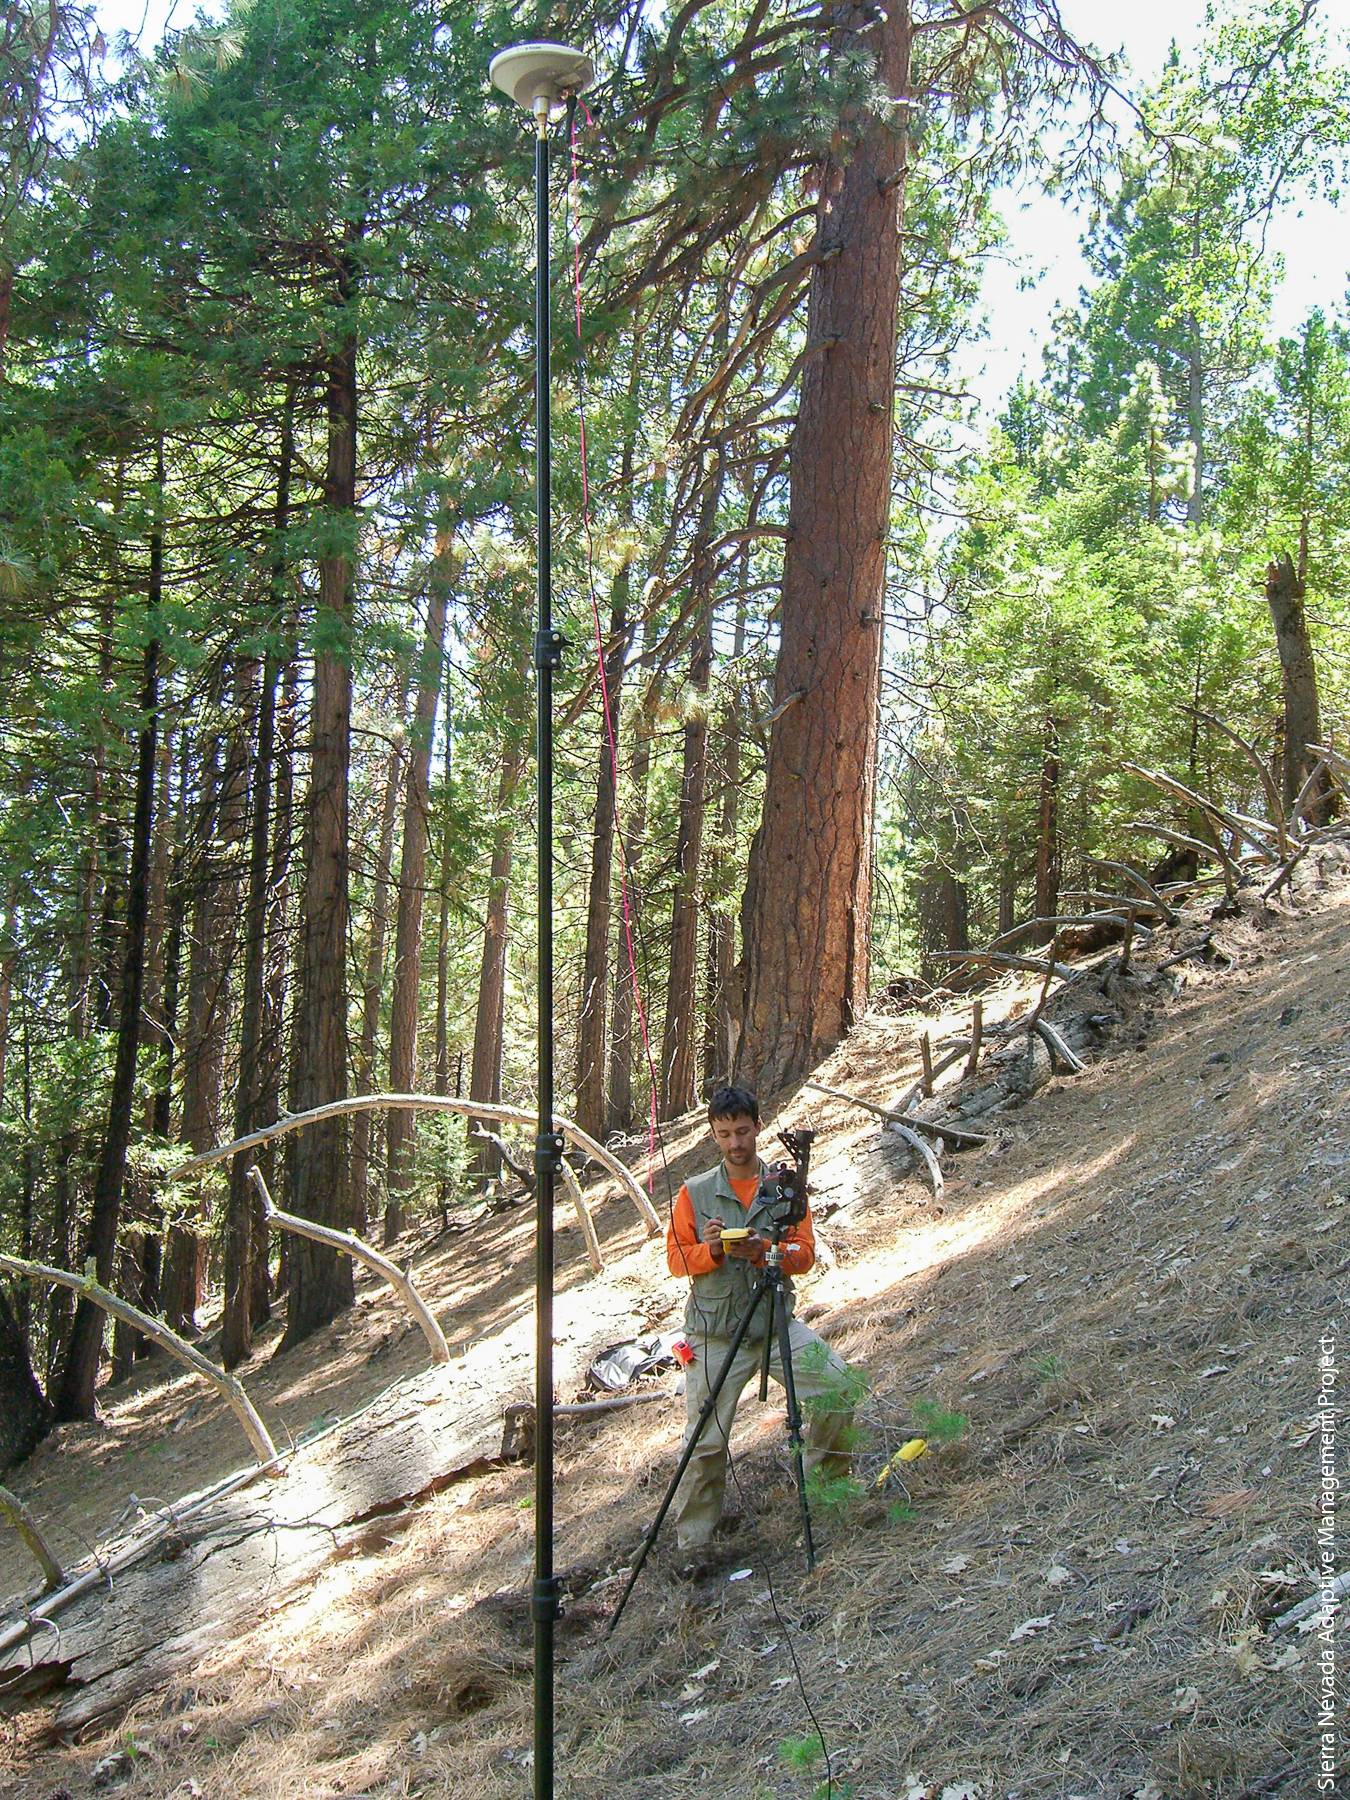
A Pacific fisher on a den tree. Several studies have used Lidar to identify habitat characteristics that are important for wildlife.
Fire.
To mitigate the possibility of large areas of high-severity fire, managers use wildfire behavior modeling for planning fuel reduction treatments such as thinning and prescribed fire across public forests. Forest fire behavior models need a variety of spatial data layers to accurately predict forest fire behavior, including elevation, slope, aspect, canopy height, canopy cover, crown base height and crown bulk density, as well as a layer describing the types of fuel found in the forest (called the fuel model). These spatial data layers are not often developed using Lidar data. Jakubowski, Guo, Collins et al. (2013) examined how well Lidar data could estimate them in the Tahoe National Forest. They found that tree height, canopy base height, canopy cover and general fuel types were predicted accurately using Lidar with multispectral images, but specific fuels were difficult to predict in dense forest (Jakubowski, Guo, Collins et al. 2013).
Downed logs on the forest floor, which provide fuel for forest fires, are a considerable challenge to map accurately. Blanchard et al. (2011) presented an object-based image analysis (OBIA) approach to delineate and classify downed logs using Lidar-derived metrics. Despite its success in identifying downed logs, the OBIA method requires significant analyst interpretation for classification, and so it can be considered a complement to field-based methods but not a replacement for them.
Kane, North et al. (2013) used Lidar combined with Landsat data to examine the ecological relationships between differences in fire severity and the spatial structures of forests, defined as tree clumps and openings, for three forest types (ponderosa pine, white fir and sugar pine, and red fir). A complementary analysis was performed by Kane, Lutz et al. (2013), focusing on changes in canopy profiles after fires.
Biomass.
Accurate measures and predictions of biomass are critical for estimating carbon storage on a stand and forest scale and also a global scale. Vegetation height metrics derived from Lidar are often used to predict biomass and have been found to provide accurate estimates of biomass even when forest density is high, because Lidar is not affected by the saturation problem associated with optical sensors, which can make moderate-density forests appear similar to high-density forests (Lu et al. 2012).
Hyde et al. (2006) compared the biomass estimation from Lidar, SAR/InSAR (a radar satellite), and ETM+ and Quickbird (optical sensors of moderate and high spatial resolution, respectively) and found that Lidar was the best single sensor for estimating biomass. Its higher accuracy in estimating biomass compared with Landsat TM and high-resolution Quickbird is also supported by Lu et al. (2012) and Gonzalez et al. (2010). Other studies focused on identifying methods to integrate Lidar with optical remote sensing (aerial and satellite images) to improve biomass estimation, given that biomass is related not only to tree structure, but also to factors strictly dependent on vegetation type (Chen et al. 2012), and optical remote sensing can provide information on vegetation type.
One way to incorporate vegetationtype information into biomass estimation is to stratify forest plots according to vegetation type and develop a separate statistical model for each type. This approach was taken by Swatantran et al. (2011), who used AVIRIS hyperspectral data to refine biomass prediction and showed that prediction by Lidar after species stratification from field data reduced errors by 12% compared with using Lidar metrics alone.
A different approach to biomass mapping was adopted by Chen et al. (2012), who used mixed-effects modeling to integrate airborne Lidar data and vegetationtype data derived from aerial imagery. Incorporating vegetation type improved biomass estimation (R2 improved from 0.77 to 0.83) and decreased RMSE by 10% from 199.6 to 178.4 megagrams (Mg) per acre (80.8 to 72.2 Mg per hectare).
In contrast to Swatantran et al. (2011) and Chen et al. (2012), other studies suggest that integrating Lidar data and optical or radar imagery does not produce better biomass predictions. For example, Hyde et al. (2006) found that adding Quickbird and SAR/InSAR forest structure metrics to Lidar resulted in no improvement for estimating biomass across 120 circular 0.40-acre (1-hectare) plots in the Sierra National Forest; this was explained by the fact that the structure metrics from SAR/InSAR and Quickbird were very similar to those of Lidar.
All the studies reviewed here strongly agree that airborne Lidar data provides the most accurate estimates of forest biomass, but rigorous procedures should be taken in selecting appropriate allometric equations to use as reference biomass estimates (Zhao, Guo, Kelly 2012). Reference biomass is typically calculated using published allometric equations, such as national-scale equations (Jenkins et al. 2003) or equations from the Forest Inventory Analysis program ( fia.fs.fed.us ). Zhao, Guo, Kelly (2012) examined how the use of one or the other strongly influenced Lidar regression modeling results, and they suggest that in the mixed-conifer forests of the Sierra Nevada regional biomass equations should be preferred over national equations.
Terrain and infrastructure.
Identifying road infrastructure is essential for wildland fire planning and suppression measures, and current geographic information system (GIS) data sets do not provide adequate and complete road inventories in many forests. Lidar data can be used to produce highly detailed digital terrain models (DTM) at fine (e.g., 3.3-feet, or 1-meter) resolutions (Guo et al. 2010), which can also provide detailed and accurate road inventories. White et al. (2010) showed the suitability of Lidar for mapping forest roads in the dense forest canopy and steep, complex terrain of the Santa Cruz Mountains. The study highlighted forest road features that are not visible through traditional remote sensing data such as satellite imagery and aerial photography because passive sensors are unable to penetrate dense canopy.
Future of Lidar
The future of Lidar for forest applications depends on a number of considerations, including costs, which have been declining; new developments to address limitations with discrete Lidar; and new methods to deal with increasing data size.
Public workshops showing Lidar mapping capabilities have engaged members of the public, resource managers and staff from resource agencies. The adoption of Lidar in forest management is likely as the costs of the technology continue to drop.
Costs.
Adoption of Lidar in forest management has not been complete. Wynne (2006) says “small-footprint imaging Lidar systems now dominate much of forest remote sensing research, but have yet to be integrated into operational inventory and monitoring at the scale of management.” Although this is changing, large-area forest monitoring and mapping activities with Lidar remain challenging due to costs, logistics and the data volumes involved (Wulder et al. 2012). While the cost of acquiring Lidar is still higher than for aerial or satellite imagery, a few studies suggest that Lidar data can be more cost effective than intensive fieldwork. Hummel et al. (2011) say: “We found that the accuracy and cost of a Lidar-based inventory summarized at the stand level were comparable to traditional stand exams for structural attributes. However, the Lidar data were able to provide information across a much larger area than the stand exams alone.”
Two published studies present actual costs: Wulder et al. (2008) estimated a cost of ? $1 per acre ($3 per hectare) for mapping with low-density (0.1 pulse per square foot, or 1 pulse per square meter) discrete Lidar data. Renslow et al. (2000) outlined a forest management scenario for a typical even-aged, managed forest of 500,000 acres in which 2% of 10,000 acres (200 acres, or 81 hectares) are sampled annually to determine what management steps are needed. Renslow et al. estimated that 14 weeks of traditional fieldwork would cost $32,000, or $160 per acre (? $395 per hectare). In contrast, field data collection and collection and analysis of Lidar data would cost $16,600, or $83 per acre ($205 per hectare). However, these Lidar cost estimates are far higher than estimates of forest mapping with Landsat data, particularly since Landsat data is now free. Franklin et al. (2000) estimated ? $0.15 per acre ($0.30 to $0.40 per hectare) in 2000 for mapping with Landsat imagery, drastically down from the costs in the 1980s, of ? $1 per acre ($2 to $3 per hectare) (adjusted to 2000 dollars).
Lidar costs are declining, and there are potential savings for forest managers who wish to use Lidar data as long as they can focus on plot-level measurements (Jakubowski, Guo, Kelly 2013). With plot-level measurements, a forest manager can cover more of the forest for less cost than required for measurements of individual trees.
Limitations.
There are known limitations to the use of discrete Lidar for forest mapping — in particular, smaller trees and understory are difficult to map reliably. In Washington state, Richardson and Moskal (2011) found unbiased density estimates for trees taller than 65 feet (20 meters) but underestimation of density in trees less tall than that. Similarly, Jakubowski, Guo, Collins et al. (2013) found that the accuracy of stand structure metric predictions generally decreased with increased canopy penetration; measures at the top of the canopy (e.g., canopy cover, height) were more accurate than those near the forest floor (e.g., shrub height, fuel loads). This limitation is reported elsewhere, but in the next 5 years, it will become less relevant as waveform data becomes more common than discrete data and researchers have a chance to evaluate waveform data with information from the field.
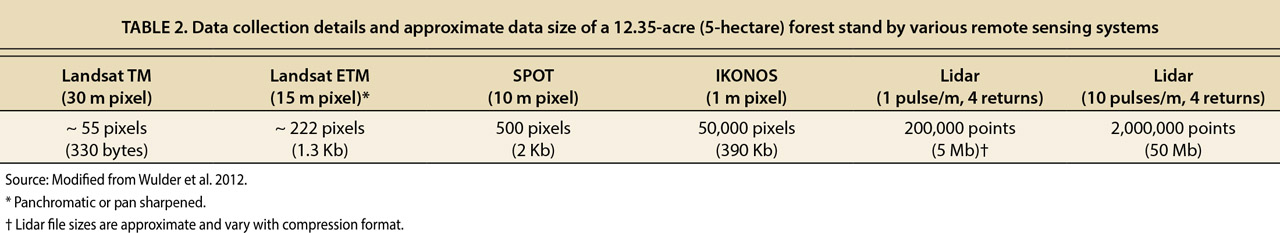
Table 2. Data collection details and approximate data size of a 12.35-acre (5-hectare) forest stand by various remote sensing systems
Data size.
The benefits of forest mapping with moderate-scale satellite imagery such as Landsat are immense: inexpensive cost, with large and repeat views, and detailed depictions of forest cover and type. But there are drawbacks to Landsat that Lidar does not have. With Lidar, the effective scale and resolution are not chosen a priori for the analyst, as is the case with satellite imagery. The pixel as a sample has been called problematic since the 1990s (Cracknell 1998; Fisher 1997); pixels can be too large to capture detail and their placement depends on the satellite's orbit. In contrast, a Lidar point cloud can be resolved into any number of operational resolutions for integration with other mapped products or field data.
Representation is critical: A 12-acre (5-hectare) forest stand, for example, can be represented by 55 data points (e.g., Landsat, 98.4 feet, or 30 meters) and likely undersampled for many purposes or by 2 million data points (e.g., a Lidar point cloud) (table 2), which can then be resolved into a collection of height profiles, structural metrics, individual trees or products of any spatial resolution (e.g., 1 to 100 feet). This flexibility in representation can be both a benefit and a challenge, as increased data points and multiple scales of representation require more complex software and data storage options (Wulder et al. 2012).
Our review of Lidar research illustrates a preponderance of studies of conifer forests in California; in the future we will likely see more use of Lidar in oaks and redwood forests as managers continue to expand their use of these data and focus on more ecosystems. As Lidar costs continue to decline and new and easier methods are developed to process the data, it is possible that managers will incorporate Lidar data in forest management, particularly where detailed information on forest structure is required across large spatial scales.
Citations
Mapping forests with Lidar provides flexible, accurate data with many uses

