


All Issues
Pierce's disease costs California $104 million per year
Publication Information
California Agriculture 68(1):20-29. https://doi.org/10.3733/ca.v068n01p20
Published online January 01, 2014
NALT Keywords
Abstract
Pierce's disease of grapevines, caused by a strain of the bacteria Xylella fastidiosa, threatens an industry with a farm value of production exceeding $3 billion per year. The grape industry incurs substantial costs from losses of vines to the disease and efforts to mitigate damage. Additional costs are borne by the public in providing programs that aim to contain the disease and develop longer-term solutions, and by the citrus, nursery and grape industries in complying with those programs. Aggregating the costs of vine losses, industry assessments, compliance costs, and expenditures by government entities, we estimate the cost of Pierce's disease in California is approximately $104.4 million per year. Of that, $48.3 million funds Pierce's disease activities undertaken by various government agencies, the nursery and citrus industries and the UC system, and $56.1 million is the cost of lost production and vine replacement borne by grape growers.
Full text
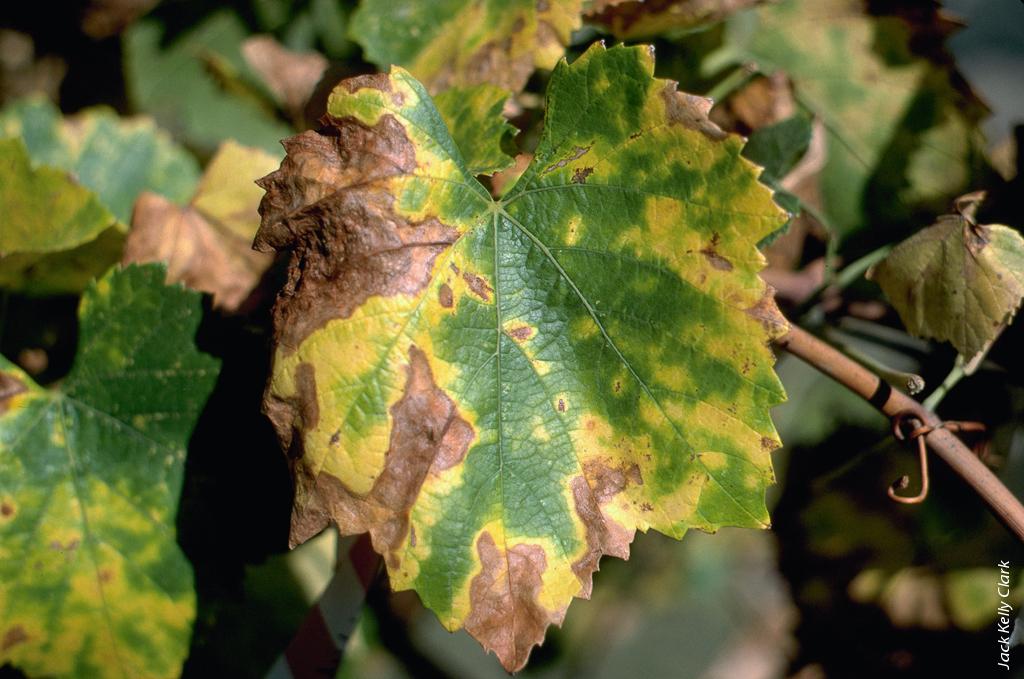
Pierce's disease (PD), caused by a strain of the bacteria Xylella fastidiosa, was first reported in the 1880s. Xylella blocks the xylem, or water-conducting system, of a grapevine, leading to vine death, usually between 1 and 5 years after the plant becomes diseased. This disease imposes significant annual costs on the California grape and wine industry through losses of vines and the cost of efforts to mitigate the damage. Further significant costs are borne by the broader community in providing public programs that aim to contain the problem and develop longer-term solutions, and by the citrus, nursery and grape industries in complying with those programs.
California production of grapes of all types was valued at approximately $3.2 billion in 2010, of which wine grapes accounted for nearly $2.1 billion, or 66% of the total (CDFA 2011a). In our study, we focused on the wine grape industry, which accounts for the majority of grape acreage and value of grape production in California and bears the greatest share of the costs of PD (NASS 2011a, 2011b). Although PD can affect all grapevines, the Pierce's Disease Control Program (PDCP) was introduced in 2000 mainly because of concern about the costs in the wine grape industry.
Since the late 1990s, tens of millions of dollars in public and private funding have been spent each year to prevent the spread and mitigate the effects of Pierce's disease in California.
Until recently, PD was regarded as just one of many chronic diseases in the wine grape industry, always present and occasionally worse than usual. This was so when the only insect vectors for the disease were native sharpshooters. Concerns grew after a devastating PD outbreak in the Temecula Valley in Southern California in the late 1990s, spread by a new nonnative vector, the glassy-winged sharpshooter (Homalodisca vitripennis, GWSS). In response, extensive programs were created to manage PD and GWSS in Southern California and to prevent the spread of GWSS into other areas, especially the high-production-value areas of the Napa and Sonoma valleys, but also the contiguous southern San Joaquin Valley, where a large share of the total volume of California wine is produced, along with table and raisin grapes.
Since the inception of these programs in the late 1990s, tens of millions of dollars of public and private funds have been spent each year to prevent the spread of GWSS and PD and to mitigate the effects of PD. In our study, we quantify in detail the costs of these efforts and the costs to growers (ultimately shared with consumers) from losing vines to the disease.
Pierce's disease and its vectors
PD has caused vine death from the very beginning of the wine industry in California. In 1857, the Los Angeles Vineyard Society settled in the Santa Ana Valley with initial funds of $100,000. The settlement produced its first vintage in 1860, yielding about 2,000 gallons of wine. By 1883, the region was home to 50 wineries, approximately 10,000 acres of vines and annual production of about 1.2 million gallons of wine. A few years later, however, most of the vines had inexplicably died. Farmers altered their farming practices, including their spraying, dusting and pruning methods, to try to combat the vine death, but were unsuccessful. The disease spread to neighboring areas and contributed to the eventual demise of commercial grape culture in Southern California (Olmstead and Rhode 2008).
In 1889, the U.S. Department of Agriculture (USDA) dispatched Newton B. Pierce to Santa Ana to determine the cause of vine death. In 1891, after extensive research, Pierce concluded that the disease was unknown and that it was probably caused by a microorganism for which a cure was not available. Pierce's conclusion closed investigations into the disease for almost 50 years (Olmstead and Rhode 2008).
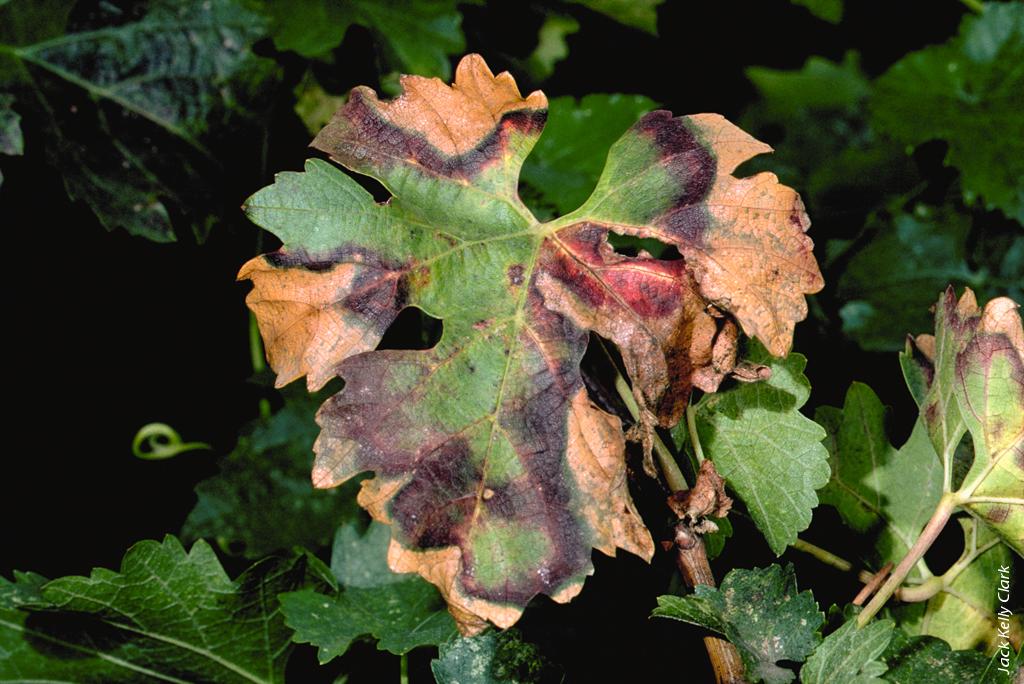
Pierce's disease is caused by a strain of the bacteria Xylella fastidiosa, which blocks the water-conducting system of a grapevine, leading to vine death 1 to 5 years after the plant becomes diseased.
The disease that killed the grapevines in Santa Ana, now referred to as Pierce's disease, and its insect vectors were not identified until recently. It is now known that the bacterium X. fastidiosa causes PD, and it is spread by a variety of leafhopper insects, called sharpshooters. Sharpshooters obtain nutrients by feeding on plant fluids in the water-conducting tissues of a plant (xylem). Their feeding does not usually inflict significant plant damage, although in some cases significant water loss (but not fruit damage) can occur in citrus trees. However, when a sharpshooter feeds on a PD-infected plant, the bacteria may attach to its mouthparts. Over time, the bacteria colonize the insect's foregut, and can be spread to other plants as it feeds, thus vectoring the disease (UC IPM 2008).
Several sharpshooters are native to California. Green sharpshooters and red-headed sharpshooters pose some threat to the state's vineyards, but significantly less threat than the blue-green sharpshooter (Graphocephala atropunctata), which has been present in the Napa Valley for over 100 years. Riparian areas provide the main breeding habitat for blue-green sharpshooters, although irrigated landscaped areas can also host breeding populations (PD/RHW 2000). They migrate out of riparian areas in the spring and into vineyards, where they can vector PD. Blue-green sharpshooters have a limited flight range; they do not fly far from where they hatch (UC IPM 2008).
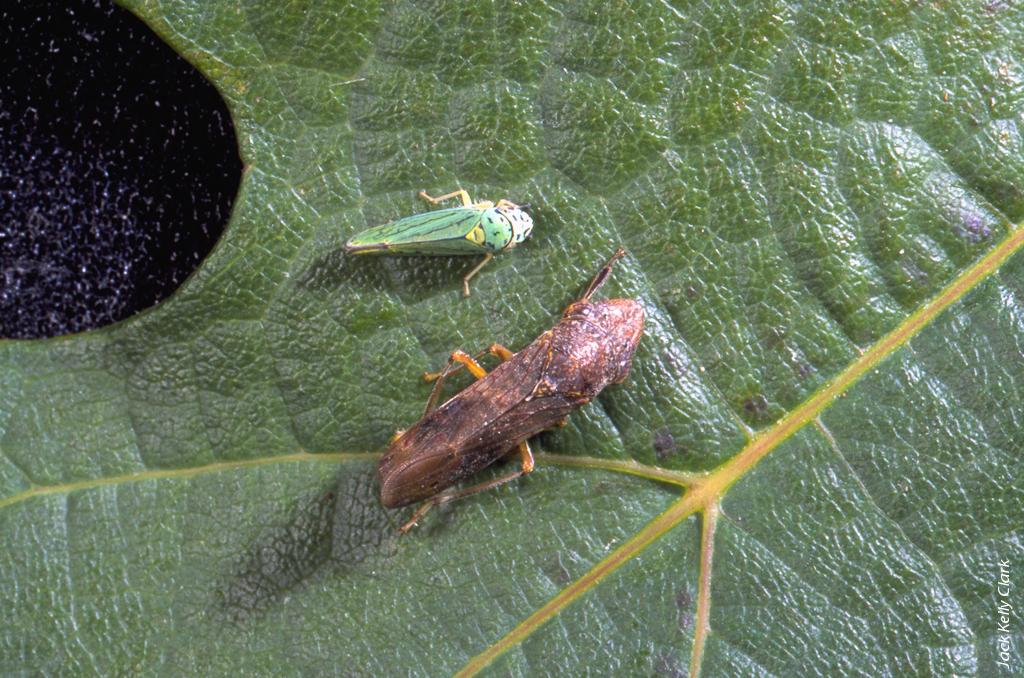
Vectors of Pierce's disease include the blue-green sharpshooter (Graphocephala atropunctata), top, and the nonnative glassy-winged sharpshooter (Homalodisca vitripennis), bottom.
GWSS was inadvertently introduced to Southern California in the early 1990s; its native habitat is in the southeastern United States and northern Mexico (Purcell and Almeida 2010). It is likely that it arrived as an egg mass in ornamental or agricultural plant foliage. GWSS can live in many habitats, including agricultural crops, urban landscapes, native woodland and riparian vegetation. It has a strong preference for citrus groves as a host; however, its host range can vary significantly and includes woody ornamentals (shrubs and trees) and annual and perennial herbaceous plants. GWSS also has the ability to fly a quarter mile or more without stopping, making it a highly mobile threat. In Southern California and the San Joaquin Valley, it is active in winter and has at least two generations per year, substantially increasing the threat of the disease spreading there (UC IPM 2008).
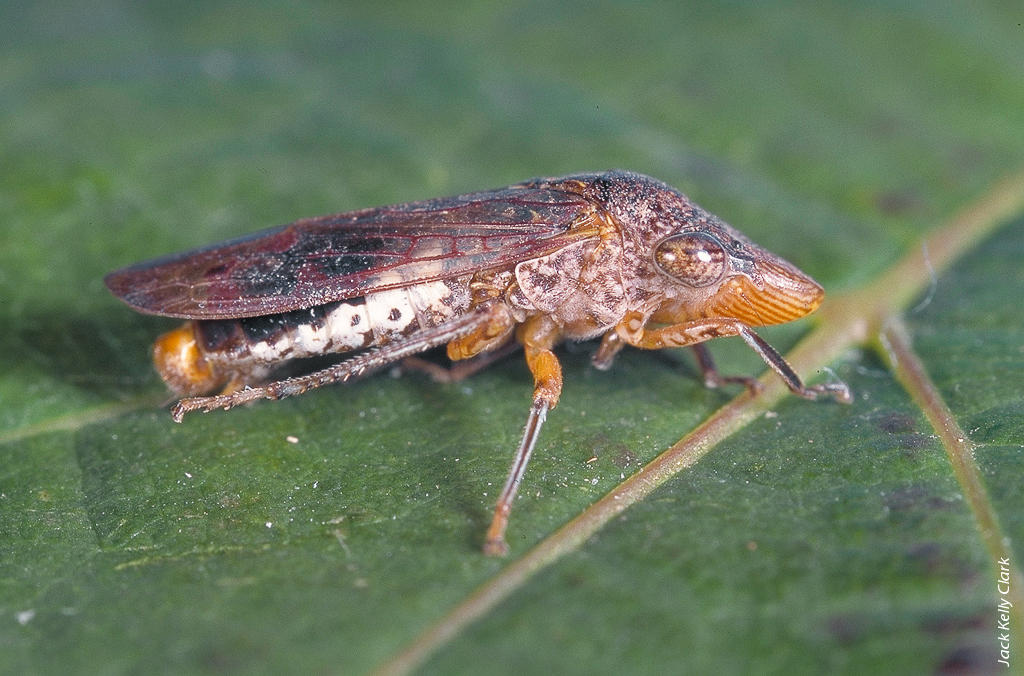
The glassy-winged sharpshooter, native to the southeastern United States and northern Mexico, was inadvertently introduced to Southern California in the early 1990s and can live in many habitats, including agricultural crops, urban landscapes, native woodland and riparian vegetation.
Regional profiles
California's wine grape production is regionally diverse, with substantial variation in both the susceptibility of vineyards to damage from PD and the prevalence of different species of sharpshooters, and in the cultural methods used, yield per acre and value per ton of grapes. Reflecting this diversity, data on wine grape production are available for a total of 17 crush districts. For the purposes of the present analysis, we divided California into six regions that differ in terms of economic aspects of wine grape production and susceptibility to PD (fig. 1). Details on value of production, average price, yield and bearing acres in each region are given in table 1.


Southern California.
Southern California is the smallest producing region: in 2010, it accounted for less than 1% of crush value and volume ($4.74 million and 4,000 tons) (NASS 2011b), but it has been a hot spot for PD and GWSS since 1999. In that year, vineyards in the Temecula Valley, in Riverside County, began suffering great losses from PD after GWSS entered the area and began vectoring the disease. By the end of August 1999, over 300 acres of grapevines in the valley were affected (CDFA 2009a).
Wine grape production in Temecula is currently protected by the PDCP, which arranges and pays for imidacloprid, a neonicotinoid insecticide, to be applied in citrus groves adjacent to vineyards. Although these efforts to limit the size of the GWSS population in Temecula and mitigate its effects have been largely successful in many ways, PD and GWSS remain a major threat in the eyes of many vineyard owners and policymakers. GWSS exists in other parts of Southern California but has not become well established except in Temecula.
Napa-Sonoma.
In 2010, the Napa-Sonoma region produced approximately 10% of the total crush volume, which accounted for 35% of the total value of the California wine grape crush in that year (NASS 2011c). PD, vectored by the native blue-green sharpshooter, causes significant chronic losses in this region, especially in vineyards adjacent to riparian areas, where the sharpshooter does most of its feeding.
In this region, effective pesticides are lacking because of the regional climate and dominant soil types. Some growers have undertaken extensive riparian revegetation projects to remove (often nonnative) host plants and replace them with native nonhost plants, but this process is quite costly and complicated. Extensive programs have been established to prevent the spread of GWSS into Northern California vineyards.
Other coastal.
Coastal regions outside Napa-Sonoma constitute the second-largest wine grape region in California, producing about 18% of total crush volume and 28% of crush value in 2010. This has been the fastest-growing wine grape region in the state over the past 10 to 15 years, with acreage nearly doubling from 66,000 acres in 1997 to 125,000 acres in 2010 (NASS 1995–2012). PD is present in the coastal valleys, but prevalence is very low. Native sharpshooters such as the blue-green and willow sharpshooters are its primary vectors. Small hot spots of PD exist in parts of San Luis Obispo, Santa Barbara, Ventura and Mendocino counties, but the damage has not been extensive enough to warrant taking precautionary measures to stop its spread. Growers tend to avoid planting vineyards in the hot spots.
San Joaquin Valley south.
In 2010, the southern portion of the San Joaquin Valley produced approximately half of California's wine crush volume, and about 22% of the wine crush value. In addition to wine grapes, the region produces nearly all of California's raisin and table grapes, which produced approximately $1 billion in revenue in 2010 (CDFA 2011a). PD pressure here is not as severe as in either Napa-Sonoma or Temecula. Nevertheless, great measures are being undertaken to prevent PD outbreaks and the northward migration of GWSS from the Temecula Valley, where its population is abundant.
San Joaquin Valley north.
In 2010, the northern portion of the San Joaquin Valley produced about 20% of California's wine grape crush volume, 14% of the crush value. Here, PD pressure is relatively low, partly because of the programs and policy that have worked to prevent the northward migration of GWSS.
Northern California.
Northern California and the Sierra Foothills account for a small share of California wine grape production — about 2% of the crush volume and about 1.6% of the crush value. The region has had minor instances of PD and no cases of GWSS. It is widely held that a GWSS population could not sustain itself over the winter here because of the cold temperatures.
Programs
Since the PD outbreak in Temecula in 1999, several programs have been initiated to help prevent the spread of GWSS and mitigate losses from PD in California, not just in wine grape production, which is our primary emphasis, but also in table grapes and raisins.
Research.
In 2006, the UC Pierce's Disease Research Grants Program was established with funding from the USDA Cooperative State Research, Education, and Extension Service (CSREES) to allocate funds to research aimed at preventing the spread of PD and GWSS. Each year the federal government has allocated $1 to $2 million to the program for research. Total spending under this program in fiscal year (FY) 2009–2010 was $1.86 million, but since 2010–2011 funding has ceased.
Pierce's Disease Control Program.
The largest and most influential PD-related program in California is the Pierce's Disease Control Program (PDCP). It is a partnership that includes the California Department of Food and Agriculture (CDFA), county agricultural commissioners, the USDA, UC and California State University, other state and local agencies, and industry and agricultural organizations throughout California. The program aims to slow or stop the spread of GWSS while other short- and long-term solutions to PD are developed. In FY 2009–2010, the program spent approximately $18.6 million on efforts to prevent the spread of GWSS from infested to noninfested areas, surveying and detection, response to outbreaks or GWSS infestations, and outreach.
Local government and industry efforts.
Napa County funds activities for prevention of PD, as well as other diseases and pests, in conjunction with the Napa County Winegrape Pest and Disease Control District. Wine grape growers in Napa County are required to pay an assessment ($8.22 per acre in FY 2010–2011) (Napa County Agricultural Commissioner's Office 2010), which Napa County is required by law to match. The funds are applied to inspection, detection, and prevention of and education about PD and GWSS, as well as detection and control of the vine mealybug (Napa 2009). In FY 2009–2010, Napa County collected approximately $193,000 using this assessment.
In addition, in October 2001, the PD/GWSS Board was established to fast-track research efforts. The Board introduced the Statewide Winegrape Assessment (SWA), which has ranged, based on recommendations from the PDCP, from $0.75 to $3.00 per $1,000 of harvested wine grape value, to support research (PD/GWSS Board 2009; Western Farm Press 2013).
Regulatory programs.
The GWSS Nursery Shipping Protocol designates approved practices for shipments of nursery stock in California. In many cases, nurseries in infested counties must subject the plants they ship to extensive inspection when shipping to noninfested areas; every leaf of the plant must be examined (CDFA 2009b). Exceptions to some of these inspections occur if the nursery is designated “free from” GWSS, where “free from” means a nursery does not find egg masses, live nymphs or more than three adult GWSS in the same one-half acre in a 2-week period (CDFA 2009c). After implementation of the protocol, shipments in which GWSS was detected dropped significantly, from 149 in 2001 (57,600 total shipments) to six in 2010 (50,600 total shipments) (CDFA 2011b).
Program costs
From 1999 to 2010, industry and federal, state and local governments together spent nearly $544 million dollars on PD and GWSS programs (fig. 2). In FY 2009–2010, the government cost was just over $34 million, of which $30.1 million was federal, $3.7 million was state, $193,000 was local government expenditures and $161,000 was derived from the SWA (Tom Esser, special assistant to the PDCP, personal communication) (fig. 3). Figure 4 summarizes industry-funded expenditure and its allocation. Costs are also incurred by the industry to comply with the PDCP and as a result of the losses of vines to PD (tables 2 and 3).
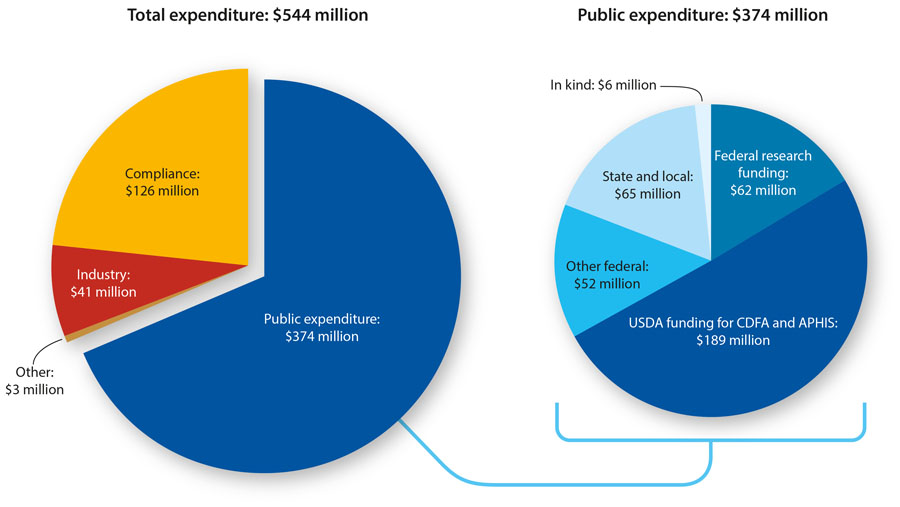
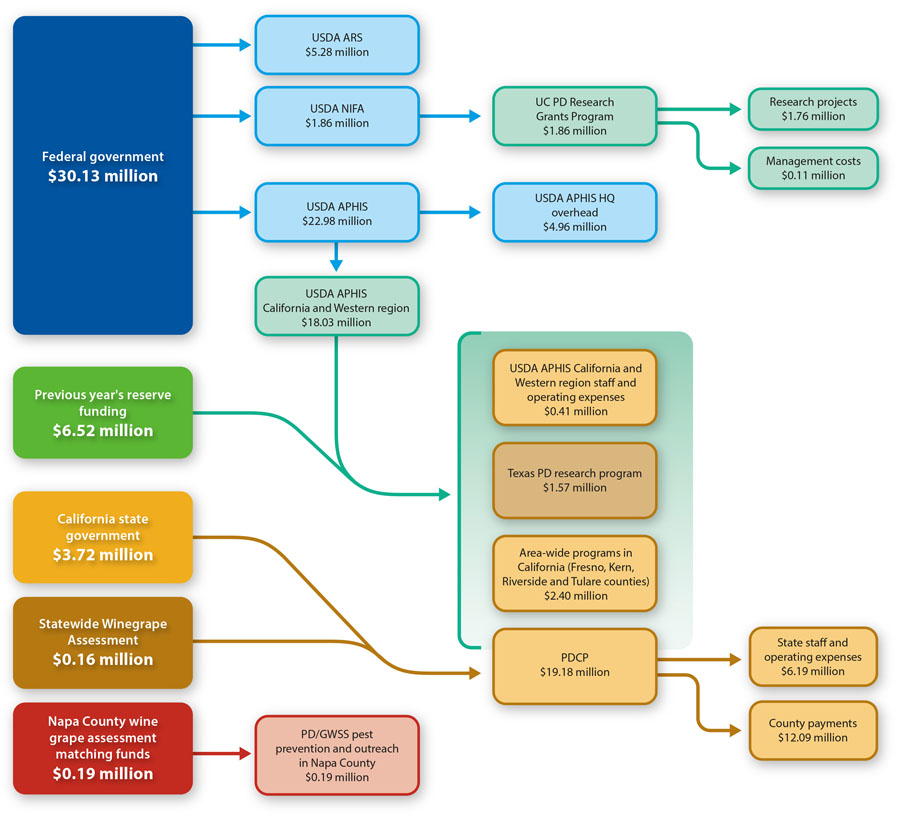
Fig. 3. State and federal funding for PD-related programs and expenditures, 2009–2010. Unused federal funds are carried over to following years as reserve funding, but state funding cannot carry over. Source: Developed by the authors using data from the PDCP, PD/GWSS Board and UC PD Research Grants Program.

Fig. 4. Industry funding for PD-related programs and expenditures, 2009–2010. Unused funds can be carried over to following years, so funding in a particular year may not equal expenditure. Source: Developed by the authors using data from the PDCP, PD/GWSS Board and Table Grape Pest and Disease Control District.
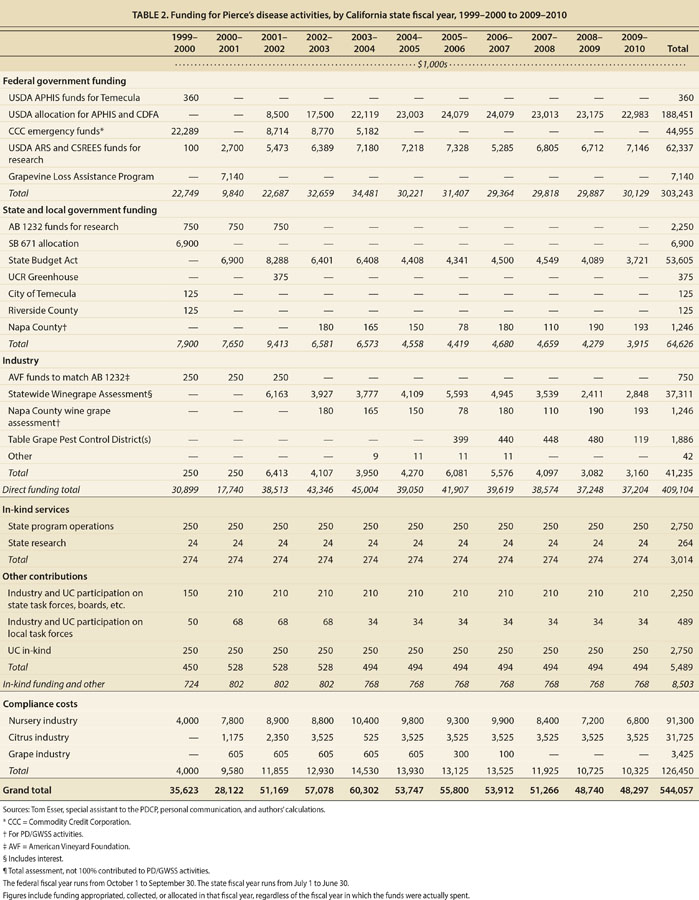
TABLE 2. Funding for Pierce's disease activities, by California state fiscal year, 1999–2000 to 2009–2010

Federal government funding.
Between 1999 and 2010, the federal government contributed approximately $303 million, or 74%, of the total funding for PD-related programs. In FY 2009–2010, the federal government spent approximately $30 million on those programs: the Animal Plant and Health Inspection Service (APHIS) spent approximately $23 million, and the Agricultural Research Service (ARS) and the National Institute of Food and Agriculture (NIFA) spent approximately $7.1 million (fig. 3). The UC PD Research Grants Program received $1.86 million of the ARS and NIFA allocation, and the balance of $5.28 million funded USDA ARS programs and overhead expenses (Kassim Al-Khatib, UC PD Research Grants Program manager, personal communication).
State and local government funding.
Between 1999 (i.e., the Temecula outbreak) and 2010, state and local governments contributed funds of nearly $65 million, or 16%, of the total funding for PD-related programs (fig. 2). In FY 2009–2010, the CDFA contributed approximately $3.7 million to the PDCP, which had total funding of nearly $19.18 million, of which it spent $6.2 million on expenses and $12.1 million on county payments (fig. 3). The state and local government funding, in addition to the SWA, support the program's four main elements: containment, survey and detection, rapid response, and outreach. The state of California also contributes in-kind services (e.g., scientific consultation, promulgation of regulations, environmental compliance, pesticide registrations, diagnostics, legal review, mapping and so on) worth $250,000 annually to the program operations and $24,000 to research.
Industry funding.
The California grape industry contributed approximately $41 million, or 10%, of direct funding for PD activities between 1999 and 2010 (fig. 2), mostly through the PD/GWSS Board's statewide assessments of growers. Between 2001 and 2010, the PD/GWSS Board collected approximately $37.3 million, of which it spent approximately $21 million on 106 research projects and four field trials, as well as another $2 million on review and guidance of research efforts (Esser, personal communication). The annual amounts have varied. In FY 2009–2010, the industry contributed approximately $3.1 million and some $8 million was carried forward from the previous year, sourced and allocated as shown in figure 4. In FY 2009–2010, the SWA raised over $2.8 million for research and related activities. Napa County's assessment, which is in addition to the SWA, contributed $193,378 in FY 2009–2010 to the prevention of PD (fig. 4).
Similarly, table grape growers in California are charged an assessment. The Consolidated Central Valley Table Grape Pest and Disease Control District manages the funds acquired by the assessment. In FY 2009–2010, the assessment collected approximately $735,000, of which about 15% (or approximately $119,000) was contributed to GWSS- or PD-related projects (Judy Zaninovich, Consolidated Central Valley Table Grape Pest and Disease Control District manager, personal communication), allocated as shown in figure 4.
Nursery compliance costs.
Approximately 70% of California's 12,000 licensed nurseries are located in GWSS-infested areas, and those that choose to ship from infested to noninfested areas are required to take certain precautions to avoid the spread of GWSS. Complying with CDFA-approved shipping protocols can be very expensive for nursery operators. Many nurseries have adapted their businesses to save on the costs of compliance, opening facilities in noninfested areas or minimizing, if not eliminating, shipping to noninfested areas.
Our compliance cost estimates reflect explicit costs borne by the industry for nurseries that must comply with the GWSS Nursery Shipping Protocol measures such as inspections, pesticide sprays and quarantines. Our estimates do not include forgone business, nor expenses incurred in changing business models to comply with the approved treatment protocol, nor the costs of changing product mix, additional management costs, and lost orders because of problems with scheduling inspections. We extrapolated from data on costs provided to us by a small number of nurseries in infested areas that ship to noninfested areas, as well as informal advice on the likely range of costs for other nurseries, to estimate the compliance cost for the industry, which is diverse and fragmented; our estimate for 2010 was approximately $6.8 million (table 2).
Citrus compliance costs.
As a winter breeding ground for GWSS, citrus groves play an important role in determining GWSS populations. The CDFA estimates that the California citrus industry spends approximately $3.5 million annually on programs and activities to comply with regulations to mitigate the spread of GWSS (table 2). The citrus industry has improved its effectiveness in containing the spread of GWSS through programs funded and established by the CDFA. As a result of the programs, the acreage of citrus treated for GWSS has declined substantially. In 2003, Kern County treated just over 20,000 acres and Tulare County treated nearly 40,000 acres. In 2009, Kern County treated nearly 5,000 acres and Tulare County treated about 9,500 acres.
Cost of vines lost to PD
California grape growers and consumers bear the greater part of the total cost of PD — more than the combined costs of nursery and citrus growers, and local, state and federal governments. Table 3 shows the estimated annual average value of vines lost to PD by region and grape type; across all regions and grape types using our most likely estimate of PD pressure, the average annual value of vines lost to PD is $56.1 million. This value is a lower-bound estimate of total cost because it does not include costs of preventive measures taken by growers against sharpshooters, including revegetation of riparian areas and pesticide use, or losses from land left idle. Examples of the calculations used to determine the table 3 values are given in table 4. The cost of these losses is the forgone net revenue from vines that die, plus the costs of roguing and replanting diseased vines. After discounting to the present value, the cost of replacing a diseased vine in Napa County was estimated to be $43.19 (table 4).
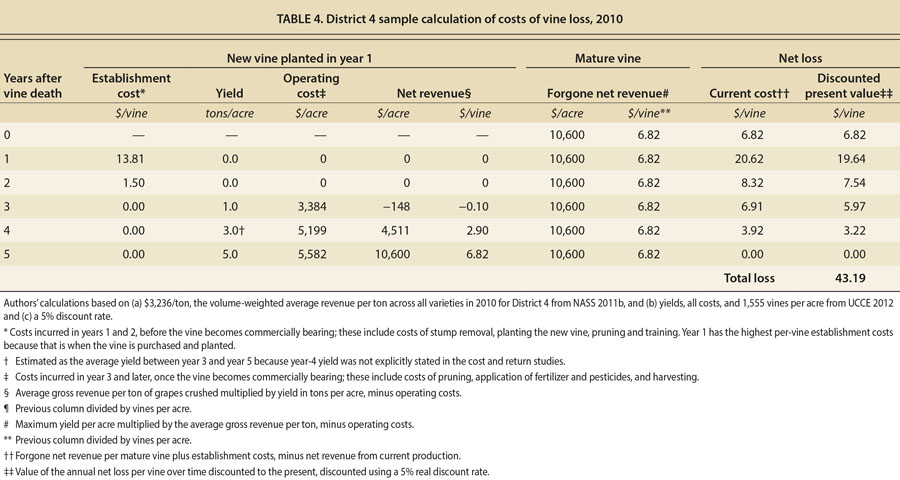
Table 3 shows the bearing acreage and corresponding costs to growers of wine, raisin and table grapes, by region, over a range of PD pressure, for which the most likely estimates imply an annual loss of $56.1 million by California grape growers. We drew on expert opinion to define the range and the most likely rates of disease pressure since hard data are not available; the value of lost vines ranges from $14 million (low PD pressure) to $165 million (high PD pressure) per year. The largest share of losses comes from wine grapes, followed by table and then raisin grapes. Of the wine grape regions, Napa-Sonoma (Districts 3 and 4) is the hardest hit, losing an estimated $34 million per year, making up more than half of the total losses to growers. District 4 (Napa County) has the highest annual losses, at over $23 million, because it has a relatively high rate of PD (0.75%) and the highest average price for grapes in the state, such that the value of the forgone net revenue is higher than in other areas. The same is true, but to a lesser extent, for District 3 (Sonoma and Marin counties).
Total and potential costs of PD
Aggregating the costs of vine losses and industry assessments paid by wine and table grape growers, compliance costs for nursery owners and citrus growers, and expenditures by government entities, the estimated cost of PD in California is approximately $104.4 million per year. The total cost is comprised of $48.3 million in funded activities undertaken by various government agencies, the nursery and citrus industries and the UC system, and $56.1 million in costs of lost production and vine replacement borne by wine, table and raisin grape growers.
These figures do not include any of the substantial costs of preventive measures against the spread of GWSS and blue-green sharpshooters within vineyards undertaken by growers, and thus can be considered a lower bound for total costs. A more complete examination of the costs of the disease to growers would include costs of preventive measures, but techniques vary greatly and the costs are not easily quantifiable. In the North Coast, prevention techniques include various forms of riparian revegetation, green fencing and pesticide application, while in Southern California insecticide application is by far the most common and effective tool in controlling sharpshooters.
The estimates of costs to growers reported here are conditioned by the presence of the prevention programs that limit the spread of GWSS. Future funding for PD-related programs is in doubt, given general budget issues combined with the arrival of new pests and diseases, which compete for funds and attention, and relatively low PD incidence in recent years. Indeed, the UC PD Research Grants Program has already ceased. Such decisions might come at a high cost.
In a related study, using a simulation model of the market for California wine grapes, we estimated that if GWSS were to become distributed throughout California, average annual costs of PD borne by growers, and ultimately consumers, of wine grapes would increase by $185 million under the most likely scenarios (Alston et al. 2013). Compared with the potential costs of PD, the current costs of Pierce's disease programs are relatively modest.
Citations
Pierce's disease costs California $104 million per year

