


All Issues
Monitoring soil carbon will prepare growers for a carbon trading system
Publication Information
California Agriculture 67(3):162-171. https://doi.org/10.3733/ca.v067n03p162
Published online July 01, 2013
NALT Keywords
Abstract
California growers could reap financial benefits from the low-carbon economy and cap-and-trade system envisioned by the state's AB 32 law, which seeks to lower greenhouse gas emissions statewide. Growers could gain carbon credits by reducing greenhouse gas emissions and sequestering carbon through reduced tillage and increased biomass residue incorporation. First, however, baseline stocks of soil carbon need to be assessed for various cropping systems and management practices. We designed and set up a pilot soil carbon and land-use monitoring network at several perennial cropping systems in Northern California. We compared soil carbon content in two vineyards and two orchards (walnut and almond), looking at conventional and conservation management practices, as well as in native grassland and oak woodland. We then calculated baseline estimates of the total carbon in almond, wine grape and walnut acreages statewide. The organic walnut orchard had the highest total soil carbon, and no-till vineyards had 27% more carbon in the surface soil than tilled vineyards. We estimated wine grape vineyards are storing significantly more soil carbon per acre than almond and walnut orchards. The data can be used to provide accurate information about soil carbon stocks in perennial cropping systems for a future carbon trading system.
Full text
California is the nation's most economically important state in terms of agricultural production, which was valued at $43.5 billion in 2011 (USDA NASS 2012). Of the 43 million acres of agricultural land in California, 37% (16 million acres) is grazed. Of the remaining cropland, three-quarters (20 million acres) is intensively irrigated, producing many varieties of annual row crops as well as high-value specialty perennial crops such as almonds and grapes. However, climatic changes, including rising temperatures and changing precipitation patterns associated with rising anthropogenic greenhouse gases, could pose a serious threat to crops in California (Hayhoe et al. 2004; Lee et al. 2011), and may influence the types and management of crops that can be grown in the state in the future.
To avert the detrimental effects of climate change in California, the state passed the California Global Warming Solutions Act of 2006 (AB 32). This legislation requires greenhouse gas emissions to be reduced to 1990 levels by 2020. Participation is currently voluntary for the agricultural industry but could possibly be made mandatory if measuring and monitoring protocols for agricultural emissions become more defined in the future.
Crop growers may be able to benefit from AB 32 by receiving financial incentives to implement agricultural practices that will reduce their greenhouse gas emissions, sequester carbon and assist the state in its quest to reach the 2020 emissions targets (Suddick et al. 2010). Further financial incentives may arise from a greenhouse gas emissions cap-and-trade or carbon credit system, where the industrial sector (including electricity, manufacturing and transportation) may purchase greenhouse gas emission offsets from crop growers instead of, or in addition to, directly reducing their own emissions (UCS 2009).
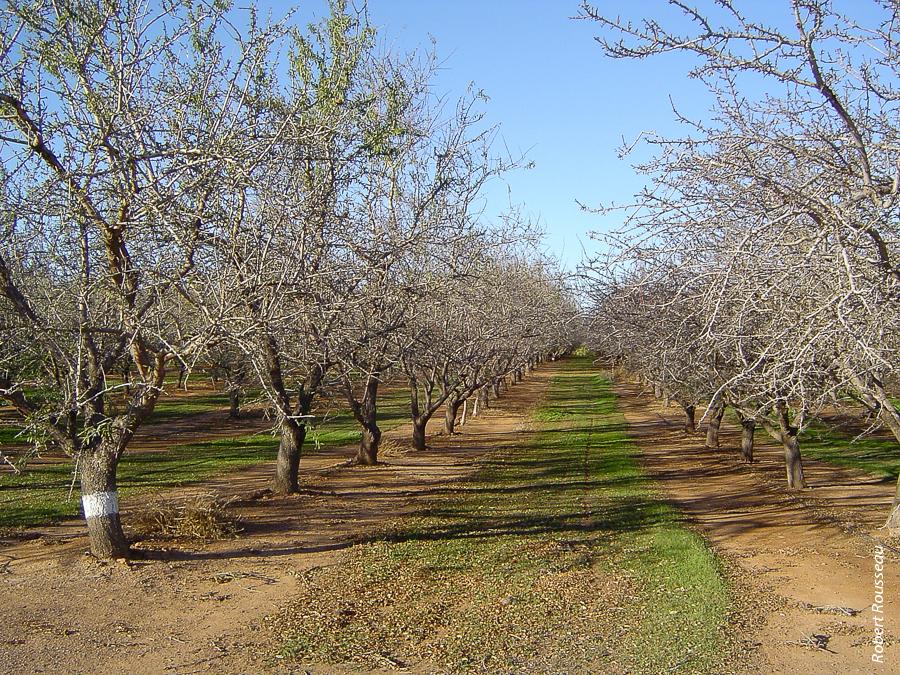
In an analysis of baseline soil carbon content in conventional and organic almond, walnut and wine grape acreages, researchers found that the organic walnut orchard had the highest total soil carbon. Above, a conventional almond orchard at Arbuckle, Colusa County.
Implementing a carbon credit system for agriculture would require a systematic method to accurately measure and account for agricultural greenhouse gas reductions and to quantify the amount of carbon stored in agricultural soils. However, little is known about greenhouse gas emissions from, and carbon sequestration potentials of, California's agricultural lands, especially for high-value specialty perennial crops such as walnuts, almonds and wine grapes (Suddick et al. 2011). Likewise, little is known about how changes in land management affect the total soil carbon content of the state's agricultural soils. Again, this is especially true for high-value specialty perennial crops (Suddick et al. 2010).
Monitoring soil carbon
Because perennial crops are drastically underrepresented in terms of carbon stock estimates and surveys, we developed and implemented a long-term soil carbon monitoring network for three high-value specialty perennial crops (walnuts, almonds and wine grapes) under various management practices and soil types in Northern California.
Long-term monitoring is needed because small changes in soil organic matter (SOM), which is the decomposed fraction of plant and animal residues that contributes to the overall productivity level of soils and its carbon content, is generally difficult to measure accurately over short periods due to the large background carbon stock already in the soil. Long-term monitoring will produce a time series of measurements that could be used in conjunction with process-based biogeochemical models (such as the CENTURY soil organic matter model; DayCent, the daily time step version of CENTURY; and the denitrification and decomposition, DNDC, model).
These models use mechanistic equations to represent plant growth, nutrient use and availability, water, soil carbon dynamics and greenhouse gas emissions, using data collected at the local farm scale or local data scaled up to a regional scale. Such models provide the predictive capabilities that are needed to evaluate and assess how soil carbon storage may be affected by any future alternative management and land-use change scenarios as well as by environmental factors. The inclusion of more field data from a long-term monitoring study (such as the one described here) will enhance the capacity of these models to predict future impacts of land use, especially for crops not measured previously, like the perennial crops in this study. Furthermore, time series provide the most rigorous validation data, leading to unbiased confidence in model outputs (Paustian et al. 2009).
Here, we outline methodology to provide verifiable estimates of current soil carbon stocks in perennial crops in Northern California. Our approach is built on methods described by Paustian et al. (2000) and Ogle et al. (2006). We also suggest how the data collected can be further used in voluntary carbon reporting using a greenhouse gas and carbon management accounting tool such as the CarbOn Management Evaluation Tool — Voluntary Reporting (COMET-VR). An online management tool, COMET-VR provides a simple, reliable method to estimate soil carbon sequestration based on estimates of annual soil carbon flux from the CENTURY model (Paustian et al. 2009). The CENTURY model is a biogeochemical model that estimates how changes in land management affect soil carbon. To help improve the accuracy of the COMET-VR accounting tool and the CENTURY model, baseline soil carbon stocks for California agricultural systems need to be assessed, especially for perennial crops, which have previously not been modeled due to lack of data required for model validation and calibration. Furthermore, the data collected during this study could ultimately be used in other databases that may be set up for a carbon credit trading system.
The main objectives of this study were to establish a pilot soil monitoring network that accounts for current and future soil carbon stocks in perennial cropping systems and allows comparison with soil carbon stocks in native ecosystems such as oak woodland and grassland in Northern California. To maintain the network, scientists will need to revisit the same sites at regular intervals, such as every 5 years. The long-term purpose of the network is to improve sequestration rate estimates by monitoring how land-use changes and land management practices affect soil carbon stocks over time, rather than providing single data points in time on soil carbon stores.
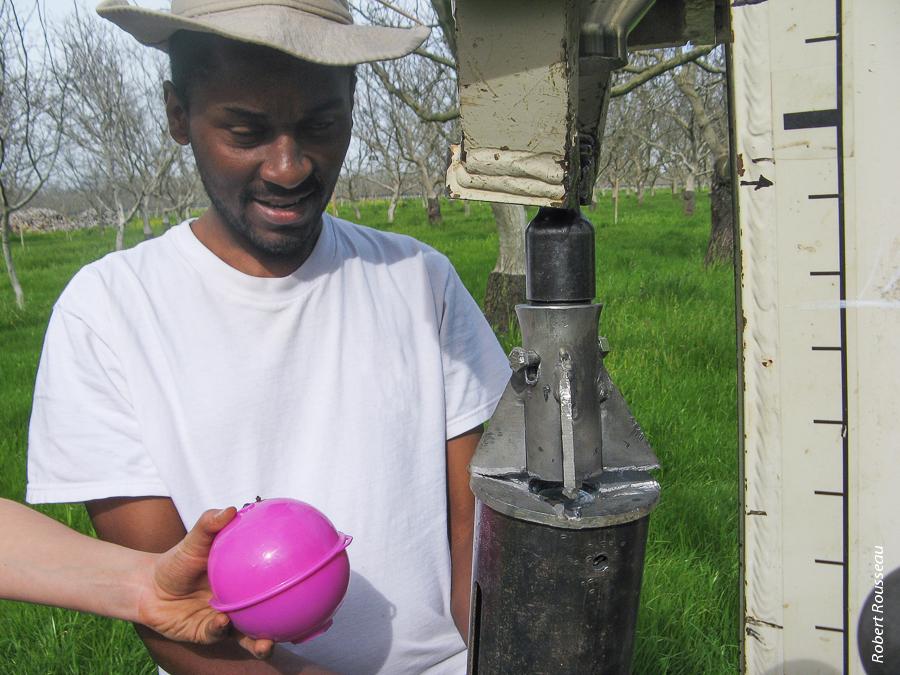
Developing baseline soil carbon estimates is the essential first step that will allow growers to calculate their carbon sequestration rate. Above, M.K. Ngugi with GPS marker ball at Dixon Ridge Farms, Winters.
In addition, because soil carbon is linked with soil quality, understanding relationships between soil carbon and other soil quality indicators is needed to understand or accurately predict carbon storage and carbon loss in agricultural land. The cycling of carbon and nitrogen in soils is intrinsically linked, and nitrogen, like carbon, is a critical component of soil organic matter. Therefore, we also gathered data on how management practices and land use affect nitrogen content, bulk density, coarse or fine texture, pH and soil moisture.
Here we present the initial baseline data collected.
Field sites
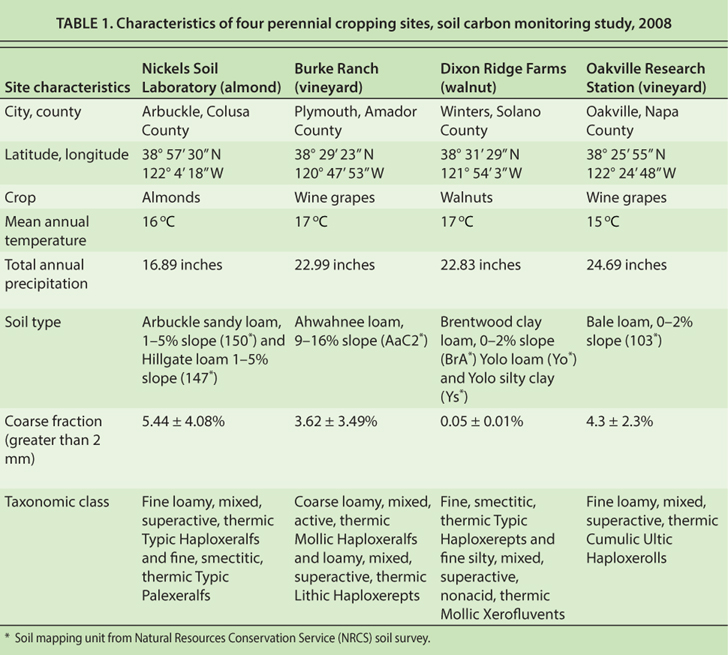
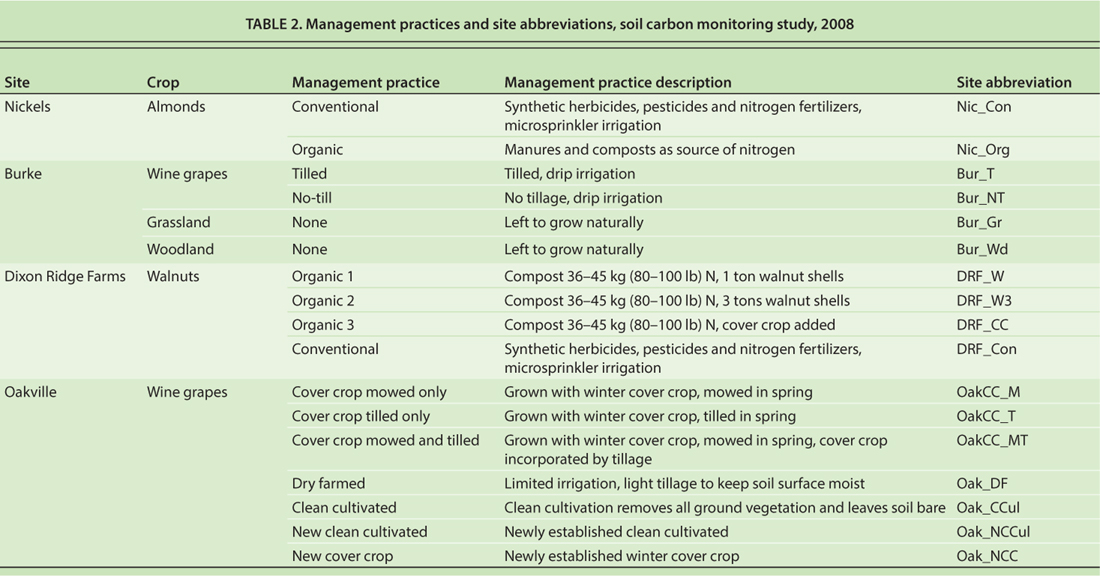
In early 2008, we established four field sites (an almond orchard, two wine grape vineyards and a walnut orchard) in four counties in Northern California (fig. 1, table 1). We chose high-value specialty perennial cropping systems because they are severely underrepresented in inventories of greenhouse gases and soil carbon stocks. We also sampled oak woodland and native grassland near one of the vineyard sites. At each site, we studied various agronomic management practices associated with the crop, such as cover cropping, no tillage, and conventional and organic farming (table 2).
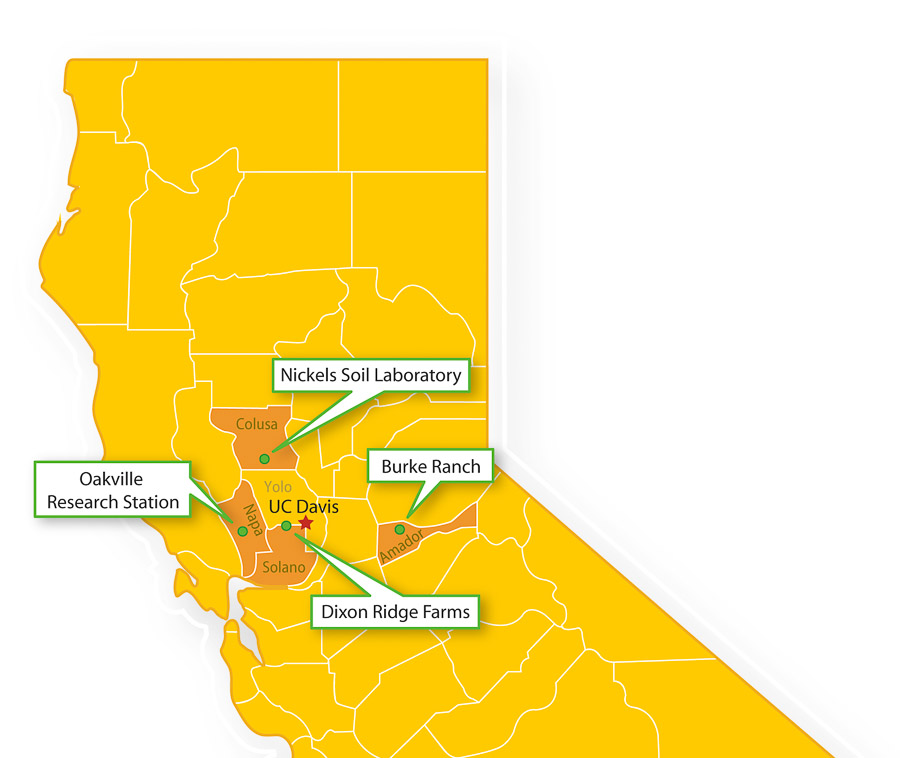
Fig. 1. Soil carbon sampling sites: vineyard at Oakville Research Station, Oakville, Napa Valley; walnut orchard at Dixon Ridge Farms, Winters, Solano County; almond orchard at Nickels Soil Laboratory, Arbuckle, Colusa County; vineyard at Burke Ranch, Plymouth, Amador County.
Nickels almond orchard.
We chose an almond orchard at Nickels Soil Laboratory, Arbuckle, Colusa County, and sampled both a conventionally managed orchard block under microsprinkler irrigation and an organically managed orchard block that was newly established (less than 3 years old).
Burke vineyard.
The Burke Ranch vineyard in Amador County had two treatments: conventional tillage and no tillage.
Burke native sites.
For comparison with the cultivated sites, we also sampled oak woodland and native grassland in the Burke Ranch property in Amador County. The two native sites provide a comparison between land currently under agricultural management and land undisturbed by any management. Additionally, these sites will provide a baseline for carbon and nitrogen stocks should the native sites be converted to agriculture in the future, thus providing an estimate of carbon (and nitrogen) loss following conversion to agriculture.
Dixon walnut orchard.
We chose a conventionally managed walnut orchard block at Dixon Ridge Farms in Winters, Solano County, that was homogenously tilled and had not had a cover crop planted for the past 20 years. Also at Dixon Ridge Farms, we chose an organically managed walnut orchard block that was adjacent to the conventional block. The organic walnut block was subdivided into three areas, with three regimes of waste orchard biomass and compost applications: (1) 1 ton of walnut shells and orchard waste prunings added with compost, (2) 3 tons of walnut shells added with compost and (3) cover crop and compost added.
Oakville vineyard.
The vineyard at the Oakville Research Station, Oakville, in Napa County, had many management treatments, including old and new cover cropping practices, dry farming and established old and new clean cultivation management.
Soil monitoring network
We created a soil network consisting of a total of 95 microplots over the three production systems. Each microplot consists of an equilateral triangle that is 6.6 feet (2 meters) on each side and from which three core samples are taken (fig. 2). This design is a modification of a protocol described by Ogle et al. (2006) that has been proposed as a method to be used for a nationwide soil monitoring network in the United States. A similar approach to both this study and the study by Ogle et al. (2006) was developed in western Canada for long-term monitoring of soil carbon on farms (Ellert et al. 2002). The triangular microplots are geo-referenced using a global positioning system (GPS) receiver that provides the exact spatial location and coordinates to allow precise resampling over time, thus helping to minimize the impact of spatial variability on measured soil carbon stock changes over time (Lark 2009).
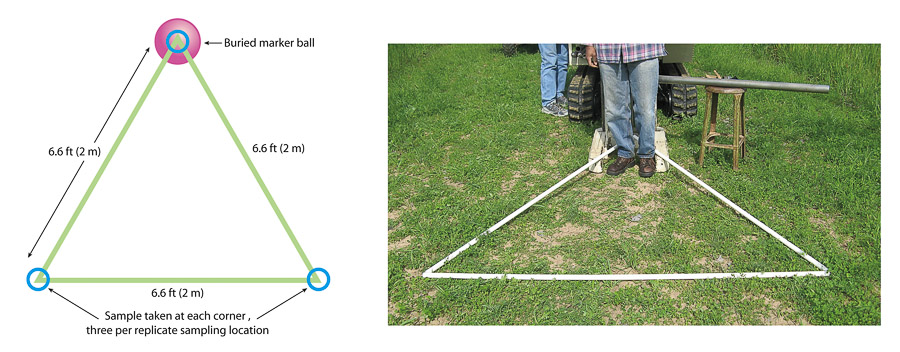
Fig. 2. Triangle layout for sampling soil cores. One core was sampled at 3.3 feet (1 meter) depth at each corner of the triangle, and the marker ball was buried 3.3 feet deep at the north point of the triangle. GPS locations were recorded for each corner of the triangle.
Microplots.
We chose to take three cores per microplot based on an analysis by Conant and Paustian (2002). The analysis showed that, when the number of cores is fixed, this triangular configuration is the most efficient way to minimize the coefficient of variation both within and between microplots. We used the triangular microplot design (fig. 2) in the walnut and almond orchards, woodland, and grassland. The apexes of all of the triangles pointed north (fig. 2), and we buried marker balls (Electronic Marker System, 3M Corp., Austin, TX) at the apex points to allow precise relocation of the microplots in the future. Each marker ball has a unique self-leveling transmitter inside it. When used with the locator (3M Dynatel Locator, 3M Corp., Austin, TX), the transmitter sends a signal between the marker ball and the locator, returning the exact location of the marker ball. The triangle design was not appropriate for vineyards because the rows were too narrow, so instead we took three replicate core samples over the length of the study rows. We buried a marker ball at the end of each vineyard row sampled and recorded how far each soil core sample was from the marker ball.
Soil samples.
We took soil samples that were 1.5 inches (3.8 centimeters) in diameter and 3.28 feet (1 meter) deep from a number of microplots established for each site (table 1) with a Geoprobe (Geoprobe Systems, Salina, KS), a direct-push hydraulically powered sampler. Samples in many previous studies on soil organic matter have been derived mainly from the upper 11.8 inches (30 centimeters) of soil, where management-induced changes to soil carbon generally occur. However, over a relatively long time period, the effects of changes in land use and management may be seen only at much deeper depths.
Three cores per microplot (with the initial sampling taken at each of the triangle apices) were taken and analyzed by increments in depth: top depth, 0 to 7.9 inches (0 to 20 centimeters); middle depth, 7.9 to 19.7 inches (20 to 50 centimeters); and deepest depth, 19.7 to 39.4 inches (50 to 100 centimeters). Samples were air dried in labeled plastic zip-top bags, sieved to less than 2 millimeters, and analyzed using standard methods for pH (1:1 H2O), total carbon and nitrogen (flash combustion and chromatographic separation, COSTECH), bulk density and soil moisture (Sparks 1996). Total soil nitrogen was measured as another indicator of soil quality.
Texture analysis was carried out by the Agriculture and Natural Resources Analytical Laboratory particle size analysis hydrometer method (Sheldrick and Wang 1993). Samples were then stored and archived for potential re-analysis at a future date. By archiving the soil samples, any new methodologies to measure soil carbon that may be devised in the future may be calibrated against soil samples already analyzed with previously established methods (Post et al. 2001).
Soil quality indicators
To characterize the current soil quality in the perennial cropping systems sampled in this study, we measured basic parameters such as soil pH, bulk density and moisture (table 3).
pH.
The pH was typically between a slightly acidic 6.1 to a slightly alkaline 7.9, and tended to increase with depth. All treatments at the wine grape vineyards and almond orchards had a soil pH between 6.1 and 7.4, which generally makes soil nutrients such as nitrogen and phosphorus more readily soluble and so more available to crops. All treatments at the walnut orchard in Dixon Ridge Farms had a soil pH above pH 7.5, which is slightly higher than the optimum soil pH for walnuts of 6.5 to 7.2.
Bulk density.
The bulk density was calculated based on the less-than-2-millimeter fraction of the soil collected. Coarse particles that did not pass through a 2-millimeter sieve (after some crushing) were also weighed, and the percentage of coarse fraction for the bulk soil samples was calculated (table 1). Because average coarse fractions were under 5% for most sites, fine bulk density was calculated for all soil samples at each site.
Values of bulk density (table 3) are necessary in order to convert the percentage total soil carbon obtained in the laboratory into a mass per unit area value (short ton carbon acre?1). Bulk density was also measured as an indicator for the level of compaction present in the soils at each sampling location; a high bulk density indicates low soil porosity and compaction of soil, which may result in soil erosion and poor plant growth and reduced yields due to shallow root growth. Bulk density is related to soil organic matter content: a soil containing high carbon and organic matter has a low bulk density.

Bulk density ranged from 1.10 to 1.79 g cm?3 at the top depth, was lowest in the Oakville vineyard with the cover cropped treatments (mowed only, tilled only, and mowed and tilled), and was highest in the Nickels conventional almond orchard. The bulk density generally increased with soil depth for all croplands under the various management practices. This was particularly true for the walnut orchard at the Dixon Ridge Farms site, where bulk density at the deepest depth was high, ranging from 1.52 to 1.61 g cm?3 in the organic blocks and 1.41 g cm?3 in the conventional block. The exceptions were the Nickels, Oakville and Burke sites, where bulk density was higher in the middle layer than in the top or deeper soil layers. Bulk density in the middle layer ranged from 1.23 to 1.90 g cm?3; the lower values were in the cover crop mowed and tilled plot at the Oakville vineyard, and the upper values were in the conventional plot at the Nickels almond orchard.
The bulk density data suggest that there may be a plow pan layer, which is a hard layer of subsoil or clay, at the middle depth at the vineyard and almond sites. The presence of a plow pan layer would be consistent with the soil types at these sites, which have a well-developed subsoil, or Bt horizon, which indicates the accumulation of silicate clay in these soils. A plow pan layer can also be associated with tillage practices, including disking, plowing and mowing, which can cause soil compaction and damage to the soil structure as heavy machinery passes over the soil. This may explain the high bulk density values within the vineyard sites as they were all subjected to some tilling. Additionally, the organic orchard at the Nickels site was approximately 3 years old at the time of sampling, and the high bulk density observed within the middle soil layer may be a result of disking and plowing practices that occurred approximately when the organic orchard was planted, although the conventional block at Nickels also had a high bulk density, which is more typical in sandy soils like those at Nickels.
Soil moisture.
Soil moisture ranged from 2.6% (Burke grassland) to 24.6% (Dixon Ridge Farms) in the top depth of the soil. The sandy soils present at both the Nickels almond orchard and the Burke Ranch site resulted in the lowest soil moisture of all of the study sites (table 3). The three organic walnut blocks at Dixon Ridge Farms, all had higher soil moisture than the conventional block. This is most likely due to the application of the walnut shells and compost, which when left on the soil surface reduces the loss of moisture through the reduction of evapotranspiration.
Baseline soil carbon and nitrogen
Here, we report baseline carbon and nitrogen values as the mass of carbon or nitrogen per unit area of soil (table 3), calculated using bulk density measurements at each of the three depth increments for all sites and all management practices (fig. 3).
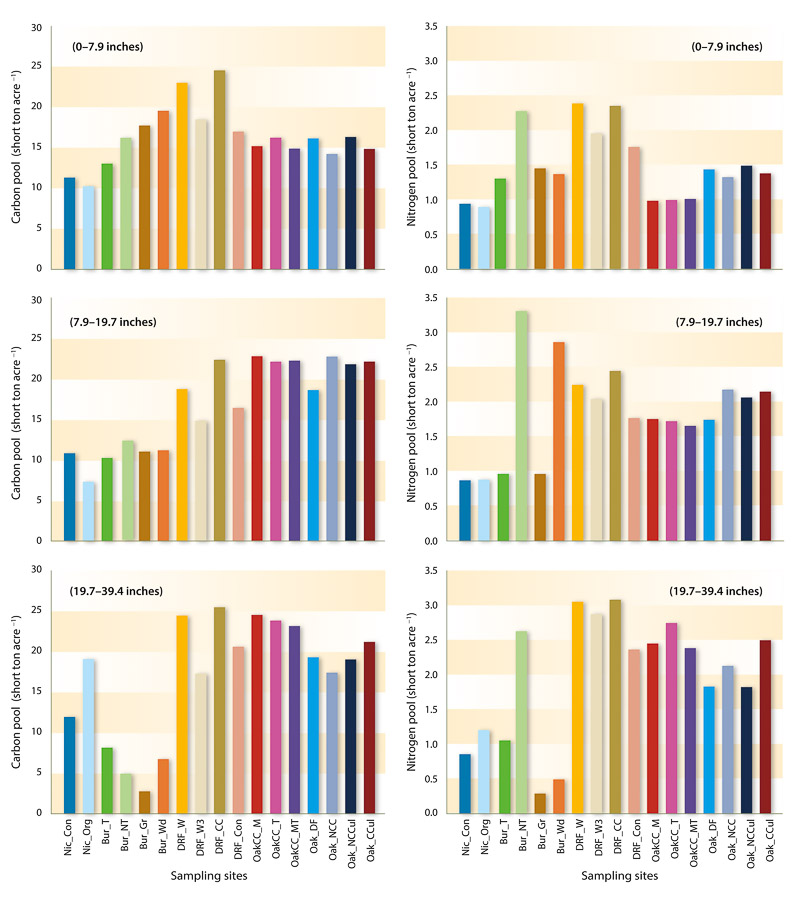
Fig. 3. Carbon and nitrogen at three depth increments for each management practice at the almond and walnut orchards and the wine grape vineyards, and native grassland and oak woodland sites. Sampling site abbreviations are explained in table 2.
Carbon stocks.
At the top depth, carbon totals ranged from 10.30 to 24.58 short ton acre?1 (23.06 to 55.05 Mg ha?1, mean 36.86 ± 8.15 Mg ha?1) (mean 16.46 ± 3.40 short ton acre?1), were lowest in the organic almond orchard at Nickels and were highest in the organic 3 block (DRF_CC) of the Dixon Ridge Farms walnut orchard. The high carbon stocks in the top depth of all three organic blocks of the walnut orchard may be due to the large amount of waste walnut shells, orchard prunings, manures and composts that have been added to the soil over the years. Furthermore, compared to the conventional walnut orchard block, blocks 1 and 3 of the organic walnut blocks also had significantly more carbon at the top and middle depths (P = < 0.001) (fig. 3). Again, this is most likely due to the higher inputs of carbon added to the organic blocks than to the conventional orchard. Previous studies have reported similar increases in soil carbon related to organic management practices (Kong et al. 2005; Lal 2004).
However, the average soil carbon was not higher in organic than in conventional systems in the almond orchards at the Nickels site, which had the lowest carbon values of all of the sites. In fact, at the top depth, carbon was slightly higher in the conventional almond orchard than in the organic orchard. This is most likely due to the fact that this organic orchard was less than 3 years old, while the conventional orchard was approximately 20 years old. Due to its early stage of growth, the organic orchard probably had less belowground biomass, which would result in lower soil carbon levels. The young organic orchard at Nickels offers a unique opportunity to show the long-term trend of carbon stocks from a newly organic-converted orchard as it grows.
At Burke Ranch, carbon was highest in the no-till vineyard. Compared to the tilled vineyard at the top and middle depth, soil carbon was 27% higher in the no-till vineyard. Previous studies have also shown that soil carbon generally increases in the surface layer of soil under no-till practices (Paustian et al. 2000; Six et al. 2002), which decrease soil disturbance and therefore mineralization of carbon (Veenstra et al. 2007). However, soils appear to have a saturation point, at which their capacity to increase soil carbon reaches an equilibrium.
At the top depth, carbon levels were similar amongst the various practices at the Oakville vineyard site, but tended to be highest in the dry farmed, tilled and new clean cultivated treatments. Dry farming involves less irrigation, which encourages vine roots to grow deeper in search of moisture, increasing carbon in the middle and deepest depths (fig. 3).
Carbon and soil depth.
In the Oakville vineyard, carbon stocks increased at the plow pan layer, in the middle depth, at all sites (fig. 3). This carbon increase may be due to tillage and cover crop incorporation practices, which mix the organic matter into the lower soil levels. At Burke Ranch, carbon stocks were lower beneath the plow pan layer and higher in the top soil layer at all sites, including the woodland and the grassland. Woodland and forest soils generally have more organic matter on the soil surface (leaf litter) and in the upper soil layers (Murty et al. 2002). In the Nickels almond orchard, carbon was higher in the deepest layer of the organic block than in the conventional orchard; however, this was not statistically significant. This difference is most likely due to the fact that when a new orchard is being prepared, the old orchard is deep ripped and plowed but the deeper perennial roots are left in the ground. New trees are then planted on top of the underground remnants of the old orchard, and this abundant belowground biomass sequesters carbon in the deeper soil layers.
Nitrogen.
At the top depth (0 to 7.9 inches), nitrogen ranged from 0.90 to 2.37 short ton acre?1, with an average of 1.48 short ton acre?1 (± 1.52) (2.01 to 5.32 Mg ha?1, mean 3.32 ± 1.10 Mg ha?1). The lowest values were in the organic and conventional almond orchards, with similar values in the cover crop series at the Oakville vineyard. The highest values were in two of the organic blocks of the walnut orchard. In general, soil nitrogen did not exhibit significant changes with increasing soil depth (fig. 3).
Land use and soil carbon.
We observed that the variance in carbon and nitrogen content between the cropping systems and management practices studied is related to the different inputs and outputs under each management type. For example, soil carbon and nitrogen were higher in no-till than in conventional tillage in the Burke vineyard. Additionally, soil carbon levels were higher in the organic walnut orchard blocks (which had greater inputs of organic matter) and the Oakville plots with cover crops than in the Nickels almond orchard, which did not have cover crops. Thus, as has also been observed in previous studies (Paustian et al. 2000; Six et al. 2002), land use and management practices are important factors in determining soil carbon content (Lal 2004).
Soil carbon by crop.
Using very simple calculations based on our soil carbon data set, we extrapolated estimates of the total amount of carbon in each of the three soil depth increments as well as the cumulative total for the top 3.28 feet (1 meter) of soil for each of our study sites (table 4). Based on the total acreage of each of the sampled perennial crops within California, we also estimated the total soil carbon in each crop type statewide. We caution that our estimates are crude and a more detailed future analysis should be undertaken to include actual distribution of crops in relation to soil type and climate regime. That said, we do provide basic numbers of total carbon in perennial cropping soils.
Our estimates indicate that wine grapes already store a great amount of carbon under current land use in California (including management practices such as cover cropping, conventional tillage, no-till and dry farming). Specifically, altogether, the state's wine grape vineyards store approximately 7.23, 9.19 and 8.47 × 10⁷ tons of carbon at depths of 0 to 7.9, 7.9 to 19.7 and 19.7 to 39.4 inches (0 to 20, 20 to 50, and 50 to 100 centimeters), respectively (table 4). California walnut and almond orchards currently store approximately 5.90 and 5.25 × 10⁶ tons of carbon, respectively, at 3.3 feet (1 meter) depth.
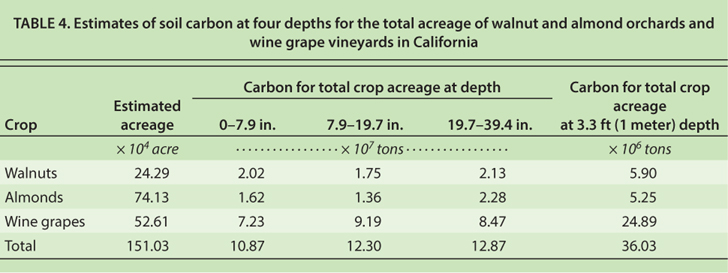
TABLE 4. Estimates of soil carbon at four depths for the total acreage of walnut and almond orchards and wine grape vineyards in California
How growers can use baselines
Baseline soil carbon values can be used to create carbon inventories at the farm scale, which detail the total carbon stored on site. They are a useful tool for future management and decision making that can be used to estimate and understand carbon emissions and storage and the management practices that affect soil carbon. Developing baseline soil carbon estimates is the essential first step that will allow growers to calculate their carbon sequestration rate. That rate is required if they are to calculate credits that could be traded or sold to regulated companies from industries seeking to offset their emissions.
Some examples of the offsets that growers could sell are those related to sequestering carbon in soils, including cover cropping and no-tillage operations. Additionally, growers may use the COMET-VR online management tool, which can be run by answering simple questions about their land (e.g., state, county, size, soil type, crop rotation and tillage), and in return they obtain a soil carbon sequestration amount over 10 years based on the CENTURY model output. They can also observe how much carbon they could sequester on their land if they changed to more carbon friendly management/grower practices (e.g., reduced tillage). A grower who registers these carbon values now as credits through the Voluntary Emission Reduction Registration Program may in the future be able to trade such credits. Additionally, registered credits may go toward obtaining financial incentives from other programs such as the Environmental Quality Incentive Program, which provides technical and economical assistance for enhancing conservation efforts, including those to reduce greenhouse gas emissions and increase carbon sequestration.
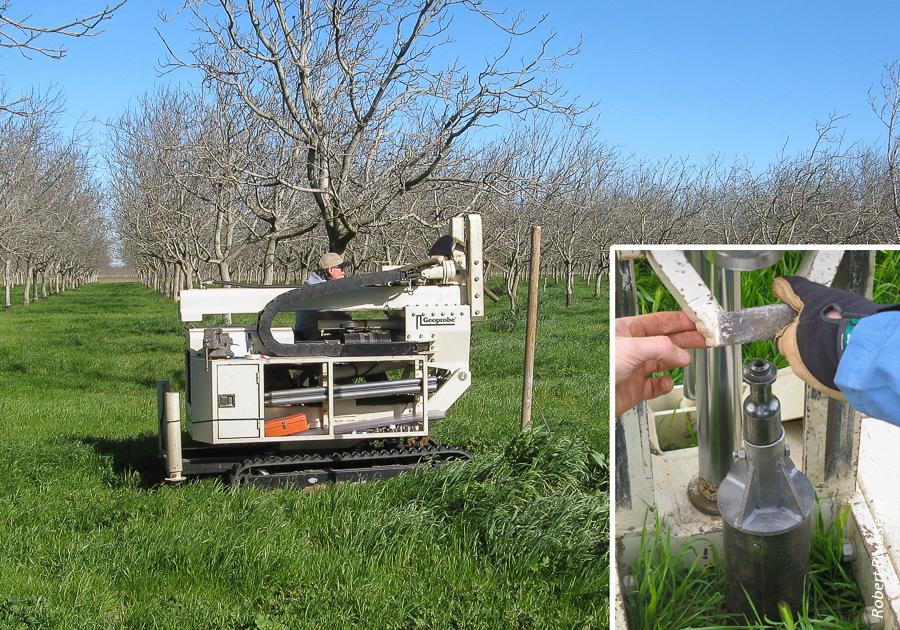
Geoprobe sampling at Dixon Ridge Farms organic walnut orchard. Inset, geoprobe soil core sampling to a depth of 39.4 inches (1 meter).
Long-term soil carbon monitoring
Establishing this soil monitoring network has provided essential data for further analysis of how soil types, crop type and management practices interact to affect carbon storage in perennial cropping systems, which will enable future assessments of soil carbon at the local and regional scale. Furthermore, the data from this study will contribute to the validation and verification of biogeochemical simulation models and voluntary carbon reporting such as COMET-VR for perennial orchard and vineyard systems, crops not modeled previously in Northern California (Paustian et al. 2009).
There have been many approaches to monitoring soils at a national level, but few have been successful or implemented in California. Our results suggest that continuing this soil monitoring network for the foreseeable future will allow us to detect carbon and nitrogen trends both in the soil surface layers and into the deeper subsurface layers of Northern California perennial cropping systems with changing land-use and management practices.
Our soil monitoring system is simple and, due to the high sample volume, provides precise, unbiased estimates of soil carbon stocks for the many different management practices, both organic and conventional, in different perennial cropping systems in Northern California. These estimates can be used for future carbon accounting and reporting requirements in a possible future cap-and-trade, low-carbon economy. In addition, our system provides the verifiable and comparable results needed for carbon reporting systems. Continuing this network and extending it to Southern California are essential to efficiently monitoring carbon fluxes statewide.
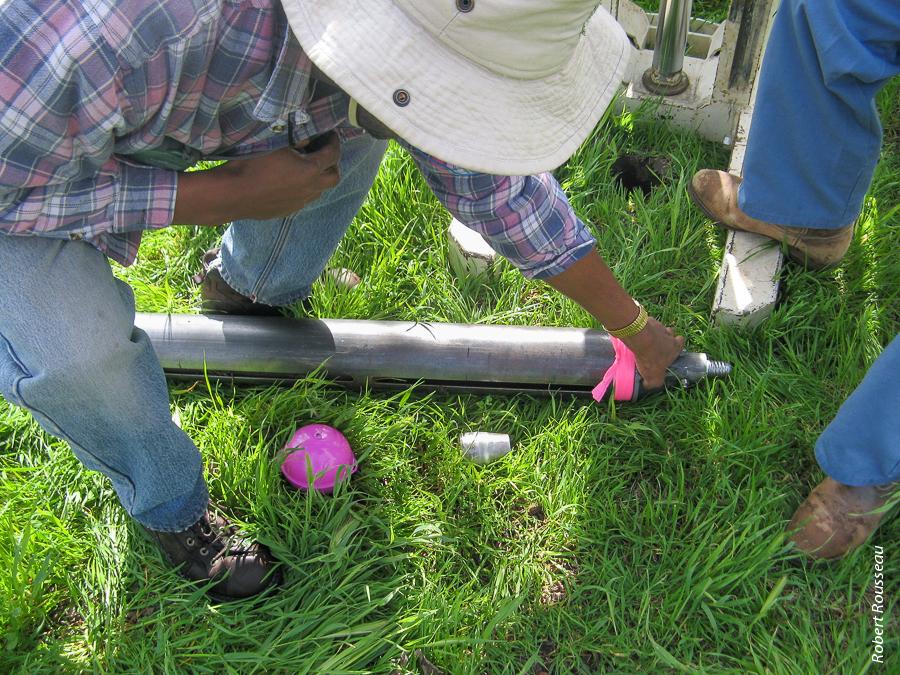
To characterize soil quality, researchers took soil samples and measured soil pH, bulk density and moisture. Above, soil core and GPS located marker ball at Dixon Ridge Farms.
While our soil monitoring network is currently used to quantify carbon stocks in perennial crops of Northern California, the network system could also be applied and used to collect and estimate total carbon and nitrogen stocks in other crops statewide, as well as on a national or global scale. If others implemented the same system, it would give a greater overall picture of carbon content deep in the soil of agricultural lands. Adopting a common system would also facilitate comparing management practices and land uses with each other, as all samples would have been collected, analyzed and archived with a similar approach.
Crop growers in the state would receive the major potential benefit of implementing this soil monitoring network. Knowing how much carbon their agricultural land holds and its potential for carbon sequestration would give growers the information needed to participate in a future carbon trading system, which may be established in a low-carbon economy. Accurate information of carbon stocks provides a possible financial incentive through carbon credits that can be sold to other industries regulated by greenhouse gas emission caps.
Furthermore, even without a carbon trading system, California growers could benefit from understanding how various land management practices affect both soil carbon and soil quality. For example, soil quality is pertinent to crop production and to ensuring sustainable food security for the future. By knowing the current soil quality and how management and land-use changes could improve the soil, growers will be able to optimize their management regimes. For example, they could use reduced tillage as well as incorporate cover crops and other biomass residues into soils to enhance nutrient retention, sequester carbon and enhance water infiltration, thus improving soils for a more sustainable crop-growing future.
Citations
Monitoring soil carbon will prepare growers for a carbon trading system

