


All Issues
Water sensors with cellular system eliminate tail water drainage in alfalfa irrigation
Publication Information
California Agriculture 65(4):202-207. https://doi.org/10.3733/ca.v065n04p202
Published October 01, 2011
PDF | Citation | Permissions
Abstract
Alfalfa is the largest consumer of water among all crops in California. It is generally flood-irrigated, so any system that decreases runoff can improve irrigation efficiency and conserve water. To more accurately manage the water flow at the tail (bottom) end of the field in surface-irrigated alfalfa crops, we developed a system that consists of wetting-front sensors, a cellular communication system and a water advance model. This system detects the wetting front, determines its advance rate and generates a cell-phone alert to the irrigator when the water supply needs to be cut off, so that tail water drainage is minimized. To test its feasibility, we conducted field tests during the 2008 and 2009 alfalfa growing seasons. The field experiments successfully validated the methodology, producing zero tail water drainage.
Full text
Alfalfa is a major crop in the western United States, cultivated on 1.1 million acres in California, and it is the largest water user of all the state's crops. It accounts for nearly 20% to 27% of California's irrigation water use (Hanson and Putnam 2000). Alfalfa (Medicago sativa L.) is predominantly flood irrigated (Schwankl and Prichard 2003), with or without cutting off or “checking” the flow before water reaches the bottom of a row. In these systems, the alfalfa field is divided into bays, which are separated by parallel ridges or borders. Water flows down the field's slope as a sheet guided by the ridges. On steeply sloping lands, the ridges are more closely spaced and may be curved to follow the land's contours.

To irrigate alfalfa, water is pumped in at the top of rows and flows down to the end. If the flow is not turned off before it reaches the bottom, substantial runoff can result. A system utilizing water sensors and cellular communications can help irrigators to minimize such runoff.
The check technique is often inefficient in terms of water use and management, because water often runs off at the end of the row. Efficiency can be improved if the water is cut off at the right time, before it reaches the bottom end of the field. The wetting front (the front trajectory of the moving water) then advances to the end of the field, but runoff is minimized, conserving water and improving application efficiency.
Under current practice, the alfalfa irrigator makes several trips to the field to determine when the wetting front has reached a certain distance from the tail (bottom) end of the check before turning off the irrigation. Even making several trips, the irrigator may miss the wetting-front advance, which results in excessive tail water drainage.
Our research sought to develop an efficient alternative irrigation method. We investigated a wetting-front advance sensor with a cellular communication system, to detect the arrival of the water at a predetermined location and eliminate the need for several trips to the field. However, reducing tail water drainage and improving efficiency would still depend on the irrigator's judgment of the cutoff distance (how far the water was from the bottom of the field). Cutoff distance and time can be precisely determined using a volume balance model. (This model equates the sum of the volumes of surface water [SW] and infiltrated water [IW] to total applied water [TAW]. Assuming a constant volume of infiltration per unit length of the border and a constant inflow rate, the volume balance is TAW = SW + IW). With this model, irrigation system characteristics (inflow, length, slope and surface roughness) and soil infiltration must be known. In general, irrigation system characteristics are known or can be obtained easily, but infiltration characteristics are not known without taking field measurments. As a result, available surface irrigation models, which do not consider local soil infiltration characteristics, cannot be used to determine accurate cutoff times for managing check irrigation. The alternative we considered was to evaluate infiltration parameters using real-time information on the wetting front's advance provided by sensors in the field.
Upadhyaya and Raghuwanshi (1999) characterized furrow infiltration by the Horton infiltration function and represented the trajectory of the wetting front's advance by an empirical exponential function. A decade later, Saha et al. (2009) published details of a modified Horton infiltration equation that could accurately model the field-observed wetting-front advance in a check-irrigated system. It seemed possible then to accurately determine irrigation cutoff times by combining a wetting-front sensing system with the water advance model. Our research tested the feasibility of this approach in alfalfa field trials during the 2008 and 2009 growing seasons. Our objectives were (1) to develop and evaluate wetting-front sensors that incorporate a cellular communication system and (2) to develop a water advance model for managing cutoff irrigation in check-irrigated alfalfa.
Designing a sensing system
Water sensor
The task was to develop a sensor that recognized the presence of water within a check. Our idea was to use two separated metal electrode terminals, between which an electrical circuit would close when water arrived; sudden changes in resistance or voltage at the terminals would then be transmitted to a data logger. When we talked to local growers, we were advised to develop a sensor that would not interfere with cultural operations such as harvesting, so we designed one that would be buried less than 2 inches below the soil surface.

The wetting-front sensor consists of a plastic container surrounded by a gravel and sand jacket.
We investigated several designs. The most reliable sensor consisted of two conductive terminals with a fine wire mesh surrounding them, enclosed by plastic plates (fig. 1). The diameter of the plates is about 3 inches, and the gap between the two terminals is about 1 inch. To facilitate drainage, the unit was surrounded by gravel and sand and placed in a plastic container with a hole at the bottom. The jacket of gravel and sand also helped to avoid clogging the sensor with fine-textured soil. The wire leads were about 6 inches long and extended beyond the sensor jacket, making it easy to connect the sensor to a data acquisition system.

To be sure of the sensor's responsiveness, we performed laboratory tests and recorded the change in resistance under dry and wet conditions. These tests revealed that the sensor resistance was high (about 3,000 micro-ohm [mohm]) when there was no water inside the sensor units (dry) and low (around 700 mohm) when the units were filled with water (wet).
Suitable circuitry was designed to interface the sensors to the data logger (Model CR 3000; Campbell Scientific, Logan, UT). The data logger was programmed to record sensor responses and the time in Julian day, hour, minute and seconds.
Cellular communication system
Several components supported the cellular communication system (fig. 2). The data logger monitored the wetting-front sensors at regular time intervals (every 5 seconds). When the resistance between terminals of a particular sensor dropped from high to low, the data logger generated an alert message consisting of the check number, sensor number and water arrival time.
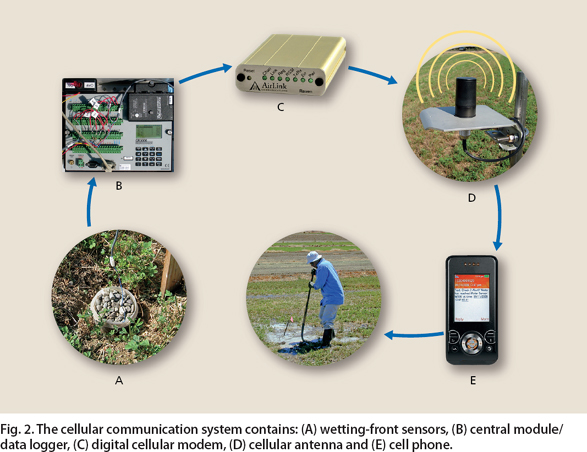
Fig. 2. The cellular communication system contains: (A) wetting-front sensors, (B) central module/data logger, (C) digital cellular modem, (D) cellular antenna and (E) cell phone.
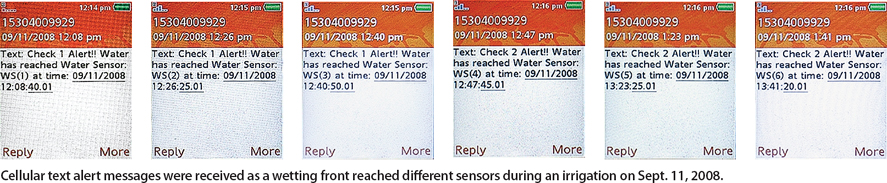
Cellulartext alert messages were received as a wetting front reached different sensors during an irrigation on Sept. 11, 2008.
To transmit this message to the irrigator, the data logger was interfaced with a GPRS (General Packet Radio Service) or EDGE (Enhanced Data rates for GSM Evolution) digital cellular modem (Raven 110; Campbell Scientific). The modem, a full-duplex Airlink product compatible with AT&T digital cellular networks, transmitted the alert to the local cellular tower with an 800 MHz 1 dBd Omni cellular antenna, using either the GPRS or EDGE network. The data string was then sent from the tower to the designated cellular phones of the irrigators in the form of text alerts.
Water advance model
Saha (2010) showed that the wetting-front advance can be modeled by the following relationship, based on the modified Horton infiltration function:

where A is the wetted area (square feet) of the alfalfa check;

is the maximum area (square feet) that can be irrigated with a steady inflow rate, q (cubic feet per minute); if is the final infiltration rate (feet per minute); t is the elapsed time (minutes) since the beginning of irrigation; c is given by

Ii is the magnitude of initial infiltration (feet); and h0 is the average depth of water (feet) above the soil surface during an irrigation event. Note that h0 could be found by multiplying the depth of water at the inlet (for example, hi) by a surface shape factor (for example, σ0), such that h0 = hiσ0. While the values of σ0 range from 0.77 to 0.80 for surface irrigation hydraulics, a value of 0.80 is commonly used for level surfaces (Guardo 1988).
In surface irrigation, particularly of Yolo silt loam or clayey soils, infiltration is often characterized using the Kostiakov equation, which does not include the steady state infiltration term if (Colla et al. 2000; Holzapfel et al. 2004). Therefore, in the present study, if we neglect if (i.e., c is negligible), the velocity (v) becomes constant and can be shown to be (Saha 2010):

Field tests conducted during our investigations have indicated that this assumption of if = 0 is reasonable. The error introduced due to this assumption in water-arrival time at the field end was always less than 15 minutes. Equation 2 can be solved for the magnitude of initial infiltration Ii once the wetting-front velocity is known from sensor recordings, since inflow rate (q), check width (w) and average depth of water (h0) are known or measured values. This value of Ii can be substituted in equation 3 to obtain irrigation water cutoff time (t0):
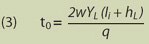
where t0 is the time (minutes) at which water is to be turned off following its arrival at the sensor, YL is the distance (feet) to the tail end of the check from the sensor location and hL is the height of water (feet) when the wetting front arrives at the tail end. Note that the irrigator selects a value of hL based on an acceptable amount of drainage.
Alfalfa field studies
To test the wetting-front sensing system and related water advance model that we developed (see box), we conducted experiments in a conventional flood-irrigated alfalfa field of Yolo silt loam soil on the UC Davis campus. The field contained 48 alfalfa checks, out of which four checks (A, B, C and D) were selected (fig. 3). Each check was approximately 720 feet (220 meters) long and 50 feet (15 meters) wide, with a slope of 0.01%. Checks on the field edges were excluded to avoid edge effects. The two checks adjacent to our test checks were separated by slightly raised (around 4-inch [10-centimeter]) ridges. To monitor the advance rate of the wetting front, three sensors were placed in each check along the direction of flow. The distance between two adjacent sensors was 25 feet (about 8 meters). Apart from the sensors, six flags were also placed in each check (fig. 3), to allow manual monitoring of the water advance rate during irrigation and comparison with the sensor results. These monitoring locations help in capturing the shape (front trajectory) of the wetting front as well as determine its velocity.
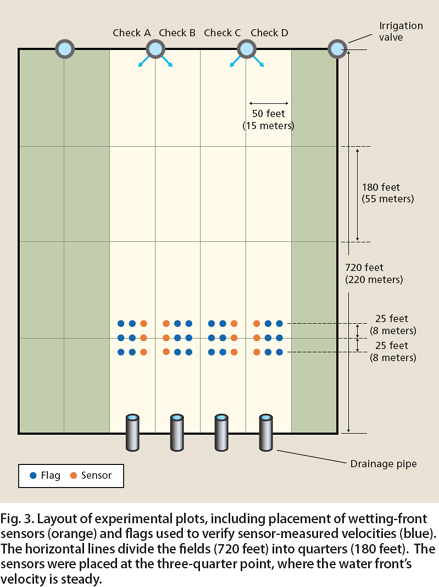
Fig. 3. Layout of experimental plots, including placement of wetting-front sensors (orange) and flags used to verify sensor-measured velocities (blue). The horizontal lines divide the fields (720 feet) into quarters (180 feet). The sensors were placed at the three-quarter point, where the water front's velocity is steady.
In the control checks, which received conventional flood irrigation, water was allowed to reach the end of the check before the source valve was turned off; in these four cutoff trial checks, water was cut off at a distance predicted by the water advance model, assuming a tail water height of 2 inches (5 centimeters). Seven sets of irrigation were performed during the 2008 growing season between May and October (May 23–24, June 5–6, June 26, Aug. 4–5, Aug. 19–20, Sept. 11–12 and Sept. 25–26). Since one inflow valve irrigated two side-by-side checks (either A and B, or C and D) during an irrigation (fig. 3), only one of the two was monitored for ease of operation. For example, on May 28, 2008, checks A and B were both irrigated, but only check A was monitored. During each irrigation set, the check to be monitored was selected randomly. Similarly, two sets of irrigations were performed during the 2009 season (Sept. 12–13 and Sept. 28–29); in the Sept. 12, 2009, irrigation, both the side-by-side checks were monitored.
During all of them, inflow was monitored with a portable Doppler flow meter (PDFM 4.0; Greyline, Massena, NY), and drainage was recorded with an area velocity flow meter (AVFM II; Greyline). The time of water arrival at each designated location was recorded either manually (from flag positions) or with a CR 3000 data logger (from sensor positions). In this setup, a CR 3000 data logger can monitor up to six buried sensors — two checks — simultaneously.
The wireless system can easily be moved from one location to another, reducing the initial investment necessary to implement the system.
System assessment
The cellular communication system, designed to generate text alerts when the wetting front reaches individual sensors, worked well. The communication lag time was less than 5 seconds for all irrigations.
The wetting-front arrival time was monitored manually for all nine locations (six flags plus three sensors) in each check. The velocity of the wetting front between two consecutive monitoring locations along the flow was determined by dividing the distance between them by the time difference in water arrival at these locations. We plotted the observed versus sensor-predicted wetting-front velocity for all the tests (fig. 4A). The very high R2 value (coefficient of determination) of about 0.94 between the observed (based on nine monitoring points in each check) and sensor-predicted (based on three sensor points in each check) velocities suggests accurate prediction by the wetting-front sensors when they were placed 25 feet (about 8 meters) apart.
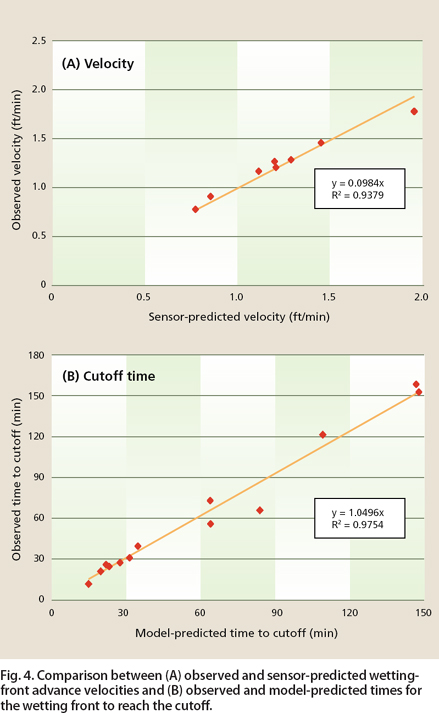
Fig. 4. Comparison between (A) observed and sensor-predicted wetting-front advance velocities and (B) observed and model-predicted times for the wetting front to reach the cutoff.
The experimental data was analyzed using the water advance model to obtain initial infiltration (Ii) based on the measured values of wetting-front advance velocity obtained from the sensors, inflow rate and average water depth (surface storage). This information was used to estimate the cutoff time and the location of the wetting front at the cutoff time. We compared the observed and model-predicted times for the wetting front to reach the cutoff point for all 2008 and 2009 irrigations (fig. 4B). The very high R2 (> 0.97) and a slope that is close to 1.0 (i.e., slope of 1.05 indicates an error of about 5%) between the observed and predicted times reconfirms that the cutoff irrigation system developed in this study is reliable.
Furthermore, the conventional flood irrigation resulted in a substantial volume of drainage water loss, between about 5,800 and 10,000 liters per irrigation, whereas our cutoff irrigation system resulted in zero tail water drainage for all irrigations (table 1). (The drainage pipe was placed at a height equal to the allowable height of water at the tail.)
After successful testing of the system (with three sensors per check), local growers were asked for their impressions. They indicated a strong preference for a wireless system, since rodents often chew wires in the field and installing the sensors requires additional field operations (although the sensors can be left in the field for several years). In response, we developed a completely wireless system. The single sensor communicates with a central module wirelessly when it senses the wetting front (fig. 5). The central module can monitor up to 99 wireless wetting-front sensing devices within a 2-mile radius and generate a cell-phone message to the irrigator when water arrives in a specific check at the desired location. The text message is generated in the same way as in the earlier system, and the wireless system works reliably.
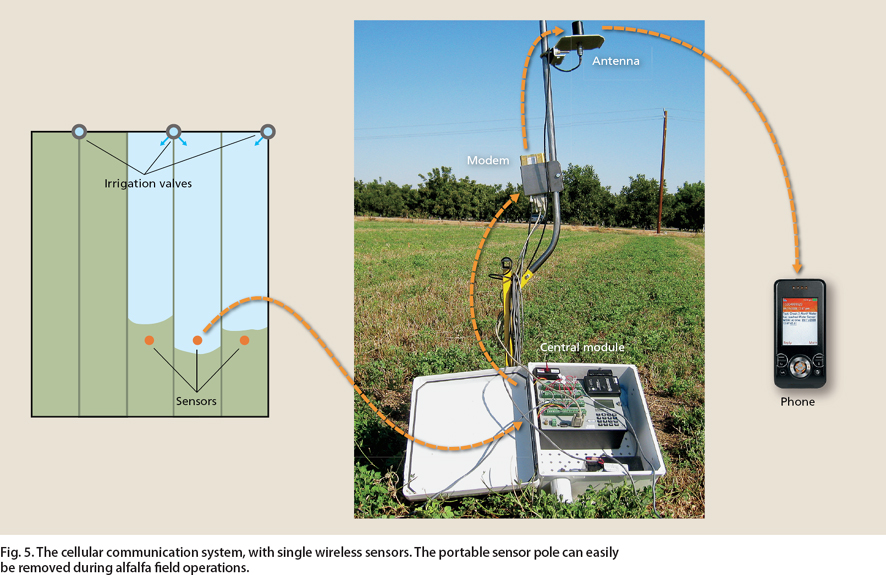
Fig. 5. The cellular communication system, with single wireless sensors. The portable sensor pole can easily be removed during alfalfa field operations.
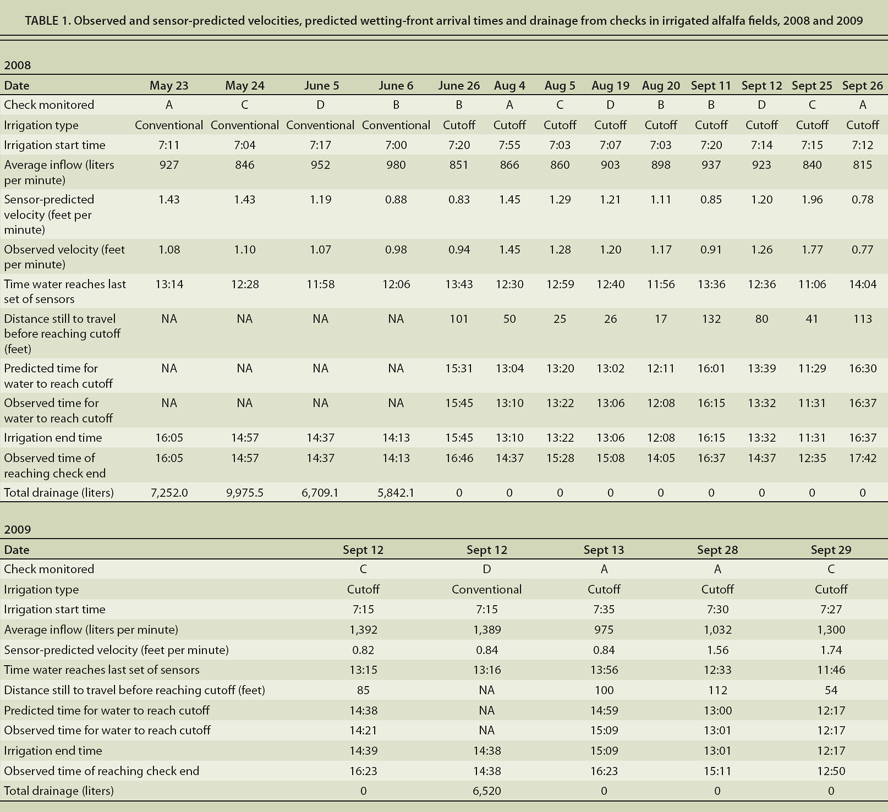
TABLE 1. Observed and sensor-predicted velocities, predicted wetting-front arrival times and drainage from checks in irrigated alfalfa fields, 2008 and 2009
Ready for installation
The model-based cutoff irrigation system developed in this study can minimize drainage water loss from surface-irrigated alfalfa fields and substantially improve water management. It was successfully demonstrated to dozens of farmers at the Alfalfa Field Day sponsored by UC Cooperative Extension on May 19, 2010, at the UC Davis Agronomy Field Headquarters. Our sensor and cellular communication–based cutoff irrigation system is still under development and is not currently being used in California alfalfa fields; it may be commercially available by early 2012.
The wetting-front sensors are inexpensive, about $25 per unit. The central module costs about $500 and the modem about $200, for a total of between $800 and $1,000. Moreover, the wireless system can easily be moved from one location to another, reducing the initial investment necessary to implement the system. With the typical five irrigations per alfalfa season, water savings could be about 35,000 to 60,000 liters per acre.
Although the experimental system described eliminates guesswork and minimizes tail water drainage, a simpler system, with one sensor per check, may be attractive to some growers as a starting point. This system would alert the irrigator when the wetting front arrives at the single sensor. However, the efficacy of the system in minimizing tail water runoff would entirely depend on the irrigator's judgment on placement of the sensor within the check.
Water sensors with cellular system eliminate tail water drainage in alfalfa irrigation

