


All Issues
Fecal pats help to predict nutrient intake by cattle during summer on California's annual rangelands
Publication Information
California Agriculture 64(2):101-105. https://doi.org/10.3733/ca.v064n02p101
Published April 01, 2010
PDF | Citation | Permissions
Abstract
Near-infrared spectroscopy (NIRS) of fecal samples has been used to predict the crude protein and digestible organic matter of forages consumed by grazing animals. However, for NIRS predictions to be accurate, the equation used must be based on samples from the target population. The Texas A&M Grazinglands Animal Nutrition Laboratory has developed a NIRS program based on forages in Texas, the Midwest and Canada's lower prairie provinces. California producers have been using these equations even though they had never been evaluated for California conditions. We conducted beef-cattle digestibility trials on two California rangeland summer forages to produce forage-fecal pairs for testing the existing NIRS ones and developing new equations as necessary. The predictions from the original equations were significantly different from the true values determined in the digestibility trials. The addition of data from this research has improved the predictive capability for both crude protein and digestible organic matter in California.
Full text
In comparison to much of the rest of the United States, California receives most of its rainfall in late fall and winter. Fall rains and warm temperatures initiate forage germination and growth, which slows as temperatures cool. Growth accelerates with warmer spring temperatures, but when the rainy season ends in late spring the annual grasses characterizing much of the state's rangelands mature and senesce (dry and die). Because this annual grassland system is different from most other rangelands in the United States, it is difficult to apply information from other areas to California.
In addition, due to the variability of rangeland systems, it is difficult to estimate what nutrients grazing animals are consuming and whether their diets are deficient. The dry season is of special interest to livestock producers and scientists because inherent in the drying process is an increase in fiber content. Because fiber is digested more slowly, it remains in the rumen longer; this increased rumen fill decreases forage intake and the energy available to the animal. Also, increased plant shatter and bleaching further concentrate fiber in the remaining forage and decrease the plant's nutrive value as it dries. Of particular concern for many cattle producers is the loss of crude protein (CP), which is important for growth, lactation and gestation in cattle (Church 1991). To maintain acceptable levels of production, producers often must supplement cattle diets with forages, grains and/or minerals in various forms. Even during times when the feed's energy content is sufficient, energy intake is generally limited by rumen fill due to high fiber levels (Conrad 1966; Ellis 1978).

For a study of nutrient intake by cattle, forage was harvested by hand to minimize shatter losses.
Cattle producers must determine when, how and how much to supplement to meet the changing nutrient demands of their cattle. Traditional methods of determining when to supplement include tracking cow weight or body condition score, hand-sampling available forage, visual appraisal of rangelands and, in some cases, routine supplementation in certain seasons or at specific stages of cattle production.
Although crude protein (a source of nitrogen) is important, it is also expensive. If producers do not provide enough nitrogen or provide it at the wrong time, animal production and profitability decrease. On the other hand, providing too much nitrogen (protein) is wasteful because excess nitrogen is excreted in the feces, where it may contribute to water and air pollution.
Predicting forage quality
The Grazinglands Animal Nutrition Laboratory (GAN Lab) at Texas A&M University in College Station developed equations for predicting the crude protein and digestible organic matter (DOM) of forages consumed by grazing animals using near-infrared spectroscopy (NIRS) to analyze fecal matter ( http://cnrit.tamu.edu/ganlab ). NIRS technology projects light in the near-infrared region onto a sample. As the light hits chemical bonds within the sample, the bonds bend and twist, reflecting a predictable and repeat-able pattern of light. The pattern becomes a fingerprint that can be used to determine the presence and amount of matching bonds in an unknown sample. However, in order for equations to provide accurate predictions, they must be built from known forage-fecal pairs from the same population as the samples to be predicted.
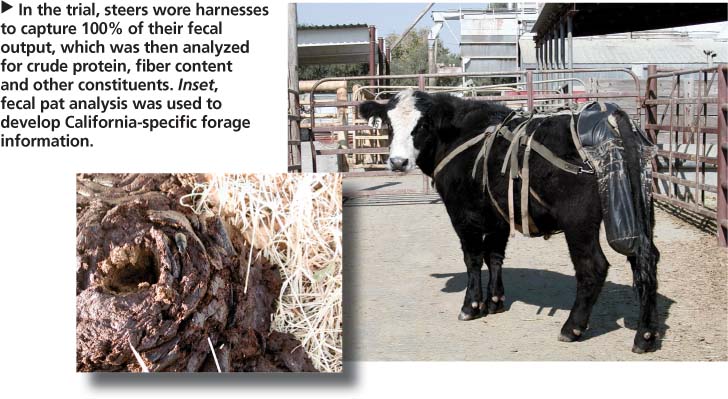
In the trial, steers wore harnesses to capture 100% of their fecal output, which was then analyzed for crude protein, fiber content and other constituents. Inset, fecal pat analysis was used to develop California-specific forage information.
NIRS has been gaining the attention of scientists in a variety of fields since the late 1970s. Although the technology can be used to predict the chemical composition of many different substrates, including forages, fecal spectroscopy is unique because it predicts the nutrient composition of forage that was actually consumed by grazing cattle (Leite and Stuth 1995; Lyons and Stuth 1992).
Two predictive equations were developed by the GAN Lab using data sets from rangelands in Texas, the Midwest and the southern portion of western Canadian prairie provinces. They are commonly called the “warm-season equation” and the “cool-season equation.” The cool-season equation is used for pastures that include introduced small-grain-type forages such as rye, wheat and brome grasses. This equation is best suited for intensively managed pastures such as monocultures. The inaccurately named warm-season equation is used for ranges where native forages are found, such as more extensive rangeland systems. Some cool-season grasses are also included in this group. The cool-season equation is rarely used to predict the nutrient composition of California forages and therefore was not analyzed in this study.
Cattle producers in California began using the GAN Lab equations in the late 1990s, despite the fact that they were not developed using forages from California's unique production system and had never been validated for use in California. California cattle producers using the GAN Lab system have reported mixed results in terms of perceived predictive accuracy based on cattle performance.

The purpose of this trial was to determine whether the Texas A&M fecal NIRS system accurately predicts forage nutrient composition for California's annual rangelands and, if necessary, to revise the regression equations to improve their ability to predict forage quality under California conditions.
Evaluating NIRS accuracy
Forage harvests.
In order to evaluate the existing equations, rangeland forage was harvested from two California sites beginning in June 2002 to provide forage for in vivo digestibility trials. The first site was the UC Sierra Foothill Research and Extension Center (SFREC), located about 15 miles east of Marysville and 60 miles northeast of Sacramento. Forage was harvested from mostly flat-to-rolling ground with an eastern exposure. The site, dominated by annual grasses, is typical of the land grazed by many cattle in California. It has a hot and dry climate due to being on the eastern side of the Sacramento Valley in the Sierra foothills. Average rainfall is 28 inches per year, with rain events generally in late fall through spring. The main species at SFREC in late May and early June 2003 were wild oat (Avena fatua), rose clover (Trifolium hirtum), medusahead (Elymus caput-medusae) and soft chess (Bromus hordea-ceus) (table 1).
The second site was on privately owned land 5 miles west of Petaluma, about 30 miles north of the Golden Gate Bridge. Forage was harvested from a relatively steep slope with a western aspect. The surrounding region is heavily influenced by coastal weather patterns, as it is approximately 15 miles from the Pacific Ocean and 15 miles from San Pablo Bay. Fog is common throughout the entire year. After forages stop growing, this moisture contributes to a decline in forage quality compared to farther inland. The area receives about 25 inches of rain per year, primarily in late fall to spring. The main species at this site in late May and early June 2003 were Italian ryegrass (Lolium multiflorum), ripgut brome (Bromus diandrus), foxtail (Hordeum leporinum) and wild oat (Avena fatua). Total production was 2,105 pounds dry matter per acre on April 14, 2003, at Petaluma, and 4,105 pounds dry matter per acre on May 30, 2003, at SFREC.
To minimize shatter loss, the forage at both sites was handled by hand from cutting through hauling. To minimize species variation among forage harvests, the total area to be harvested was divided, with a portion of each section included in each harvest. Harvest occurred at 6-week intervals at each site and continued at each site until one harvest following the first germinating rain, defined as 0.5 to 1 inch of rainfall within 1 week (George et al. 2001; George et al. 1985; Bentley and Talbot 1951). The first harvest at SFREC was on June 11, 2002, and the first rain event of 1.6 inches occurred on Nov. 7, with an additional 4.7 inches falling on Nov. 12. The last harvest at SFREC was on Nov. 26, 2002, 2 weeks following germination. The first harvest at Petaluma was on July 1, 2002, and the first week with rainfall total over 0.5 inches began Oct. 26. The last harvest at Petaluma was on Nov. 4, 2002. Significant “green-up” was observed by the time of final harvest. Five harvests at SFREC and four harvests at Petaluma were collected.
Cattle feeding.
The harvested range forage was chopped before feeding to increase voluntary intake by the cattle and to minimize sorting (choosing to eat only the most palatable particles). Chopped feed also mirrors samples clipped in the field, which were used to create the forage-fecal pairs. After the initial adjustment period, during which the steers lost weight, nearly all of the feed was consumed at each feeding. An average of five crossbred Angus steers were fed chopped forage every 8 hours to meet predicted maintenance energy requirements. Immediately prior to forage feeding, soybean meal was offered to bring total nitrogen in the diet to 3% of dry matter (DM). Water was freely available.
Steers were used because total fecal collection using fecal harnesses was necessary to determine the digestibility of the forage. The anatomy of female cattle results in urine contamination of the fecal matter, which would increase nitrogen levels measured in the feces above true levels. The steers were housed in individual pens at the UC Davis feedlot.
Fecal and forage analysis.
Steers were fed for a 14-day adjustment period, followed by a 5-day total fecal collection period using fecal harnesses. The steers were then switched to feed from the next collection site for 14 days to allow rumen microbe adjustment before another 5-day total fecal collection period. Fecal samples were composited, preserved in triplicate and frozen. One of the three samples was sent by 2-day mail to the Texas A&M GAN Lab for NIRS analysis, and the second sample was further dried and ground for nutrient analysis and sent to the Dairy One Forage Laboratory (Ithaca, N.Y.) where it was analyzed for crude protein, acid detergent fiber (ADF), neutral detergent fiber (NDF) and ash. Species information (cattle) was submitted with the samples. We froze the third sample in case a second test was required to verify a result.
Data analysis.
Forage and soybean samples, as well as significant feed refusals, if they occurred, were collected, weighed and composited in the same manner as the fecal samples, then dried, ground and analyzed for CP, ADF, NDF and ash by the Dairy One Forage Laboratory.
Forage CP was determined by standard laboratory nutrient analysis. DOM, which measures the amount of organic matter in the feed that is retained by the animal, was used instead of digestibility because digestibility is influenced by the mineral component of the feed, which varies. However, DOM can be related to digestibility using a correction for the ash content. Once calculated, digestibility can be related to total digestible nutrients and net energy using National Research Council equations. The following equation was used:

Warm-season data was analyzed using the Proc GLM (General Linear Models) statistical procedure in SAS (SAS Institute, Cary, N.C.) to determine the effect of equation (original vs. improved), time (date of harvest) and location (SFREC vs. Petaluma) on predictive capability. Interactions were also analyzed.
Improved equations for forage CP and DOM were constructed using forage-fecal pairs whose predicted constituents fell within 1.5 standard deviations of the expected value based on similar spectra from the same population of samples. The equations used forage-fecal pair data from the day composites obtained in the digestibility trial, because they match what occurs when a cattle producer takes a sample on one day from several fecal pats.
Predictive capability
As expected, forage digestibility declined as the summer progressed. Although less-variable low CP values were observed (table 2), all were less than the minimum requirement of about 7% for dry beef cows in the middle third of pregnancy (NRC 2000).
Crude protein.
The addition of dry season forage-fecal pairs to the existing GAN Lab equation improved the predictive capability for CP (table 3). All single factors were highly significant, and location-by-equation and location-by-time interactions were observed (P < 0.01). Because there was a location-by-equation interaction, data was analyzed by location.
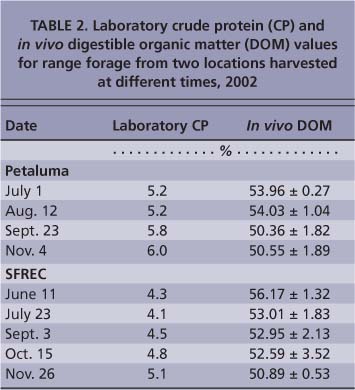
TABLE 2. Laboratory crude protein (CP) and in vivo digestible organic matter (DOM) values for range forage from two locations harvested at different times, 2002
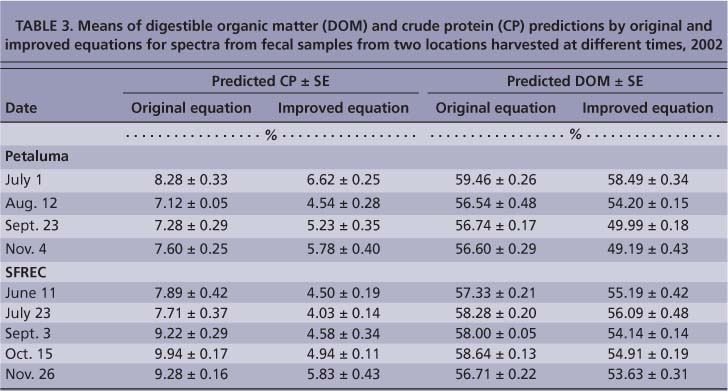
TABLE 3. Means of digestible organic matter (DOM) and crude protein (CP) predictions by original and improved equations for spectra from fecal samples from two locations harvested at different times, 2002
Data from the Petaluma site (fig. 1A) showed that both time and equation used were significant (P < 0.01). Analysis of the least-square means (prediction-laboratory value) demonstrated that predictive capability for CP was improved by more than 2% from the original equation (P < 0.01) (table 4).
At the SFREC site (fig. 1B), equation, time and an equation-by-time interaction were important sources of variation, but equation had the most significant effect on predictive capability. The ability to predict forage CP from SFREC fecal samples improved by more than 4% with the new equation (table 4).
There was also a strong location-by-equation interaction (P < 0.0001). Both the original equation and the improved equation predicted CP for Petaluma samples better than for SFREC samples. Under the new equation, predictive ability for the Petaluma samples was numerically more accurate (0.21%) than for SFREC samples. On average, CP was overpredicted. The ability of the equations to better predict Petaluma samples may be due to the higher percentage of perennials at the Petaluma site. Another explanation is that there was greater species variability at the SFREC site, indicating that the system may not have been exposed to all of the different species or that a single laboratory value may not be sufficient to reflect variation at the SFREC site (table 1).

Additional digestibility trials on a wider variety of California rangelands will help to identify nutritional variations in different vegetative communities throughout the state.
Digestible organic matter.
Predictions of DOM were more accurate using the new equation than with the original equation. In the statistical model including all data, only equation was highly significant (P < 0.0001). Similar to the original equation, the new equation predicted Petaluma samples (fig. 2A) more accurately than SFREC samples (fig. 2B) by more than 0.92%. The ability of the GAN Lab NIRS equation to better predict Petaluma samples may be a plant-species effect, meaning that the plants found at the Petaluma site are more similar to those fed to create forage-fecal pairs in other trials whose data was also used to construct the equation. In addition, the Petaluma site had slightly more perennials and biennials than the SFREC site.
DOM was consistently overpredicted with both the original and improved equations. The improved equation overpredicted DOM of samples from Petaluma by nearly 0.74%, and samples from the SFREC site by more than 1.67%. The consistent overprediction of DOM indicates a systematic error, either in the GAN Lab NIRS system or in the digestibility trial. However, because this overprediction was seen in the original equation as well as for CP, it is likely that the error lies within the GAN Lab system.
When DOM and CP are compared, the new equation is more accurate for DOM than CP. This difference in predictive accuracy is likely due to greater variation in measures of DOM due to animal and daily variation.
Implications for California
The addition of California rangeland forage-fecal pairs made a significant improvement to the existing GAN Lab NIRS system. Further improvements are necessary and could be made with additional digestibility trials on a wider variety of California rangelands. To increase the usefulness of the system, these trials should include forages from the entire year, rather than only the dry season, and should include a number of additional sites to represent the variation in vegetative communities that occurs throughout the state.
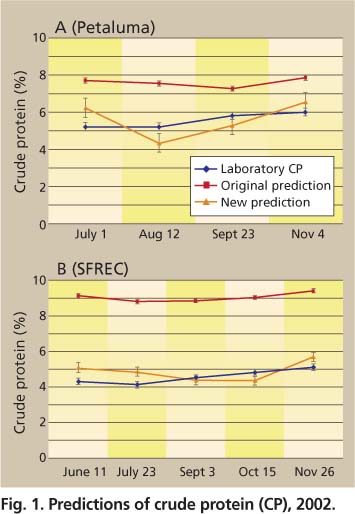

TABLE 4. least square means of prediction bias for digestible organic matter (DOM) and crude protein (CP) by original and improved equations for spectra from fecal samples from two locations harvested at different dates, 2002
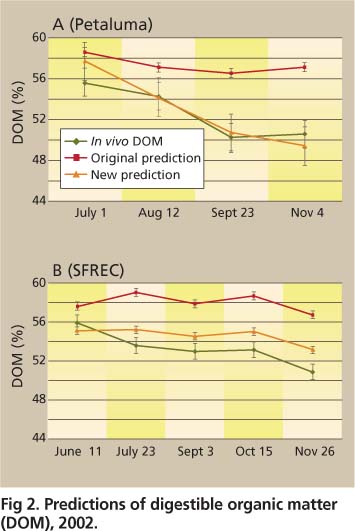
Predictive capability was different between the sites. In general, the original equation overpredicted the CP content of the rangeland forages. At the coastal site near Petaluma, the difference between the true CP content and predicted content was 2.02% and –0.01% for the original and new equations, respectively. In comparison to laboratory values, the original and improved equation overpredicted CP at the SFREC site by 4.25% and 0.22%, respectively. At the Petaluma site, the original equation overpredicted DOM by 5.14% while the new equation overpredicted the true value by 0.74%. Differences between true DOM and predicted DOM were 4.67% and 1.67% for the original and new equations at SFREC. This study showed that the addition of forage-fecal pair data produced on California rangelands improves the capability of the GAN Lab system to predict California samples. These data must be added for the system to more accurately predict California samples.
These data were added at the Texas A&M GAN Lab to improve California and annual range predictions. In addition, results from this study were presented to UC Cooperative Extension advisors throughout the state to improve their ability to use and interpret results more accurately. This study did not investigate the accuracy of the GAN Lab predictions on irrigated pastures, and did not create forage-fecal pairs to improve the equation during the green season. The accuracy of the system on irrigated pasture or during the green season on California's annual rangeland is unknown. However, these data were also used in a UC Cooperative Extension irrigated pasture study in Northern California that is expected to be published in 2010 (Larry Forero, personal communication).
Fecal pats help to predict nutrient intake by cattle during summer on California's annual rangelands

