


All Issues
Wine-grape production trends reflect evolving consumer demand over 30 years
Publication Information
California Agriculture 64(1):42-46. https://doi.org/10.3733/ca.v064n01p42
Published January 01, 2010
PDF | Citation | Permissions
Abstract
The California wine industry has been in the midst of a prolonged boom for more than 30 years. In 1975, California was home to approximately 330 wineries; by 2006 there were nearly 2,500. There has been a dramatic shift in demand toward higher priced and higher quality table wines, as reflected in the total revenues and crush shares of the state's four major growing regions. We examine the major trends in the California wine-grape industry over the last 30 years, specifically differences that are arising between the coastal and inland growing regions and migration of the various wine-grape varieties grown throughout the state.
Full text
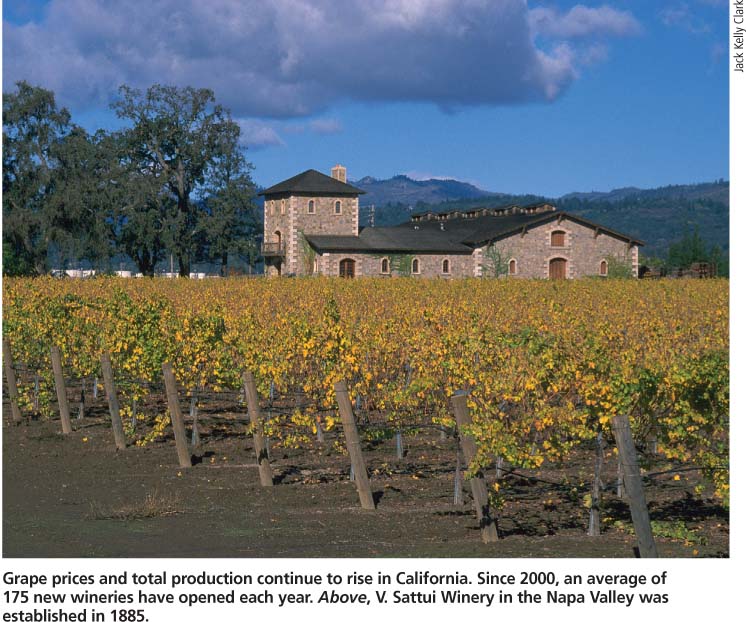
Grape prices and total production continue to rise in California. Since 2000, an average of 175 new wineries have opened each year. Above, V. Sattui Winery in the Napa Valley was established in 1885.
The California wine industry has been in the midst of a prolonged boom for more than 30 years, with production expanding as the state's global reputation for producing high-quality wines steadily increased. In 1975, California was home to approximately 330 wineries; by 2006 there were nearly 2,500 (Wine Institute 2007). This trend was kick-started in large part by California's surprise victory over France in the Paris wine tasting of 1976, an international blind taste test immortalized in the movie Bottle Shock. There is no shortage of research on the trends and dynamics of the California wine industry, yet virtually none has been directed toward the California wine-grape industry.
As of 2004, California accounted for 92% of U.S. wine-grape production and nearly 90% of all domestic wine production (Wine Institute 2007). Moreover, wine grapes accounted for nearly 10% of California's total agricultural receipts in 2006, second only to fluid milk (CDFA 2007). The California wine-grape industry is of great economic importance to the state, nation and world. In this study we quantify the major trends that have shaped the industry over 30 years.
The California Department of Food and Agriculture (CDFA) divides the state into 17 wine-grape-growing districts, which are in turn aggregations of American Viticulture Areas (AVAs) for California. (The boundaries of AVAs are determined by the federal Alcohol and Tobacco Tax and Trade Bureau.) For the purposes of our analysis, we aggregate the major growing districts — with the exception of the Sierra foothills — into four growing regions (fig. 1). These are:
In order to keep our analysis empirically manageable, we limited the focus to eight major wine-grape varieties. These include Cabernet Sauvignon, Merlot, Zinfandel and Pinot Noir as representative red grapes; and Chardonnay, Sauvignon Blanc, French Colombard and Chenin Blanc as representative white grapes. As of 2006, total production of these eight grapes was 2.2 million tons, or 71% of California's total wine-grape output. The average real price received per ton of crush for these varieties across the regions was $811. The comparable price received in 1976 was $642, but this 26% increase does not reflect a trend seen uniformly throughout the state. Over the 30 years, prices received grew by an average of 46% in the North Coast region, while prices actually fell slightly throughout much of the rest of the state.
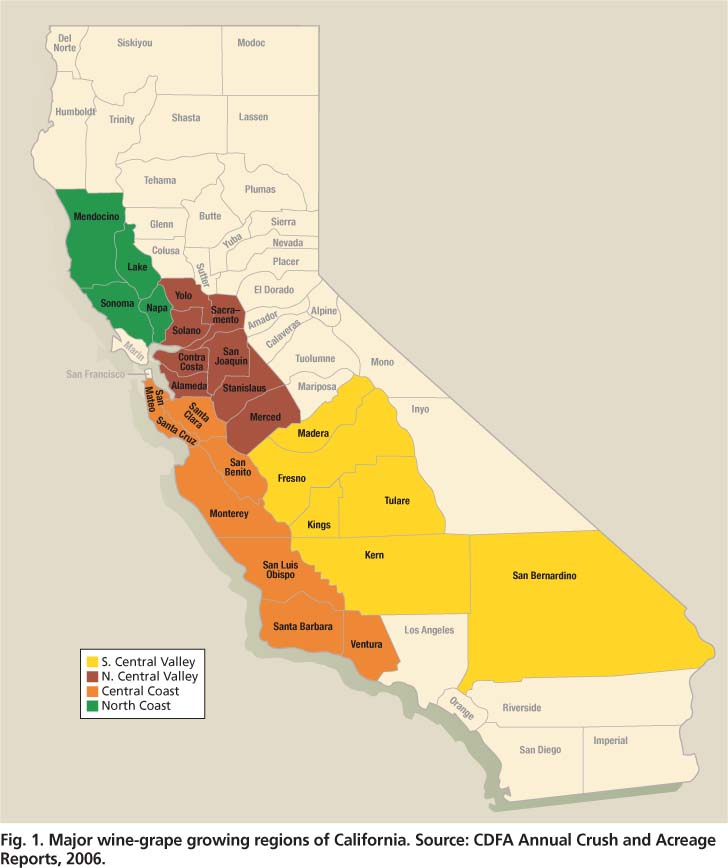
Fig. 1. Major wine-grape growing regions of California. Source: CDFA Annual Crush and Acreage Reports, 2006.
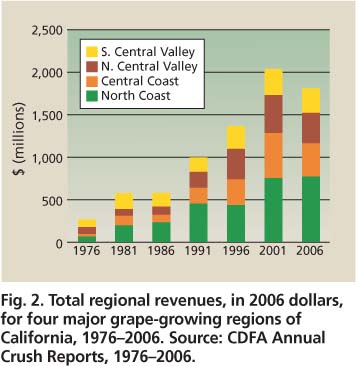
Fig. 2. Total regional revenues, in 2006 dollars, for four major grape-growing regions of California, 1976-2006. Source: CDFA Annual Crush Reports, 1976-2006.
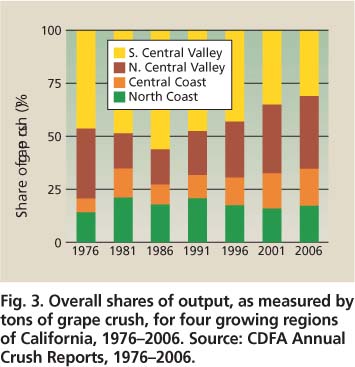
Fig. 3. Overall shares of output, as measured by tons of grape crush, for four growing regions of California, 1976-2006. Source: CDFA Annual Crush Reports, 1976-2006.
Of particular interest in this study are the changing production and price patterns across growing regions as well as the changing roles played by various wine-grape varieties. The identities of each of the four growing regions continue to take shape as do their particular roles within California's wine economy, while the production patterns and locations of the various varieties reflect constantly evolving consumer demand.
Lower coastal yield, higher prices
Domestically, there has been a dramatic shift in demand over the past 30 years toward higher priced and higher quality table wines. Premium wines, those priced between $7 and $14 per bottle, have seen their national revenue share increase 14% since 1995, while ultra-premium wines, priced at over $14 per bottle, have increased their share by 21% (Goodhue et al. 2008). Demand remains strong, however, for cheaper jug wines, which are typically sold in containers larger than bottles but sell for the equivalent of $3 or less per bottle throughout much of the United States and globally. Hence the wine-grape industry has become bisected. The coastal regions have become associated with high-quality wines, generally with limited distribution and an emphasis on wine tourism. The inland regions have become associated with lower quality wines, typically produced using grapes grown under long-term contracts and sold in jugs or boxes at low prices with large-scale distribution. The inland regions are home to the majority of production by wine industry giants such as Gallo, Sutter Home and Woodbridge by Mondavi.
“Brick-and-mortar” wineries are open to the public for wine tasting and on-site purchases. As of 2005, the inland regions produced nearly twice as much total crush as the coastal regions, yet were home to approximately one-ninth as many brick-and-mortar wineries (California Wine Online 2005). Napa and Sonoma counties hosted 404 such wineries in 2005, compared to only 42 in the entire north Central Valley. This disparity highlights regional differences in varietal emphasis.
Revenues and crush shares. The total revenues and crush shares of the four major growing regions also reflect this growing dichotomy in the California wine-grape industry (figs. 2 and 3). As of 2006, the North Coast generated by far the most revenue of the four regions, with $779 million in receipts, despite accounting for only 19% of the state's total output. The Central Coast region ranked a distant second overall in revenues, but grew the fewest grapes. Meanwhile, the vast southern portion of the Central Valley generated about one-third of the North Coast revenues, despite accounting for 30% of the state's total output.

Fig. 4. Average yields for the wine-grape growing regions of California, 1976-2006. Source: CDFA Annual Crush and Acreage Reports, 1976-2006.
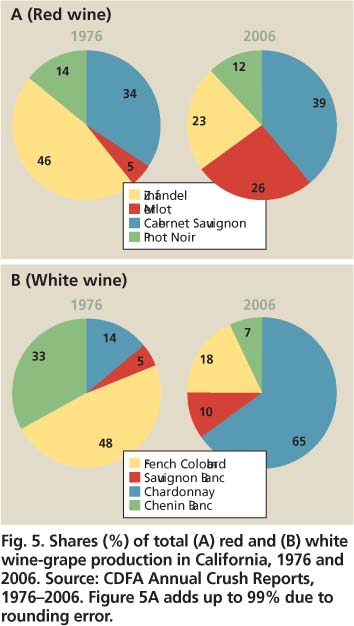
Fig. 5. Shares (%) of total (A) red and (B) white wine-grape production in California, 1976 and 2006. Source: CDFA Annual Crush Reports, 1976-2006. Figure 5A adds up to 99% due to rounding error.
In 1976 the picture was quite different, as the south Central Valley was dominant in terms of both crush and revenues. The Central Coast had the lowest overall share of revenues by a wide margin, as its AVAs had yet to rise to prominence, and the region was responsible for less than 7% of statewide output. The north Central Valley is the only region that showed a significant and sustained rise in output share, which increased steadily from the mid-1980s onward. This increase was driven by a rapid expansion in the production of Merlot, Cabernet Sauvignon and Chardonnay.
Yields. Another key factor differentiating the four growing regions is yield per acre (fig. 4). Low yields are typically associated with higher quality grapes and, by extension, higher quality wines. Lower yields imply that fewer grapes are being processed from each acre, and that only grapes meeting a certain quality threshold are being used. Moreover, lower yields frequently indicate that grape vines are grown spaced apart such that the grapes receive optimal amounts of water and sunlight (Bettiga et al. 2003).
Barring exceptional years over the 30-year time span, the North Coast has had the lowest average yields, while the south Central Valley has had the highest. In 2005, the latest year not seriously affected by droughts or frosts, the average south Central Valley acre produced nearly 12 tons of grapes, compared to approximately 11 tons in the north Central Valley region, 7 tons in the Central Coast and only 4 tons in the North Coast. This disparity not only illustrates fundamental production differences, but also helps to explain how the North Coast produced 19% of California's total grape crush in 2006 on one-third of its total grape-bearing acreage.
The magnitude of the yield disparity between coastal and inland growing regions varies widely among grape varieties. For example, in 2006 the North Coast produced an average of 3.75 tons of Chardonnay per acre, while the north Central Valley produced 9.25 tons of Chardonnay per acre. In the case of Merlot, however, the North Coast average yield was 3.57 tons per acre in 2006 compared to 6.80 tons per acre in the north Central Valley. Just as the North Coast is outdistancing the rest of the state in terms of revenues, there appears to be a growing divergence between even the North Coast and Central Coast in terms of yields over the last 10 years.
The north Central Valley managed to increase its share of total wine-grape production not only by expanding acreage throughout the San Joaquin and Sacramento valleys, but also by significantly increasing yields, mainly by decreasing the average spacing among planted vines. Average yields in the north Central Valley steadily increased from about 4 tons per acre in 1985 to 9 tons per acre in 2006, with occasional peaks and valleys resulting from weather conditions (fig. 4). During that time, average yields in the north Central Valley region more than doubled over 20 years, while those in the Central Coast increased by 33%, the south Central Valley increased by 30% and the North Coast remained statistically the same.
Migration of wine-grape varieties
Total bearing acreage for the eight grape varieties that we studied grew from just over 100,000 acres in 1976 to 337,000 acres in 2006. Throughout this growth spurt, the allocation of these varieties changed greatly. Their distribution reflects the evolution of domestic wine demand.
Merlot and Zinfandel. Overall, the aggregated picture for red grapes has remained fairly constant (fig. 5A). Merlot's total share increased from 5% to 26%, mostly by taking up the slack from relatively stagnant Zinfandel. Zinfandel grapes grow well in warmer climates and on closely spaced vines, making them well suited for production in the inland areas (Bettiga et al. 2003). As a result, production of Zinfandel grapes has remained steady in the North Coast and Central Coast regions for the last 30 years, while it expanded only in the in-land areas. In parts of the north Central Valley, particularly in the Lodi AVA, growers are placing an emphasis on high-quality “old vine” Zinfandels that are processed into table wines. In other inland AVAs, the growth in Zinfandel production has been fueled by an increase in demand for white Zinfandel wine, which is typically sold as a low-priced jug wine. The general pattern of decreasing real prices for Zinfandel grapes over time suggests that the latter trend is overpowering the former.
Merlot, another red grape that thrives in warm climates, has seen significant growth in all four growing regions, with the greatest expansion in the north Central Valley. In 1976, the north Central Valley accounted for only 16% of California's total Merlot production, but by 2006 the region's share had grown to 40%.
Cabernet Sauvignon and Pinot Noir. Cabernet Sauvignon and Pinot Noir are grown almost exclusively to produce high-quality and high-priced table wines, and they are rarely blended. Both grapes, but especially Pinot Noir, flourish in the cooler coastal areas and diminish in quality when grown in hotter, drier areas. Nevertheless, these grapes are increasingly grown in the north Central Valley region as several AVAs such as Lodi and Clarksburg are working to assert themselves as high-quality growing regions. The Pinot Noir grape was not grown in sufficient quantities to be measured by CDFA surveys of the north Central Valley in 1976, but by 2006, output was nearly 20,000 tons. (The Academy-Award winning 2004 movie Sideways appears to have given Pinot Noir sales a boost.) This is approximately one-third of the Pinot Noir production of the Napa and Sonoma valleys, where it now yields the highest average grower returns in California for wine grapes.
Chardonnay. The white-wine-grape industry has been far more dynamic than the red-wine-grape industry (fig. 5B). Since the late 1980s, Chardonnay production has grown while the other three white varieties have fallen at varying rates. The total share of Chardonnay grape production among white grapes grew from 14% in 1976 to 65% in 2006. This reflects an increase in total Chardonnay production from 7,300 tons to over 530,000 tons in 30 years. Both supply and demand factors account for the rapid and sustained expansion of the Chardonnay crop, which occurred while the overall share of white-grape production in California fell from a peak of 73% in 1987 to 42% in 2006.
On the supply side, Chardonnay is among the most versatile grapes grown in the New World. It can grow in a wide range of soil and climatic conditions, its vine spacing can be varied significantly, and it lends itself to both hand and machine harvesting. On the market side, consumer demand has grown steadily for Chardonnay table wine, since it pairs well with food but can also be consumed on its own. At the same time, demand remains strong for cheaper Chardonnay jug wines, and Chardonnay grapes are commonly used to make sparkling wines.
Over time, Chardonnay production in California has become more evenly distributed across the four major growing regions. In 1976, more than half of California's total Chardonnay production took place in the North Coast region, but by 2006 that share was reduced to less than a quarter due to huge production growth in the north Central Valley and, to a lesser extent, the south Central Valley.
French Colombard and Chenin Blanc. The distribution of French Colombard and Chenin Blanc production, however, is increasingly concentrated in the south Central Valley region. Both grapes are used primarily as blends in cheap jug wines, so grower returns for these grapes have fallen sharply relative to most other varieties in California. Today they are grown in trivial amounts in the coastal regions and in modest amounts in the north Central Valley, while the south Central Valley accounts for 97% of total French Colombard production and 76% of total Chenin Blanc.
Sauvignon Blanc. Sauvignon Blanc, also known as Fume Blanc in California, has seen the least overall migration of the eight grape varieties examined. It is a very adaptable grape in that it can be grown vigorously in a variety of soil types and in both warm and cool microclimates, but the vines must be spaced a minimum of 6 feet apart. During the last 30 years, Sauvignon Blanc production has lagged in the Central Coast compared with the other three regions, because the Central Coast has come to focus almost entirely on the production of Chardonnay white grapes. In the North Coast, the Sauvignon Blanc grape is typically processed into a dry table-wine varietal, while inland it is blended to make sweeter jug wines or harvested late to produce very sweet varietals.

Over the past 30 years, the demand for, left, wine grapes has continually increased, but the distribution of grape varieties grown has shifted dramatically. Right, acreage of Pinot Noir grapes was virtually nil in 1976; by 2006, about 20,000 tons were harvested.
In memory of Dale Heien

Professor Dale Heien joined the UC Davis Department of Agricultural and Resource Economics in 1982 and retired in 2003. His research interests were primarily in the areas of demand systems, pricing and markets, and in recent years the supply and demand of wine grapes and wine. He was a deep thinker, and colleagues frequently sought his advice. He co-authored a seminal article with Murray Brown, “The S-Branch Utility Tree: A Generalization of the Linear Expenditure System,” in Econometrica in 1972, and published in journals that included Journal of the American Statistical Association, Review of Economics and Statistics, Journal of Business and Economic Statistics, and American Journal of Agricultural Economics. Heien was an avid Chicago Cubs fan and loved his family. He passed away on June 19, 2009.
Looking to the future
Statewide, grape prices and total production appear poised to continue their ascent. On average, 175 new wineries have opened in California annually since 2000 (Wine Institute 2007). The trend of decreasing prices in regions such as the north Central Valley is not indicative of decreasing demand but rather of the constantly changing distribution of the major grape varieties. As long as Chardonnay retains its popularity among consumers, it will likely represent an ever larger percentage of the state's total white-wine-grape production, while ballooning prices for Pinot Noir grapes suggest that their production will expand significantly within the coastal regions.
The hierarchy of the four major growing regions in terms of perceived quality and prices received has remained unchanged for 30 years, with the North Coast on top, followed by the Central Coast, the north Central Valley and finally, the south Central Valley. However, the prices received for wine grapes in the North Coast region continue to outpace those in the rest of the state. In 1976, the average prices for grapes in the North Coast were 13% higher than those of the Central Coast, 2.25 times higher than the north Central Valley, and almost three times higher than the south Central Valley. In 2006, North Coast prices were 72% higher than Central Coast prices and about four times the average prices received inland.
While certain AVAs of the north Central Valley are establishing themselves as producers of high-quality table wines such as Zinfandel and Chardonnay, in aggregate the north Central Valley is not distinguishing itself from the south Central Valley in terms of wine quality or price. In fact, average prices received for grapes in the north Central Valley have fallen in real terms over the last 30 years as production has boomed, and today average grape prices of the north and south Central Valley are approximately equal. The high-quality AVAs of the Central Coast region, such as Paso Robles and the Santa Ynez Valley, are growing in size and prominence, but at present they remain small relative to the Napa and Sonoma valleys to the north.
Over time the Central Coast region may approach the North Coast in terms of total production and grape prices, particularly because appellation expansion in the North Coast is far more constrained than in the Central Coast. However, the evolving distribution of California's grape varieties, as well as trends in yields per acre, suggest that the disparity in perceived quality and prices between inland and coastal growing regions will continue to widen. The grapes commonly used to produce cheap jug wines, such as new-vine Zinfandel, French Colombard and Chenin Blanc, continue to concentrate in the AVAs of the north Central Valley, while higher priced varieties such as Pinot Noir and Merlot remain concentrated on the coast. The long-term trends of increasing yields per acre in the inland regions compared with stagnant or even decreasing yields per acre in the coastal regions suggest that this segmentation will continue unabated for a long time to come.
Wine-grape production trends reflect evolving consumer demand over 30 years

