


All Issues
Survey explores teen driving behavior in Central Valley, Los Angeles high schools
Publication Information
California Agriculture 63(4):208-214. https://doi.org/10.3733/ca.v063n04p208
Published October 01, 2009
PDF | Citation | Permissions
Abstract
Teenage drivers, particularly new drivers, have higher crash rates than adults. We surveyed 2,144 teenage drivers in California about their driving practices, factors influencing driving behavior, and views on driver education and resources. Teens wanted updated driver education courses and more behind-the-wheel training while learning to drive. They identified parents as their most important resource when learning to drive and also reported that parents were less likely to enforce the rule prohibiting driving with teen passengers than other driving rules. Teens described behavior by teen passengers that distracted them while driving. The findings indicate that new drivers benefit greatly from graduated driver licensing laws.
Full text
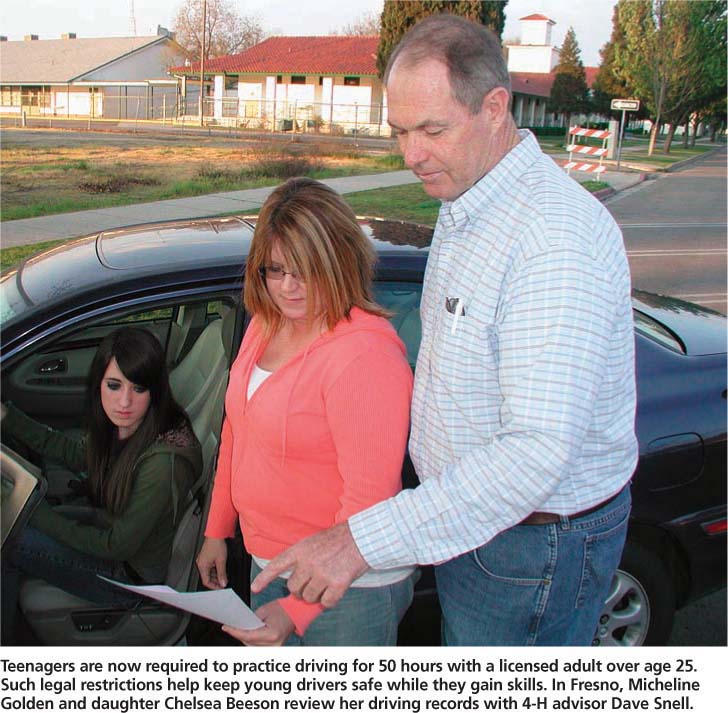
Teenagers are now required to practice driving for 50 hours with a licensed adult over age 25. Such legal restrictions help keep young drivers safe while they gain skills. In Fresno, Micheline Golden and daughter Chelsea Beeson review her driving records with 4-H advisor Dave Snell.
The rate of automobile accidents involving teenage drivers nationwide is of great concern to public safety officials, families and educators. Teenagers have a higher rate of car crashes, including injuries and deaths, than do adults. Crash rates among 16-year-olds are more than double that of 18- and 19-year-old drivers and 10 times the rate of those ages 30 to 59 (Baker et al. 2006). In 2006, California drivers ages 15 to 19 were involved in 526 fatal collisions and 33,174 collisions that resulted in injury. The motor vehicle death rate in California for all drivers is 12.7 per 100,000, compared to an average of 15 per 100,000 for the United States (SWITRS 2006). Northern counties and those in the middle to lower Central Valley have the highest crash rates in California (CDC 2006).
Driving laws for teenagers
Factors contributing to higher crash rates for teenagers, particularly 16-year-olds, include inadequate skills and lack of experience, risk-taking behaviors, distractions and poor judgment (AAP 2006; Williams 2003; Arnett 2002). Increased concern about teen driving behaviors has led many states to implement graduated driver licensing laws, which have shown encouraging results in lowering the number of teen injuries and deaths due to car accidents (McKnight and Peck 2002).
California's first modified licensing program for new drivers under age 18 was implemented in 1983. In July 1998, California became the first state to implement a graduated driver licensing law that included passenger restrictions for teen drivers. Other enhancements to the 1983 program included a 1-year driving curfew between 12 a.m. and 5 a.m. (expanded to 11 p.m. in 2007); an increase in the mandatory provisional period from 1 to 6 months (since expanded to 1 year); and a requirement for parent certification of 50 hours of supervised practice, including 10 hours at night.
Masten and Hagge (2003) evaluated California's enhanced 1998 program by examining monthly crash rates from January 1994, well before implementation of the graduated licensing law, through December 2001. Parameters for the time-series analysis included whether the impact on teen crash rates was a gradual one that became permanent, a sudden one that was temporary, or a sudden change that became permanent. Their results indicated no overall reduction in total crashes or fatal/injury crashes immediately following program implementation or beginning 6 months later, but the program was associated with a 19.45% gradual-permanent increase in total crashes for 18- and 19-year-olds 6 months after the program was implemented. This increase suggests that the program's positive effects may not continue into later years or may be due to a higher percentage of teens waiting until age 18 to be licensed as a way to avoid the program.
Furthermore, the nighttime restriction was associated with a sudden-permanent small reduction in total crashes (0.44%) and fatal/injury crashes (0.45%) for 15-to-17-year-olds, starting 1 year after program implementation. The 6-month passenger restriction was associated with approximately 73 fewer crashes per month (or 878 fewer per year) for 15-to-17-year-olds, representing a 2.52% decrease in total crashes (whether or not they involved passengers) (Masten and Hagge 2003).
Influences on teen driving behavior
Our goal was to explore the factors influencing teen driving behavior by asking teens about their perceptions of driver education and training, and about their driving practices. In particular, we focused on youth in rural Central Valley areas, who tend to have higher crash rates (CDC 2006). A second goal was to identify determinants of high-risk driving among California high-school students and learn about influences on teen driving behaviors. This research project was co-led by UC Cooperative Extension 4-H youth development advisors and the 4-H Center for Youth Development at UC Davis.
Survey.
We surveyed high-school seniors because they are most likely to have accrued some driving experience. To develop the questionnaire, focus groups were conducted with 48 high-school students and their parents. From the resulting information and a literature review, we developed a four-page survey with both multiple choice and open-ended questions. The survey focused on various issues relevant to driving including training and education, most-helpful learning resources, parental expectations and reasons for driving. Students were asked about driving with friends, as either drivers or passengers; if they participated in risky behaviors while driving; and, if their friends exhibited risky behavior while in the car with them or as drivers, whether they spoke up. Students were also asked about their involvement in automobile accidents and the circumstances. (The full survey is available from the authors.)
The survey, in either English or Spanish (most students chose to take it in English), was approved by the UC Davis Human Subjects Internal Review Board. Prior to survey administration, parents received letters (in English, Spanish, Russian and Hmong, depending on the school population) allowing them to opt their children out of participating. Letters were sent to more than 3,000 parents, and 12 requested that their children not participate.
Chi-square analysis was used for calculations. Additionally, since students were sampled within their schools, SUDAAN (Research Triangle Institute 2001) was used for analysis to adjust for the nested-cluster sample design. Results for all comparisons are statistically significant when P < 0.05.
Schools.
During the 2005–2006 and 2006–2007 school years, we surveyed high schools in seven California counties, most in the Central Valley (Fresno, Kern, Madera, Sacramento, Tulare and Yolo) as well as urban Los Angeles County. Twelve comprehensive public high schools and one parochial high school participated. The student populations ranged from a few hundred per school to more than 2,000, and were ethnically diverse. Of the students who completed the survey, 19% attended rural schools in towns or areas with fewer than 10,000 people, 49% were in suburbs or towns with populations between 10,000 and 75,000 and 32% were in urban areas with populations of 75,000 or more.
Schools were classified by income level based on California Department of Education data on the proportion of students who received free or reduced-price meals; students in three schools were higher-income (fewer than 20%), six schools were moderate income (between 20% and 49%) and four schools were lower-income (50% or more).
Student sample
Demographics.
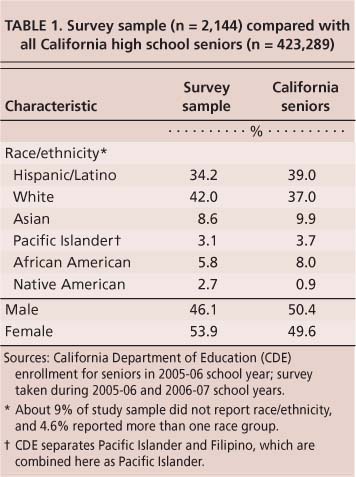
The survey was administered on a single school day in each school, in an English class that all seniors were required to take. A total of 2,144 enrolled seniors (68%) completed the survey. The respondents were 46% male and 54% female. The majority (76%) were 17 years old, 17% were 18, and 5% were 16. Students in the sample were 41.9% white/non-Hispanic; 34.2% Latino/Hispanic, 11.7% Asian/Pacific Islander, 5.8% African American and 2.7% Native American (table 1).
Licensure and driving habits.
Of the respondents, 54% had licenses, 11% had permits and 34% had neither. Among those without licenses or permits, 22% did not drive and 12% drove anyway. These numbers are similar to data in the 2007 Motor Vehicle Occupant Safety Survey, a national telephone survey of more than 6,000 people aged 16 and older, in which 45% of 16-and-17-year-olds reported driving nearly every day, 18% drove a few days a week and 31% were nondrivers (Block and Walker 2008). In our study, while students reported a wide range of hours driving, the average was 5 hours per week. Of those who drove, 820 (39.7%) had driven for 12 months or more, 404 (19.6%) had driven between 6 and 11 months, and 316 (15.3%) had driven for less than 6 months.
Nondrivers.
Students who did not have a license or permit were asked to identify reasons why they did not drive. About 14% said no car was available, and 13.5% said that the cost of driving or becoming licensed was too high. About 10% said they were not allowed by either parents or the state to receive a license; some of these students (0.9%) indicated they were undocumented and not eligible. Students had the option of listing other reasons; these included not wanting to drive (10.7%), waiting until they turn 18 when they would no longer be subject to graduated driver licensing laws (8.6%), and feeling that driving is too much trouble (5.4%) or that the driving laws for teenagers are too restrictive (4.6%).
Unlicensed drivers.
Approximately 12% of respondents (n = 265) reported not having a license or a permit but responded positively to questions regarding driving, indicating that they drove regularly. The unlicensed drivers were primarily male (56%) and Latino (67%) (fig. 1). The association between race/ ethnicity and driving with or without a license was significant (P < 0.008). Latino and African-American youth were more likely to drive without either a license or permit than white, Asian or Native-American youth.
Most unlicensed drivers attended a school with a lower-income population, and most lived in urban areas. Economic factors were cited by 12% of unlicensed drivers and 14% of nondrivers for why they did not have a license. The costs of licensure and insurance for a teen driver are prohibitive for some families. Unlicensed drivers reported several reasons, including having no car to use regularly, not being allowed by parents or the state (or being an undocumented immigrant), waiting until they turn 18, and logistical reasons such as no time to obtain one.
Unlicensed drivers drove approximately the same number of hours per week as licensed drivers, but the two groups differed significantly in several respects. Unlicensed drivers had been driving for less time, and as their main reasons for driving they were less likely to report getting to school (P < 0.0001); going to clubs, sports practices and other activities; and going out with friends. They were also slightly more likely to report running errands and helping with family responsibilities as reasons for driving.

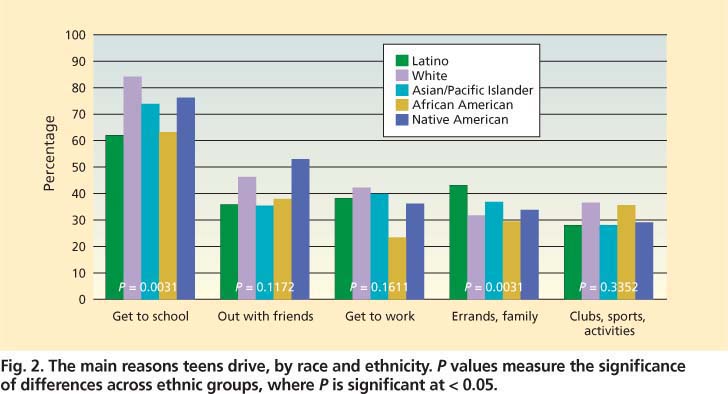
Fig. 2. The main reasons teens drive, by race and ethnicity. P values measure the significance of differences across ethnic groups, where P is significant at < 0.05.
Considering their licensure status, it is not surprising that unlicensed drivers were statistically more likely than licensed drivers to report always following the rules of the road (P < 0.0001). They were less likely to drive after 11 p.m. and with friends in the car (P < 0.0001), and were more likely to report having been a passenger in a car with a driver who drank alcohol (P < 0.0001). Licensed and unlicensed drivers were equally likely to report driving after alcohol and drug use.
Reasons for driving.
Students stated that their primary reason for driving was to get to school (72%). This was true for all students, regardless of school location, gender, ethnicity and whether or not they were licensed. About 39% reported getting to work as a main reason for driving, and 37% said they ran errands or helped with family responsibilities.
The reasons for driving varied significantly across race/ethnic groups (P < 0.003), with Latino students more likely than others to report running errands or helping with family responsibilities (fig. 2). For all drivers, going out with friends (40%), or getting to work, helping with family errands or responsibilities, and going to clubs, sports practices or other activities (32%) were the other principal reasons for driving.
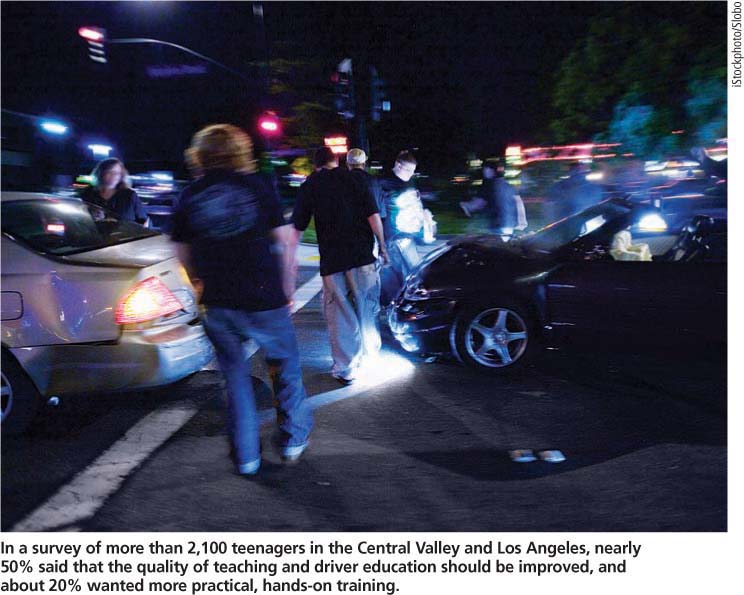
In a survey of more than 2,100 teenagers in the Central Valley and Los Angeles, nearly 50% said that the quality of teaching and driver education should be improved, and about 20% wanted more practical, hands-on training.
Cars.
Just under half of the students who drove had their own cars, while 40% shared with parents and about 20% shared with siblings or other family members. These numbers are similar to Williams et al. (2006), in which 41% of teenage drivers indicated that they owned a vehicle. In that study, parents were generally agreeable to letting teens have their own cars from the start, after being licensed.
Influences on teen driving
Parents.
Our results indicated that parents are a strong influence on young people's driving. When asked about the most helpful resource they had available when learning to drive, almost half (47%) of the students cited their parents, significantly greater than driver training (25%), driver education classes (11%), other relatives (5%) and friends (4%). Youth who indicated their parents as the most helpful resource when learning to drive were significantly less likely to drive after drinking.
The majority of youth indicated that their parents set rules and/or responsibilities concerning driving and these appear to have an influence on their driving behavior. About half said their parents required them to pay for their own gas, and 48% had to maintain the car. About 44% reported having to keep their grades up (often a condition of youth receiving less-expensive auto insurance), and a similar number had a curfew. A substantial fraction (39%) reported having to run errands as a condition of their driving, while smaller numbers reported having to pay for their own insurance (20%), buy their own car (16%) or drive others around (17%).
Boys were significantly more likely than girls (P < 0.0001) to report having to cover expenses and take responsibility for the car (buy the car, pay for gas or insurance or maintain the car) as a condition of driving, while girls were statistically more likely than boys (P < 0.0017) to report having a curfew. We also found an interaction between gender and parental rules with respect to driving after alcohol use.
In general, youth who indicated they had to pay for either gas or insurance or maintain the car were more likely to drive after drinking (P < 0.02). However, this result is due to the fact that parental rules on maintaining and paying costs were not associated with drinking and driving among boys, whereas there was an association for girls. Girls who were required to pay for gas were more likely to report driving after drinking than those without such a rule. Youth who had any of these responsibilities were also more likely to report driving with friends in the car. However, youth who were expected to keep grades up and/or had a curfew were less likely to report driving after drinking or drug use.
Relatively few youth (less than 15%) reported that their parents did not allow them to drive with teenage friends in the car, even though this is a risk factor for crashes. Teens who reported they were not allowed to drive with friends in the car were statistically less likely (P < 0.0001) to have driven after drinking alcohol and less likely (P < 0.010) to report having been in a crash.
Driver education and training.
The graduated driver licensing system in California is similar to that of many other states and countries. Teens are required to go through a supervised learner's period (with a learner's permit) for at least 6 months before receiving an intermediate license. There is a minimum 50-hour requirement of supervised driving with a parent or other adult over age 25 during this period (including 10 hours at night), as well as a nighttime restriction.
During this learner's period, drivers under age 18 must enroll in and complete a driver education and driver-training course, including 6 hours of behind-the-wheel practice with an instructor. Often these training courses take place in three 2-hour sessions. The driver education course can be taken online, with students reading and taking quizzes independently; or as an instructor-led course, either through a private company or, in some cases, at school. The California Education Code requires school districts to offer driver education classes for free, but this is not enforced. Less than one-third of schools in California offer driver education classes, and even fewer provide behind-the-wheel training (Quan 2007).
In an open-ended question about how driver education or training could be improved, 48% indicated that they felt teaching quality should be improved. Nearly 20% said driver education should be more practical or hands on, while more than 12% suggested changing the amount of time for training, whether longer or shorter (most wanted it to be longer). Approximately 12% said driver education or training was “ok as it is.”
Risk factors for teen drivers
Alcohol or drug use.
Students were asked about dangerous driving behaviors (fig. 3). About 17% reported that they had (ever) driven after drinking alcohol, and 15% had driven after using drugs. For experiencing these risks as a passenger, the numbers were even higher: 39% had been in the car of a driver who had been drinking, and 27% with a driver who had been using drugs.
Friends in the car.
In California, youth who have been driving less than 12 months are not allowed to drive with other teens in the car unless a licensed driver over age 25 is present. Among students who reported that they had been driving for less than a year, 73% had driven with friends in the car, compared with 95% of students who had been driving for 12 months or more.
Late-night driving.
We found that students who had been driving for less than 12 months were significantly less likely to report driving after 11 p.m. (and to report driving with friends) than those driving 12 months or more (P < 0.0001). However, 53% reported violating the driving curfew at least once. The data suggests that the graduated driver licensing laws are reducing violation rates for novice drivers, yet a fair number continue to break one or more laws.
Passenger-related distractions.
Distraction is a key cause of accidents for both teenagers and adults. In many cases, distraction results from driver behavior, such as changing the radio, eating, talking on the phone or putting on makeup. Teen drivers are subject to these types of distractions, but research shows they are at particular risk from traveling with other teenage passengers (Heck and Carlos 2008). Specific reasons for this elevated risk have not previously been explored.
In our study, teens were asked whether they had been distracted while driving by things passengers had done. Overall, 38.4% of the young drivers (n = 623) reported such distractions, with females slightly more likely than males (P = 0.0523) (fig. 4). While there were no significant differences across racial or ethnic groups or urban, rural or suburban schools, students at lower-income schools were significantly less likely to report being distracted by passengers than those who attended moderate- or upper-income schools (P = 0.0002).
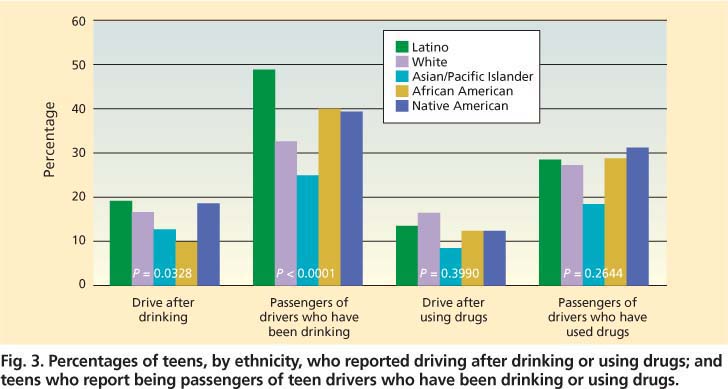
Fig. 3. Percentages of teens, by ethnicity, who reported driving after drinking or using drugs; and teens who report being passengers of teen drivers who have been drinking or using drugs.

Fig. 4. Teens who reported being distracted while driving, and the causes. Talk, yell = passenger talking or yelling. Fool around = passenger fooling around, messing around. Music, dance = passenger dancing in car, changing radio station or CD. Point out = passenger pointed something out to driver. Deliberate = passenger caused an intentional distraction, such as hitting or tickling driver or attempting to use the vehicle's controls. P values measure the significance of difference between genders, where P is significant at < 0.05.
The most common distraction reported was a passenger talking, yelling, arguing or being loud (nearly 45%). However, more than 22% of the teenage drivers said they were distracted by passengers “fooling around,” “wrestling” or otherwise behaving playfully or foolishly. About 16% of drivers reporting distractions said passengers played music, danced or changed the CD or radio station. About 3% reported accidental distractions such as spilling things. Overall, 7.5% of the students reported passenger-related distractions that appeared to be intentional, such as hitting, poking or tickling the driver, or attempting to use the vehicle's controls. This number may be an underestimate because for some of the comments, particularly those referring to “fooling around,” it was not possible to determine whether the distractions were intentional.
Reporting being distracted by a passenger was strongly associated with driving after alcohol use (P = 0.0003); this suggests that high-risk driving behaviors may tend to cluster among certain youth. Also, youth who reported having had a crash as a driver and those who reported having ridden with a dangerous driver were more likely to say they had been distracted as a driver.
Passengers of unsafe teen drivers.
More than 59% of students had been passengers when a friend was driving dangerously, indicating that this is a common experience. However, over 83% said they would speak up if they felt unsafe because a friend was driving dangerously.
Car crashes.
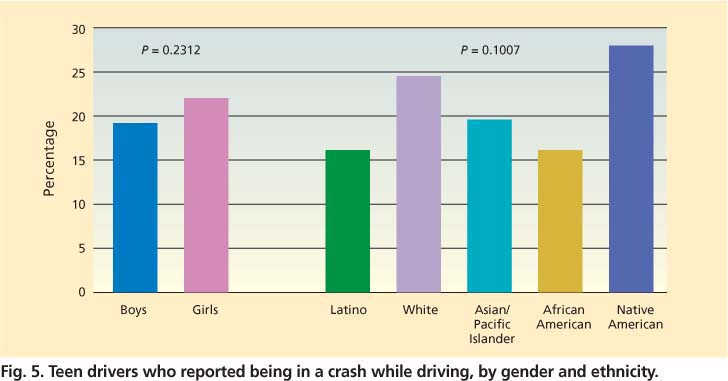
One of the risks to novice drivers is the greater possibility of being involved in a serious motor vehicle accident. California crash data indicates that drivers 15 to 17 years old were at fault in 68% of fatal car crashes in which they were involved (ACSC 2006). When asked if they had been in any car crash as a driver, 328 teens (20.5%) responded positively (148 males, 180 females). The majority of crashes occurred during daylight (63%). Speeding or reckless driving was the contributing factor most often identified (29.7%). Other contributing factors included bad weather (18%), car problems (11%), cell-phone use (11%) and alcohol or drug involvement (10%). Among additional responses, about 10% said a lack of attention contributed to the crash.
There were no significant ethnic differences among students indicating that they had been in a car crash as a driver, but girls were more likely than boys (fig. 5). Almost half of students surveyed (47%) said they had been in a crash as a passenger. This finding is similar to data reported by the National Highway Traffic Safety Administration that 47.2% of 17-year-olds (per 1,000 drivers) had been involved in an injury or fatal crash (NHTSA 2003).
Keeping teen drivers safe
Our results underscore the need for graduated driver licensing laws, which clearly address the most important issues facing teen drivers: risky driving behaviors; driving situations that may require greater experience or judgment, such as night driving; and distractions by passengers in the car. These laws place legal boundaries on new drivers, not only helping to save lives, but also offering an “out” to teens who feel pressured to drive friends around. Legal restrictions help keep novice drivers safe as they continue to develop cognitively into the late teens/early twenties and gain more driving experience.
Teens expressed frustration about driver education and training. They indicated that they would prefer updated, less-boring teaching methods. A noteworthy comment by more than a few students was that during in-car driver training, some driving instructors did not always appear to be focused on instruction, but rather on personal issues and tasks. Another important comment was the need for more handson, practical driving experience, with more than 6 hours of total instruction behind the wheel. Students clearly said they wanted as much driving experience as possible when learning. This is addressed in the graduated driver licensing laws, which require 50 hours minimum supervised driving during the learning period.
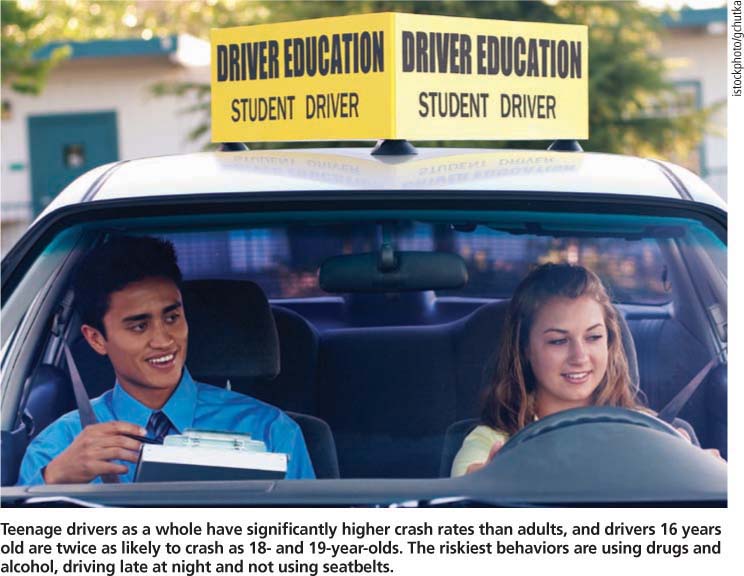
Teenage drivers as a whole have significantly higher crash rates than adults, and drivers 16 years old are twice as likely to crash as 18- and 19-year-olds. The riskiest behaviors are using drugs and alcohol, driving late at night and not using seatbelts.
Teens indicated how important their parents were as resources when learning to drive. By placing expectations on their children and through teaching and guidance, parents provide boundaries for teens that allow them to safely develop skills and learn the responsibilities that come with the privilege of driving. The fact that most students did not report having rules about teen passengers suggests that parents may be less concerned about this risk, a somewhat curious but not isolated finding.
Williams et al. (2006) found that parents thought the highest risks to teen drivers were drugs and alcohol, post-midnight driving and seatbelt nonuse, and the lowest risks were 9 p.m.-to-midnight driving and driving with one passenger. (When the Williams et al. [2006] survey was administered, driving with a teen passenger was legal for novice drivers.) There are several reasons why California parents may not enforce the no-passenger rule as vigorously as others. For one, there are exceptions to the restriction. The California Department of Motor Vehicle Web site states that a novice driver may drive other teenagers when other reasonable transportation is not available (DMV 2009). In these cases, a signed note must be kept in the driver's possession explaining the necessity and the date that it will end. This exception can apply to sports events, school transportation and other school activities, as well as the need to drive younger siblings to their activities or school. If novice drivers can legally drive in certain situations with other teens in the car, these exceptions may lead parents to believe the rule is not as important as others.
This particular rule may also be viewed as irrational. If two teens plan to attend the same nonschool event yet neither has driven for more than 1 year and both have their licenses, neither can legally drive the other in the same car. It may be perceived as wasteful for them to go in two separate cars. This is one area for future research and education; parents clearly have a powerful influence on their teens, but the message of how risky teen passengers can be to the safety of all in the car must be strengthened, clarified and better understood by parents (Williams et al. 2006).
It is difficult to know for certain how many unlicensed drivers are on the road at any time. Our study clearly indicates that teens do drive without licenses, for various reasons. These drivers appear to be involved in fewer crashes and are more likely to follow other driving laws, but everyone faces the risks of unlicensed driving. Licensure status was strongly related to income, with almost two-thirds of unlicensed drivers attending lower-income schools, as were 40% of nondrivers. While the costs of driving (e.g., insurance and fuel) may remain prohibitive, finding ways to make driver education and training more affordable for all teens would result in better-educated and better-trained drivers on the road.
To our knowledge, there have been few if any studies that focused specifically on California youth and their driving behaviors and perceptions. All new teen drivers are influenced by peers and are susceptible to distractions, as a normal part of their maturation process. For the most part, young people try to be good drivers and follow the laws of the road. Our study sheds light on the regulated aspects of driving that are difficult to enforce. We found that students place a high value on driving and enjoy the opportunities that come with it, but also that they need more legal and adult guidance so that they can learn safely.
Survey explores teen driving behavior in Central Valley, Los Angeles high schools

