


All Issues
Agro-environmental partnerships facilitate sustainable wine-grape production and assessment
Publication Information
California Agriculture 62(4):133-141. https://doi.org/10.3733/ca.v062n04p133
Published October 01, 2008
PDF | Citation | Permissions
Abstract
The California wine-grape sector has invested considerable time, money and effort in collective enterprises to reach fellow growers and assess the industry as a whole on sustain-ability. At the same time, California wine-grape production has become increasingly branded by particular geographic regions. Premium wine grapes are grown in regions with high population growth, high land values and often, charged environmental politics. Growers and their institutions have developed several agro-environmental partnerships to assess, improve and publicly represent their environmental stewardship and farming practices. We review trends in several regional and statewide indicators of sustainability, including crush prices, grape acreage, population growth and pesticide use. This review is based on 2 years of field research with participants in wine-grape partnerships, a review of documentary evidence, technical advisory work with the programs and summary assessment of case study data, as well as an analysis of 10 years of Pesticide Use Report data for California wine-grape growers.
Full text
California leads the nation in wine-grape and wine production, valued at $2.2 billion and $16.5 billion, respectively. The wine sector is estimated to collectively contribute more than $51.8 billion to the state's economy (MKF Research 2006). More than any other commodity, the California wine-grape community over the past 15 years has embraced the concept of “sustainability” (Warner 2007a, 2007b). The United Nations' Brundtland Report (WCED 1987), which popularized this term, raised concerns that agricultural production had led to resource degradation and economic and social inequality.
Sustainable agriculture has been defined as a goal, a scientific research endeavor (NRC 1989) and a social movement (Allen 1993) that prioritizes equally environmental protection, economic viability and social equity. Agro-environmental partnerships are the leading strategy for extending sustainable agriculture in California (Swezey and Broome 2000; Warner 2007a). These partnerships consist of an agreement over more than one season among growers, growers' organizations and agricultural scientists to apply agro-ecological principles to farm-scale practices and improve the stewardship of environmental resources.
These partnerships are a California version of “Third Way” agriculture (El Titi 1992), signifying a blend of organic and conventional pest-management and production practices. They draw from organic and other alternative techniques but are oriented toward a broader set of environmental goals than complying with a restricted list of inputs, as prescribed by the U.S. Department of Agriculture's National Organic Program. Particularly in the wine-grape industry, these partnerships have also involved regulators, and environmental and community leaders and their organizations.
Between 1993 and 2003, 32 partnerships were created in 16 California commodities. The biological and social systems of production in perennial crops are more suitable for these partnerships, and 24 of them were in tree and vine crops. Wine-grape growers created six partnerships, more than any other crop (Warner 2007b). We present a summary of 2 years of field research with participants in three of these wine-grape partnerships, including interviews and focus sessions, and review of documentary evidence. We supplement that work with additional and updated state and federal data, as well as examples and summary assessment data obtained from the case studies.
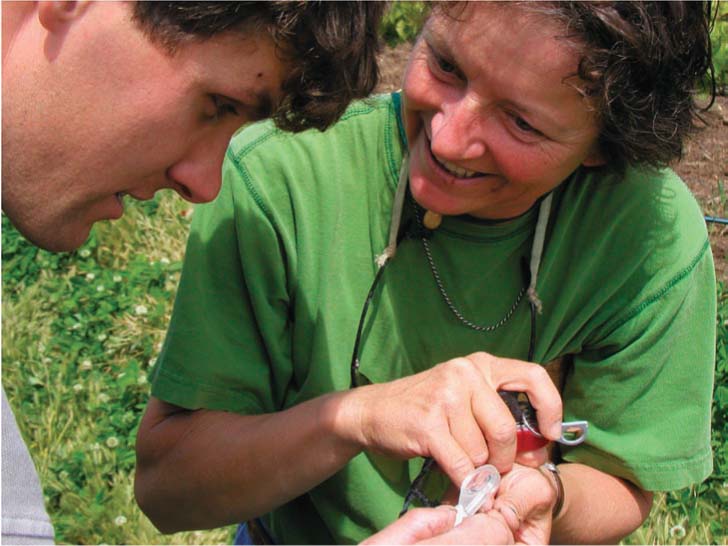
The California wine industry has been a leader in proactively promoting sustainable practices. Above, IPM consultant Laura Breyer identifies natural enemies controlling a Sonoma County grower's vineyard pests.
Sustainable grape innovation
Over the past decade, environmental concerns that have arisen around California vineyards and wineries include (Conaway 2002; Friedland 2002; Poirier-Locke 2002; Warner 2006):
-
Oak woodland losses, and forest and wildland conversions on the North Coast and Central Coast.
-
Water usage and water-quality standard violations, principally from sediment.
-
Farm labor, pay and environmental health concerns.
-
Introduced invasive species and new pest-disease vectors.
-
Regional pesticide-use controversies, such as spray drift.
-
Hillside development and erosion problems in Napa and Sonoma counties.
-
Congested roads and noise around wineries.
-
Community conflicts.
-
The loss of endangered species and their habitat.
To address these public concerns, wine-grape growers launched coordinated efforts to enhance environmental stewardship in their region's vineyards, but also to reach out to neighbors with credible information about their progress.
Dating back to the 1970s, organic viticulturalists, including biodynamic ones, were the first sustainable viticulture innovators in California, and they have greatly contributed to later, broader attempts at designing and defining sustainable viticulture (Daane et al. 2005). Organic wine-grape growers must develop an organic systems plan, refrain from using most synthetic pesticides and fertilizers, undergo a 3-year transitional period, and obtain third-party certification for their production and processing systems based on federal regulations (see sidebar, page 138).
California wine-grape growers have created more partnerships than any other commodity because they have: (1) created strong local organizations; (2) differentiated their product quality by varieties that depend on regional environmental conditions; (3) added significant economic value to wines by geographic branding; and (4) recognized the importance of providing educational outreach to their environmentally conscious neighbors (Warner 2007b). These factors have prompted the industry to develop what may be the most comprehensive sustainability initiative of any U.S. commodity. California's more than 40 regional winegrower and vintner associations provide a preexisting set of economic and social relationships upon which these partnerships have been built (CSWA 2004).
California sustainable wine-grape production systems comprise a suite of farming practices and include self-assessment systems that allow growers to score their practices and document progress toward sustainability along a continuum. Growers, consultants, researchers, winery personnel and environmental advocates debated particular practices and their social and environmental impacts, and designated rankings or points for specific practices. These assessment systems integrate a range of practices into a whole farming system.
Many of the practices effectively implement the results of years of University of California research, such as leaf removal and canopy management, use of cover crops, integrated pest management (IPM), economic injury thresholds, use of weather data and models for disease-risk forecasting, and genetic resource improvements. Wine-grape growers and their organizations created these partnerships to apply basic research to the specifics of their local production regions. They are semiprivatized extension efforts, drawing from and partnering with UC scientists and advisors to specify and make progress toward sustainability goals. All programs described were created with extensive UC Cooperative Extension input and review.
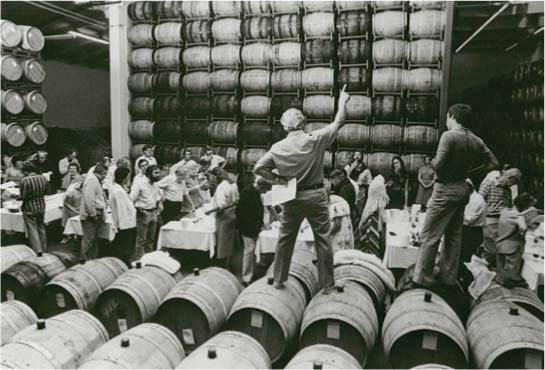
The Robert Mondavi Winery (Mondavi, center), initiated one of the earliest sustainable viticulture initiatives, which evolved into the Central Coast Vineyard Team.
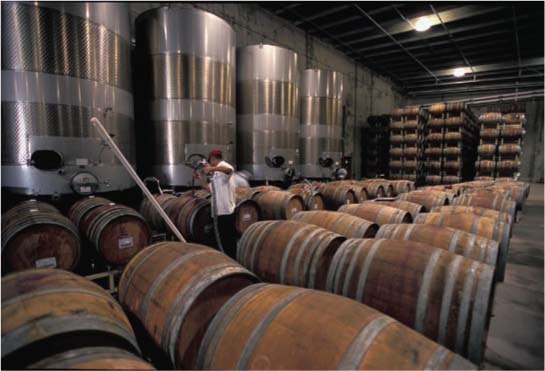
Winery operations — not just grape-growing — are included in “ground to bottle” partnerships such as the California Sustainable Winegrowing Program.
Central Coast Vineyard Team
The Central Coast Vineyard Team (CCVT) grew out of the Central Coast Natural Vineyard Team, initiated by the Robert Mondavi Winery in 1994 to enhance wine quality in the rapidly expanding Central Coast and promote sustainability. Mondavi staff facilitated this process with vineyard management companies that had wine-grape contracts with them, but the initiative was soon opened up to include other wine-grape producers. Even though this growing region is geographically large, most vineyard management decisions were made by a small number of people who had worked together over the years. The CCVT was the first in California to develop a self-assessment system for vineyards, called the Positive Points System (PPS) (CCVT 2007). It obtained grants that enabled it to expand on-farm demonstrations and provide pest, crop and soil monitoring, and a collaborative outreach program.
Positive Points System (PPS).A first draft of the PPS was circulated on paper in 1995. Now it can be completed online or by filling in a 21-page printed version. The assessment has 152 questions, with points assigned based on the issue's importance to regional sustainability. For example, questions include: “Is sanitation regularly practiced for those diseases that are spread by infected tissue left in the vineyard (i.e., bunch rot, phomopsis, crown gall)? (4 points).” and “Are cultural practices that deter the spread of disease regularly used (i.e., late pruning for Eutypa; avoidance of trunk injury for crown gall; leaf removal for Botrytis cinerea)? (4 points).” Six sections cover pests, soils, water, viticulture management, wine quality and continuing education, with a total possible score of 1,000. Practices related to habitat protection and ecosystem management are integrated throughout the six sections.
As of 2007, the CCVT had 300 members who farmed 60,000 acres on the Central Coast, and the team had conducted 750 assessments (some of the same vineyard blocks were addressed over multiple years). Overall, PPS self-assessment scores have steadily increased and were on average about 50 points higher in 2006 than 10 years earlier, indicating that participants are farming more sustainably than in the past. Growers evaluating a single block have also improved their scores; over a 10-year period (1996–2006) there were 166 repeat assessments where 153 scores increased and 13 decreased. More than one-half of the repeat evaluations improved their scores from 1 to 100 points, indicating the adoption of as many as 10 new practices (fig. 1). Almost 10%) of the repeat growers increased their scores by 300 points or more, indicating major changes.
Water quality.The CCVT also obtained funds to assess the potential to protect water quality by relating practices in the PPS to their erosion potential, based on a nonpoint-source erosion model. Starting in 2005, the Central Coast Regional Water Quality Control Board (CCRWQCB) allowed growers to complete the PPS and its Future Plans Form to qualify as a farm plan under the conditional agricultural waiver. The CCRWQCB requires farm plans that outline best management practices to be employed on-farm so that irrigation water discharges do not cause or contribute to water-quality impairments (by releasing sediments, pesticides or fertilizers), instead of requiring waste discharge permits from irrigated lands.
Certification.In 2007, the CCVT. received funding to develop a pilot sustainable viticulture third-party certification program, which they launched in early 2008 with a revised certification-oriented PPS. Wine bottles from the 2008 harvest will display this label.
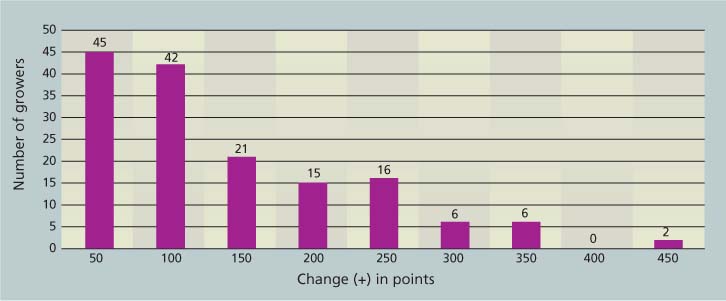
Fig. 1 Central Coast grape growers' vineyard blocks (n = 153) self-assessed using the Positive Points System (1996–2006) and total point increases in use of sustainable practices. Point scores for only 13 blocks decreased over time (data not shown). Source: Self-assessment database maintained by the CCVT through Kris O'Connor.
Lodi Winegrape Commission
The Lodi Winegrape Commission (LWC) was established by grower vote in 1991 under a state marketing order. Membership is mandatory for any producer of more than 25 tons of wine grapes per year in this region. LWC's roughly $1 million budget is funded by a district wide tax of 0.45% of grape value, 70% of which supports promotion and 30% research and grower outreach. There are currently about 750 LWC member growers farming nearly 100,000 acres of wine grapes, about 13% of the acreage in California, and they produce about 18% of the state's total crush tonnage (Goodhue et al. 2008).
Sustainable farming program and workbook.In 1995, LWC received a grant from the UC Sustainable Agriculture Research and Education Program's (UC SAREP) Biologically Integrated Farming Systems (BIFS) program to develop on-farm demonstrations, a monitoring program, and a grower-driven outreach effort to increase the adoption of environmentally protective and economical practices (see page 142). In 1998, they developed Lodi Winegrowers Workbook: A Self Assessment of Integrated Farming Practices (Ohmart and Matthiasson 2000; and revised in 2008). The workbook includes a form for growers to develop an action plan, along with detailed educational materials.
Lodi Rules.After the workbook was developed, a subset of growers, along with consultants and others, initiated the first third-party certification system for California wine grapes, called the Lodi Rules for Sustainable Winegrowing (LWC 2007). The rules are based on a set of farming standards or ranked practices, and unique to this program, a Pesticide Environmental Assessment System (PEAS) that provides a risk index for pesticides used in a vineyard. The rules outline 75 farming practices in six chapters, many of which require growers to have management plans with specific components.
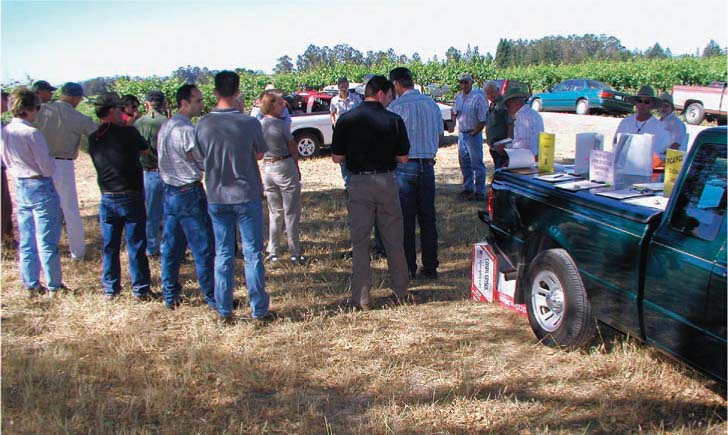
Grape growers who participate in partnerships assess their own practices and develop action plans to reduce vineyard impacts on the environment, wildlife and people. Field days, such as this one hosted by the Sonoma County Winegrape Commission, provide hands-on exposure to best practices.
The PEAS score is calculated by multiplying the pounds of a pesticide applied by a toxicity factor, and it includes use patterns to further extrapolate the relative risk of exposure based on use method. Risks are assumed to potentially arise from multiple routes of exposure (for people, via food, water, dermal or inhalation exposure). Some exposures are short-term (acute risks) and others occur steadily over a long period of time (chronic risks). The PEAS model currently includes (1) worker acute risks, (2) dietary risks to people from acute and chronic exposure, (3) acute risks to small aquatic invertebrates, (4) acute risks to birds and (5) acute risks to bees and natural enemies of pest insects.
Certification.Individual vineyards that subscribe to the Lodi Rules are certified by a third-party, Protected Harvest. A vineyard qualifies for certification if it meets two criteria. First, the farming practices must achieve a score of 50% or better for each chapter; scoring below 50% on any chapter disqualifies the vineyard from certification. Moreover, a vineyard cannot score “fail chapter” on any of 11 particular standards, such as keeping written records of pest monitoring results for vineyard arthropod pests, having a comprehensive nutrient-management plan or testing soil before preplant fumigation.
Second, the “environmental impact units” for pesticides used in a vineyard for the year, calculated by the PEAS model, cannot exceed 50. In 2005, six vineyards were certified under the Lodi Rules label. In 2006, 12 growers participated, certifying 43 vineyards totaling 5,457 acres. In 2007, 18 growers certified 96 vineyards totaling 7,600 acres. In early 2008, five different wineries bottled and labeled a total of 14 different wines displaying the Lodi Rules logo on their labels. These wines are from the 2005 and 2006 vintages (personal communication, C. Ohmart, 2008).
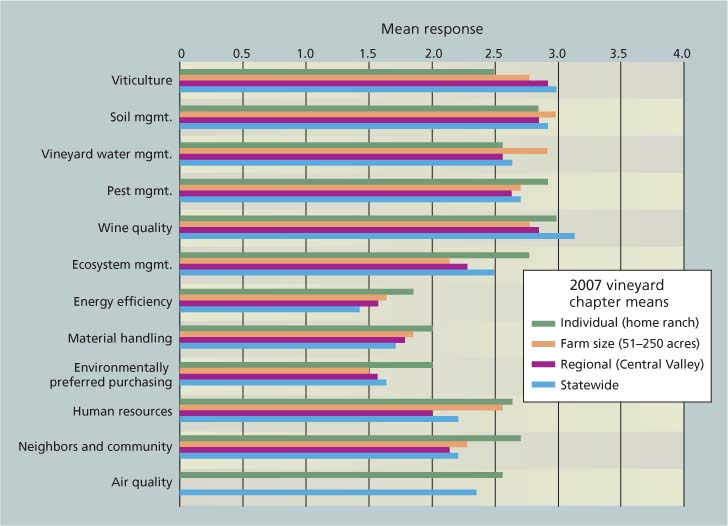
Fig. 2 California Sustainable Winegrowing Alliance's Code of Sustainable Winegrowing 2007 mean chapter responses by statewide level, regional level, farm size range and individual vineyard operation (home ranch). Average responses (1–4) are across all criteria for each of the 12 chapters (chapters 10 and 12 are for winery operations only and are not included). Source: CSWA self-assessment database.
Sustainable Winegrowing Program
The California Sustainable Winegrowing Program (SWP) began in 2001 as a statewide initiative to promote and adopt “ground to bottle” practices for producing grapes and wine. The program is led by the California Sustainable Winegrowing Alliance (CSWA), a nonprofit organization formed in 2003 of leaders from the two major statewide associations affiliated with California wine grapes and wine — the Wine Institute and the California Association of Winegrape Growers. The SWP uses the Code of Sustainable Winegrowing Practices: Self-assessment Workbook (2nd ed.) to outline and rank ecological, economic and social-equity practices through an integrated set of 16 chapters covering 12 areas and 227 criteria. It was first published in 2002, was revised in 2006 and is now available online (Dlott et al. 2006). Chapters cover soil, water and pest management, wine quality, energy efficiency, material handling, solid-waste reduction, purchasing, human resources, neighbors and community, and air quality. The viticulture chapters are modified from the Lodi Winegrower's Workbook (see page 145, table 2). The Code is, however, even more far-reaching than either regional initiative in that it includes an assessment of winery operations such as water quality and conservation.
The SWP collaborates with local grower and vintner organizations to create participatory educational programs that help growers progress toward sustainability. Winegrowers who participate in workshops submit self-assessments, which the program uses to develop confidential benchmark reports on how individual operations are performing relative to statewide and regional scores, or scores based on vineyard operation size (fig. 2). One hundred self-assessment workshops have been held since the program started.
The 2006 report indicated that 1,165 enterprises had evaluated their sustainable practices, covering 33% of California's 522,000 total wine-grape acres and 53% of the state's total annual wine production of 273 million cases (CSWA 2006). The statewide mean values for the chapters (possible range of 1 to 4, with 4 being the highest) show higher scores, closer to 3, for vineyard management practices involving soils, water, pests and wine quality (fig. 2). These rankings are similar to earlier regional programs such as Lodi's, and it appears that more of the industry that has assessed itself is at this level. The statewide mean scores for vineyard energy efficiency and environmentally preferred purchasing are lower than for vineyard production practices, closer to 2, with further room for improvement.
The mean scores can also be used to assess progress over time (CSWA 2006). Winegrowers assessed between 2002 and early in 2004 as compared to those assessed late in 2004 through 2006 increased their performance in 31 of 38 pest management criteria, by nearly 8%. Pest management along with energy efficiency, air and water quality, and ecosystem management were the focus of more than 100 targeted education events hosted by SWP during this time.
The SWP is remarkable in several respects. It involves the most sophisticated analytical tool yet developed for evaluating the production of an agricultural product, and it is the first partnership to evaluate operations based on personnel practices and community outreach.
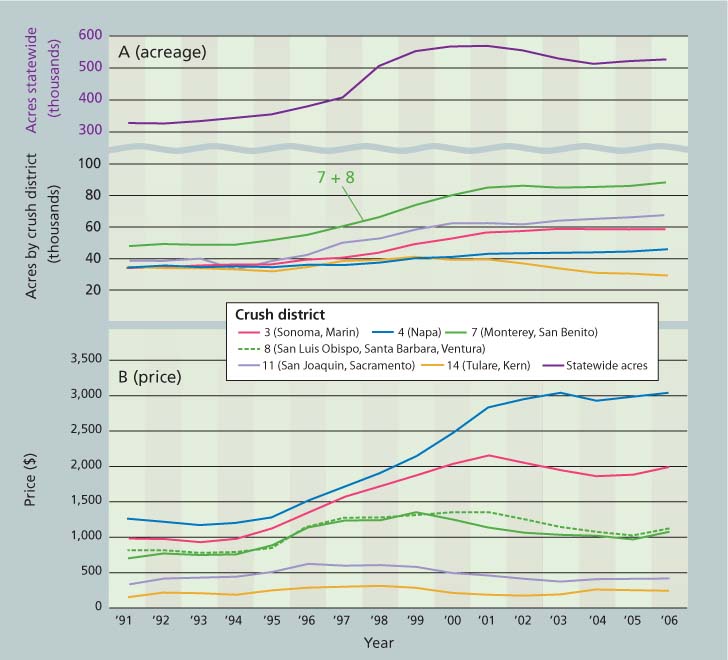
Fig. 3 (A) Estimates of California wine-grape acreage (bearing and nonbearing), 1991–2006, for selected crush districts (CD) and statewide. CDs 7 and 8 include counties also in the Central Coast Vineyard Team, and CD 11 is the same as the Lodi Winegrape Commission. Source: USDA NASS 2006a. (B) Wine-grape weighted average of grower returns per ton, 1991–2006. Source: USDA NASS 2006b.
North Coast and other regions
With over 40 regional organizations, California wine-grape growers and vintners are well organized and represented. The North Coast premium wine regions have partnerships that also embrace sustainability and play key roles in the statewide SWP. The Napa Valley Grape Growers Association and Napa Valley Vintners worked with the Fish Friendly Farming water-quality protection program in 2003 to create a local certification program called Napa Green Land. Napa is basing its winery certification program on the SWP and calling it Napa Green Winery. The Sonoma County Winegrape Commission, formed in 2006, will also use the statewide SWP. Mendocino County has been home to early pioneers in organic and sustainable viticulture such as Fetzer, Bonterra and Frey, and over 70% of Lake County growers have contributed assessments to the SWP database.
Quality and place-based farming
California's wine-grape industry has been proactive in addressing sustainability for the past 15 years. Interviews, focus groups and participation in these partnerships suggest a range of explanations (see Warner 2007b for details on methodology). Some individuals were motivated by a personal, deeply held philosophical commitment to the environment, others cited economic considerations and still others hoped to reduce the fallout from bad publicity linked to conflicts over resource use and the environment and/or human health.
Addressing regional conflicts.Wine grapes have been geographically branded or linked to specific regions for almost 40 years in California. Several transitions toward geographic specificity and segmentation in the industry have occurred, from generic table wines, to varietal wines, to appellations and most recently vineyard-designated or terroir wines (Lapsley 1996). This means wine grapes are marketed as a product of specific place more than any other agricultural product. This approach has led to tremendous success and acreage growth, particularly throughout the 1990s and reaching a peak statewide of 570,000 acres in 2001, but more recently declining to 527,000 acres in 2006 (USDA NASS 2006a) (fig. 3A).
However, geographic branding has exposed wine-grape growers to greater environmental criticism linked to the place of production (Friedland 2002; Warner 2007b). Conflicts have arisen due to rapid vineyard development, an ever more-restricted land base in the premium coastal valleys, and the growth of ex-urban wealthy populations in rural areas. Long-term solutions will come from dialogue at the community level and improvements to current practices that address equally the community's economic, environmental and social goals.
Economics of sustainability.An important element of sustainability is economics, and for individual growers the price they receive may determine whether they continue to farm. Over the life of these initiatives, prices received by growers increased, especially in the late 1990s, for all the crush districts that we studied (USDA NASS 2006b) (fig. 3B).
However, prices flattened out or declined early in 2000 for most districts. Much of this price decline is likely due to earlier increases in acreage and hence local grape oversupply, as well as global competition, particularly from other New World wines, and reduced leisure and business travel following 9/11. The average crush price growers receive has continued to climb in Napa, while its acreage has remained static due to a planting out of the valley. Napa (crush district 4) currently has an average crush price that is over 10-fold higher than crush district 14 (Kern and Tulare counties).
Lodi (crush district 11) and the two Central Coast crush districts (7 and 8), which cover the CCVT membership area, at first experienced major growth in the mid- to late 1990s in both acreage and prices received for grapes, at the same time that their assessment systems were developed. The Lodi crush price peaked in 1996 at $628 per ton and remained above $500 per ton until the early 21st century. Average crush prices in 1999 and 2001 for Central Coast crush districts 7 and 8 peaked at $1,348 and $1,353 per ton, respectively.

Fig. 4 California wine-grape acres treated with pesticides, 1994–2006. Source: California Department of Pesticide Regulation (DPR) 2006 Pesticide Use Reports.
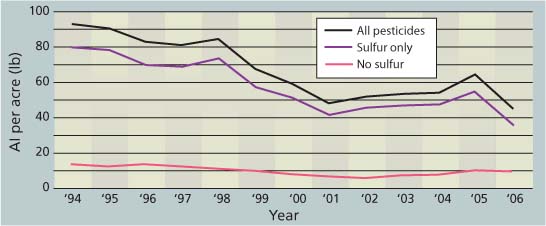
Fig. 5 Pounds pesticide active ingredients (Al) applied statewide to wine grapes per acre planted, 1994–2006, for all active ingredients, those containing sulfur (sulfur only), and all other active ingredients except sulfur (no sulfur). Pesticide data is for “grapes, wine” from DPR Pesticide Use Reports; San Joaquin County includes both “grapes” and “grapes, wine” categories. Sources: DPR Pesticide Use Reports; USDA NASS 2006b acreage data (bearing and nonbearing).
Regional yield differences can make up for price differentials; for example, higher yields in crush district 11 over lower yields but higher prices in districts 7 and 8 can sometimes mean equal or better total returns for district 11 growers. Since the early 21st century, growers in these two regional partnership areas appear to have experienced a drop in crush prices districtwide. Since the average crush prices reported combine prices paid as part of long-term contracts, as well as short-term sales, some growers paid through short-term sales received even less for their grapes.
Providing perhaps a more important measure of sustainability, the Lodi crush district has maintained its price lead over elsewhere in the San Joaquin Valley — such as crush district 14 (Kern and Tulare counties) — while the Central Coast crush districts (7 and 8) received prices more than double those of Lodi. Both regions have created agro-environmental partnerships that recently include third-party certification programs in sustainable viticulture, so as to capture greater recognition and possibly price. The Central Coast and Lodi regions also continue to be recognized and rewarded economically for perceived superior wine quality.
Declining pesticide use
Wine-grape growing practices can affect — both positively and negatively — California water, air and soil quality, human health, and plant and animal habitat. This happens through vineyard development and production practices such as vegetation removal, new plantings, earth moving, tillage and the use of agricultural chemicals, including pesticides. We analyzed pesticide use trends as a proxy for the industry's environmental and human health impacts.
California has a unique tool in its full-use reporting of pesticides applied to agricultural products, called Pesticide Use Reports (PUR). All agricultural applications are required to be reported to county agricultural commissioners, who submit this information to the California Department of Pesticide Regulation (DPR). Working with DPR, we obtained error-checked summary data for pesticides used on wine grapes as county and statewide totals from 1994 through 2006. These data reside in an MS Access database and were manipulated using MS Excel and pivot tables.
We analyzed and then graphed total vineyard acres treated from 1994 to 2006 for the four main types of pesticides used on wine grapes: fungicides (sulfur only), fungicides (no sulfur), herbicides and insecticides (fig. 4).
Sulfur accounted for the bulk of materials used on wine grapes, with peaks in 1998 and 2005. Sulfur is considered a relatively low-toxicity fungicide and some forms are allowed for use in organic certification. Total insecticide and herbicide use has stayed pretty constant despite acreage increases.
Because acreage increased substantially from 1994 to 2006, we then calculated pounds of active ingredient applied per acre planted using National Agricultural Statistics Service/California Department of Food and Agriculture county acreage estimates. Especially in the late 1990s, the pounds of pesticides applied to growing acreage declined statewide (fig. 5) and in all regions (data not shown). Because sulfur is used at such a high rate and so extensively on grapes to control powdery mildew, changes in sulfur use appear to explain much of the total reduction in pesticide use per acre (fig. 5). Changes in the sulfur products themselves (from dust to dry flowable formulations) as well as reductions in use frequency may account for much of this per-acre decline.
During this time, the Gubler-Thomas powdery mildew risk index was developed and implemented (see page 127). Use of the index to time fungicide applications is encouraged in these grape sustainability assessment systems, and it has been adopted by 50% of grape-grower survey respondents (Lybbert and Gubler 2008). Although reductions in sulfur use are important in explaining the downward trend in pesticide use on wine grapes, Daane et al. (2005) also found that insecticide use (total pounds applied per acre as well as broken out by chlorinated hydrocarbons, organophosphates, carbamates and miticides) on grapes declined per acre over this same period.
Long-term benefits
Sustainability programs cost money to create and implement. The CCVT obtained approximately $1.6 million in the past 10 years for the PPS and related programs (K. O'Connor, personal communication). The Lodi Winegrape Commission has secured about $1.5 million in grant funds over the same period (C. Ohmart, personal communication), but also draws on its annual assessment fee. The California Sustainable Winegrowing Alliance has obtained approximately $2.2 million in grant funds over the past 5 years, and its main partners have provided about $1.5 million in direct funds (A. Jordon, personal communication). Matching funds from grower membership payments and in-kind services have substantially added to grant funds. The greatest additional expenses have been borne by growers, who generally recognize that environmental stewardship is necessary for credible community outreach and market reputation.
Faced with increasing population, global competition, environmental protection and input costs, the wine-grape industry's definition of quality and production in place increasingly includes promoting stewardship and sustainability. Other perennial crop commodity groups have witnessed the benefits of the wine-grape industry's agro-environmental partnerships and are selectively adopting their strategies, suggesting that the future is bright for collaborative sustainability initiatives in California agriculture (Warner 2007b).
Only time will tell if an individual grower's bottom line, environmental record or community relationships will benefit. Certainly the industrywide effort to assess itself and establish benchmarks, and then promote a cycle of continual improvement in the adoption of sustainable practices both in the vineyard and the winery, is an historic event.
Goodhue et al. (2008) documented the fragmentation of the California wine industry, finding bimodal expansion of multiwinery corporations with many labels on one end, and small wineries selling directly to consumers, restaurants and final users on the other. Midsize wineries that sell 25,000 to 75,000 cases a year may be forced to get larger or smaller. Regional, sustainable wine-growing branding may allow some of the “ag in the middle” growers to survive the coming challenges by increasing their economic sustainability, creating a more competitive and desirable product labeled as such, and creating greater consumer awareness, and therefore demand, for these place-based, sustainably produced wines.
Agro-environmental partnerships facilitate sustainable wine-grape production and assessment

