


All Issues
Expanded production of labor-intensive crops increases agricultural employment
Publication Information
California Agriculture 58(1):35-39. https://doi.org/10.3733/ca.v058n01p35
Published January 01, 2004
PDF | Citation | Permissions
Abstract
The production of labor-intensive fruit, vegetable and horticultural specialty crops increased in the 1990s, as did the employment of farmworkers: average annual employment or roughly the number of year-round equivalent jobs rose about 20%, to almost 400,000. Far more individuals, however, are employed on California farms during the year. Agricultural employers reported 1.1 million individuals (unique Social Security numbers) when they paid unemployment insurance taxes in 2001. We analyzed the jobs and earnings of these farmworkers in 1991, 1996 and 2001. About three individuals were employed for each year-round equivalent job in the 1990s, and there was a shift to farmers hiring workers via farm labor contractors. The findings suggest that it may be possible to employ a smaller total farm workforce, with each worker employed more hours and achieving higher earnings.
Full text
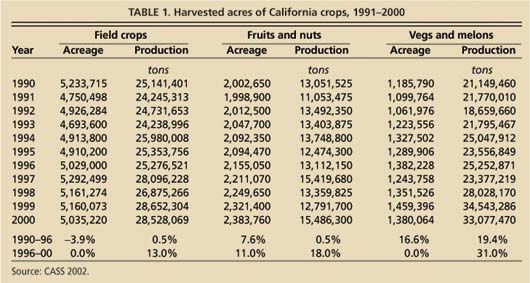
California has the largest and most complex agricultural labor market in the United States, reflecting seasonal employment demands, the predominance of immigrant workers and the significant role of labor contractors in matching workers and jobs. Whether measured in sales, production or acres, California agriculture expanded in the 1990s (table 1). Farm sales reached $27 billion in 2000, with about 77 million tons of crops produced on 8.8 million acres. More than half of these sales (with 49 million tons of produce on 3.8 million acres) were in fruits and nuts, vegetables and melons, and horticultural specialties (FVH), such as flowers and nursery products. Rising yields meant that more tons of vegetables were produced from the same acreage, while acreage of fruits and nuts rose from 2 million acres in 1990 to 2.4 million acres in 2000, a 19% increase over the 1990s.

Labor-intensive crops such as fruits and nuts, vegetables and melons, and horticultural specialties now account for more than half of California farm sales. An analysis found that 1.1 million workers are doing the equivalent of 400,000 year-round agricultural jobs in California. In Watsonville, farmworkers harvest strawberries.
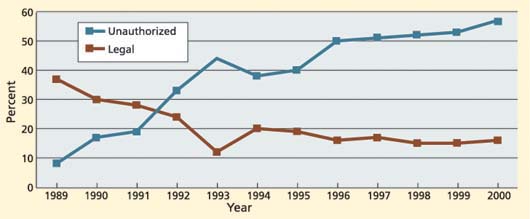
Many FVH commodities are labor intensive, with labor accounting for 15% to 35% of production costs. Most of the workers employed on FVH farms are immigrants from Mexico, and a significant percentage are believed to be unauthorized (fig. 1).
In recent years, several proposals have aimed to reduce unauthorized worker employment in agriculture ( see page 4 ). In September 2001, Mexican President Vincente Fox called for a U.S.-Mexico labor migration agreement so that “there are no Mexicans who have not entered this country [U.S.] legally, and that those Mexicans who come into the country do so with proper documents. Regularization does not mean rewarding those who break the law. Regularization means that we give legal rights to people who are already contributing to this great nation.” President George Bush agreed: “When we find willing employer and willing employee, we ought to match the two. We ought to make it easier for people who want to employ somebody, who are looking for workers, to be able to hire people who want to work” (Migration News 2001).
The United States and Mexico appeared close to agreement on a program to legalize farm and other workers before September 11, 2001. However, after the war on terror was declared, the momentum for a new guest-worker program and the legalization of immigrants already in the country slowed. In summer 2003, there were several new proposals for a migration agreement with Mexico to legalize the status of currently unauthorized workers and allow some to earn immigrant status by working and paying taxes in the United States. There is little agreement, however, on what impacts such a program would have on California's farm labor market.
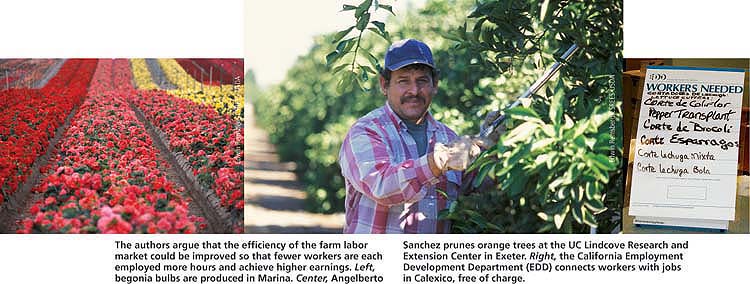
The authors argue that the efficiency of the farm labor market could be improved so that fewer workers are each employed more hours and achieve higher earnings. Left, begonia bulbs are produced in Marina. Center, Angelberto Sanchez prunes orange trees at the UC Lindcove Research and Extension Center in Exeter. Right, the California Employment Development Department (EDD) connects workers with jobs in Calexico, free of charge.
We used a unique database to examine farm employment trends in California agriculture. The data suggests that: (1) about three individuals are employed for each year-round equivalent job, helping to explain low farmworker earnings; (2) there was a shift in the 1990s from crop farmers hiring workers directly to farmers hiring via farm labor contractors (FLCs); and (3) there is considerable potential to improve farm-labor market efficiency, by using a smaller total workforce with each worker employed more hours and achieving higher earnings.
Average, peak and total employment
California employers who pay $100 or more in quarterly wages are required to obtain an unemployment insurance (UI) reporting number from the California Employment Development Department (EDD). The EDD then assigns each employer or reporting unit a four-digit Standard Industrial Classification (SIC) or, since 2001, a six-digit North American Industry Classification System (NAICS) code that reflects the employer's major activity (US Census Bureau 2002). Major activities are grouped in increasing levels of detail; for example, agriculture, forestry and fisheries are classified as a major industrial sector and, within this sector, SIC 01 is assigned to crops, 017 to fruits and nuts and 0172 to grapes.
We defined “farmworkers” as unique Social Security numbers (SSNs) reported by farm employers to the EDD, and then summed their California jobs and earnings. This enabled us to answer questions such as how many farm and nonfarm jobs were associated with a particular SSN or individual in 1 year, and in which commodity or county a person had maximum earnings.
We adjusted the raw data before doing the analysis. Farm employers have reported their employees and earnings each quarter since 1978, when near-universal UI coverage was extended to agriculture. Although it is sometimes alleged that farm employers, especially FLCs, do not report all their workers or earnings, there is no evidence that underreporting of employees or earnings is more common in agriculture than in other industries that hire large numbers of seasonal workers, such as construction. We excluded from the analysis SSNs reported by 50 or more employers in 1 year (there were 602 such SSNs and 59,776 wage records [jobs] in 2001). We also excluded wage records or jobs that had less than $1 in earnings and jobs, or that reported earnings of more than $75,000 in one quarter. These adjustments eliminated from the analysis 2,750 SSNs, 62,571 wage records or jobs and $803 million in earnings. These exclusions were about 0.25%, 2.7% and 6.1% of the totals, respectively, and are documented more fully in Khan et al. (2003).
There is no single explanation for the outlier data we excluded. In some cases, several workers may share one SSN, while in others our suspicion that a SSN had “too many” jobs may represent data-entry errors.
During the 1990s, the Social Security Administration cleaned up SSNs, including threatening to fine and reject tax payments from employers with too many mismatches between SSNs and the names associated with those SSNs, which should have reduced the number of SSNs reported by employers. We think the rising number of SSNs reflects more individuals employed in agriculture, not more noise in the data.
Employees, jobs and earnings
Agricultural employment can be measured in three major ways: at a point in time, as an average over time or by counting the total number of individuals employed over some period of time. In the nonfarm labor market the three employment concepts yield similar results. If 100 workers are employed during each month and there is no worker turnover from month to month, then point in time, average and total employment is 100. However, agricultural employment during the six summer months may be 150, versus 50 during the six winter months, meaning that point, average and total employment counts differ.
We began with all SSNs reported by agricultural employers (SIC codes 01, 02 and 07), summed the jobs and earnings of these SSNs within each SIC code, and assigned each SSN to the four-digit SIC code in which the worker had the highest earnings. This means that a SSN reported by a grape employer (0172) as well as by an FLC (0176) would be considered a grape worker if his highest-earning job was in grapes.
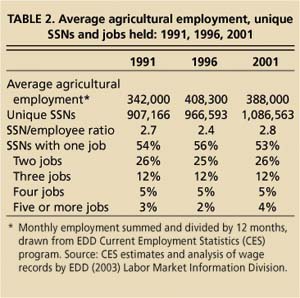
The number of individuals or unique SSNs reported by California agricultural employers has been stable over the past decade — 907,166 in 1991, 966,593 in 1996 and 1,086,563 in 2001 (table 2). However, average agricultural employment peaked in 1996 and then fell to 388,000, suggesting that more workers shared fewer jobs in 2001. (It is possible, but not likely, that the increased number of individual workers needed to produce the increased tonnage worked only outside the pay periods containing the 12th of each month in a given quarter. The 12th of the month is the pay period for which employers are asked to report employee numbers.) Farmworkers had a total of 1.5 million farm jobs in 1991, 1.7 million in 1996 and 1.8 million in 2001. One-quarter also had at least one nonfarm job — about 407,000 workers were both farm and nonfarmworkers in 1991,453,000 in 1996 and 697,000 in 2001 (table 3).

The total California earnings of persons employed in agriculture were $11.1 billion in 1991, $12.0 billion in 1996 and $15.8 billion in 2001 (all in 2001 dollars). (We converted earnings in 1991 and 1996 to 2001 earnings using the Employment Cost Index [ECI] for private industry in the western region, for wages and salaries only. We adjusted earnings using the ECI rather than the Consumer Price Index [CPI] because the ECI measures changes in the price of labor including wages and salaries, while the CPI measures changes in the price of goods and services. Because the ECI specifically measures wage changes, the U.S. Bureau of Labor Statistics [1997] strongly recommends using the ECI when converting nominal wages to real wages.) The share of total earnings for farmworkers from agricultural employers was 77% in 1991, 77% in 1996 and 71% in 2001, indicating that in the late 1990s, farmworkers tended to increase their supplemental earnings via nonagricultural jobs.
Average earnings per job were highest in livestock, $13,800 per job in 2001. There was little difference between average earnings per job in agricultural services ($5,500) and crops ($6,400). Average earnings per job were higher for the nonfarm jobs of agriculture workers ($6,600) than for agriculture jobs ($6,200).
Primary farmworkers and jobs
In 2001, California's farmworkers held 2.5 million jobs, including 1.8 million jobs with agricultural employers. These agricultural jobs included 630,000 in crops, 69,000 in livestock and 1.1 million in agricultural services. The agricultural services sector includes both farm and nonfarm activities, such as veterinary and lawn and garden services; FLCs accounted for 70% of the employees reported by farm agricultural services. Fruits and nuts accounted for 53% of the crop jobs, dairy for 39% of the livestock jobs and FLCs for 58% of the agricultural services jobs. The major change between 1991 and 2001 was the drop of 54,000 jobs in crop production and increase of 313,000 jobs in agricultural services.

We placed SSNs in the detailed commodity or SIC code that reflected the maximum reported earnings for the worker, and considered workers to be primarily employed in the SIC with maximum earnings. In 2001, there were 877,000 primary farmworkers, and they included 322,000 reported by crop employers, 50,000 reported by livestock employers and 504,000 reported by agricultural service employers. Fruit and nut employers accounted for 47% of the crop-reported workers, dairy for 40% of the livestock-reported workers and FLCs for 44% of the agricultural services-reported workers.
The major change between 1991 and 2001 was the increase in number of SSNs with their primary (highest earning) job in agriculture — from 758,000 to 877,000. There was a slight drop in the number of workers reported by crop employers, a slight increase in livestock workers and a sharp 135,000 increase in agricultural services workers, anchored by a 59,000 increase (to 226,000) in workers reported by FLCs in 2001.
Most farmworkers had only one job. In 2001, 53% of the SSNs were reported by only one employer to the EDD, 26% were reported twice, 12% three times, 5% four times and 4% five or more times. During the 1990s, about 65% of farmworkers (SSNs) were reported by one agricultural employer only, 17% to 21% by two agricultural employers, 5% by at least two agricultural employers and one nonfarm employer, and 9% to 12% by one farm and one nonfarm employer.
In the three-digit SIC codes representing more detailed commodity sectors, 60% to 83% of the employees had only one job. For example, in 2001 79% of the employees reported by dairy farms had one dairy farm job, while 7% also had a second agricultural job — 3% had a dairy job, a second farm job and a nonfarm job, and 11% had a nonfarm job in addition to the dairy job. About two-thirds of the employees of FLCs and farm management companies had only jobs with one such employer; 22% had another farm job; 6% had an FLC job, another farm job and a nonfarm job; and 6% had a nonfarm job in addition to the FLC job.
Even more detailed four-digit SIC codes showed the same pattern: the commodities or SICs most likely to offer year-round jobs such as dairies and mushrooms (food crops grown under cover) had 70% to 80% of employees working only in that commodity, while commodities or SICs offering more seasonal jobs, such as deciduous tree fruits and FLCs, had 53% to 63% of employees working only in that commodity. At the four-digit, SIC-code level, the five largest SICs (FLCs, ornamental nursery products, crop preparation services [custom harvesters], grape employers, and vegetable and melon employers) accounted for about 45% of the agricultural wages reported.
Earnings, estimates of hours worked
Agricultural employers (SIC 01, 02 and 07) paid a total of $11 billion in wages in 2001, an average of $10,200 per worker (table 3). Earnings were highest for the 64,000 workers primarily employed in livestock; they averaged $14,800, followed by those primarily employed by crop employers ($8,500) and those employed by agricultural farm services, custom harvesters and FLCs ($5,000). There was considerable variation in earnings among workers in agricultural farm services: workers in soil preparation services (SIC 0711) averaged $21,100 in 2001, versus $12,700 for crop preparation services for market (custom harvesters; SIC 0723) and $4,400 for FLC employees.
The average earnings of primarily farmworkers varied significantly, even within detailed four-digit SIC codes — in most cases, the standard deviation exceeded the mean wage (table 4). Median earnings were generally less than mean earnings, reflecting that higher-wage supervisors and farm managers pulled up the mean.
If the workers in detailed commodities are ranked from lowest-to-highest paid, the lowest 25% of earners in an SIC category generally earned less than $4,000 a year. For example, among workers primarily employed in vegetables and melons in 2001 (SIC 0161), the first quartile or 25th percentile of annual earnings was $3,000. This reflects relatively few hours of work — if these workers earned the state's minimum wage of $6.25 an hour in 2001, they worked 480 hours. The 25th percentile earnings cutoff was lowest for those employed primarily by FLCs, only $634, suggesting that FLC employees receiving the minimum wage worked 101 hours. The highest 25th percentile mark was in mushrooms (food grown under cover), $9,491, which reflects 1,519 hours at minimum wage.
The 75th percentile marks the highest earnings that a nonsupervisory worker could normally expect to achieve — 75% of workers reported earning less than this amount and 25% earned more. The 75th percentile varied widely by commodity: $6,172 for those primarily employed by FLCs, $10,572 for those in grapes and $29,465 for those in mushrooms.
More labor-intensive crops, jobs
The number of individuals and jobs reported by agricultural employers increased in the 1990s, reflecting increased production of labor-intensive fruit and vegetable crops and, the data suggests, more farmworkers each worked a fewer number of hours. With the state's minimum wage at $6.25 per hour after Jan. 1, 2001 (and $6.75 per hour since Jan. 1, 2002), the earnings reported by employers suggest that most farmworkers are employed fewer than 1,000 hours per year (about half-time).
FLCs increased their market share in the 1990s, but dependence on them varied by commodity. For example, FLCs rather than citrus growers reported many citrus workers, while dairy employers reported most dairy workers. FLCs are associated with low earnings, which suggests few hours of work — the median earnings reported by FLCs for their employees in 2001 were $2,650, or 400 hours if workers earned the state's $6.25 minimum wage.
California's farm labor market has large numbers of workers searching for seasonal jobs; FLCs are matching an increasing share of these workers with jobs, resulting in lower earnings for FLC employees. Workers who avoid FLCs experience higher earnings in agriculture or in the nonfarm labor market. If FLCs are most likely to hire recently arrived and unauthorized workers, as the National Agricultural Worker Survey (NAWS 2001) suggests, FLCs serve as a port of entry for immigrant farmworkers.
The impact of guest workers, legalization and earned legalization will depend on the details of any new program. If the status quo continues, the percentage of unauthorized workers is likely to rise. Alternatively, if there were a legalization program, farmworkers might more quickly exit the farm workforce. However, an earned legalization program could slow this exit if workers were required to continue working in agriculture to earn full legal status.
The next step in this analysis is to examine the mobility of individual farmworkers over time and geography, examining where workers migrate during 1 year and patterns of entrance to and exit from the farm workforce (Moore et al. 2002). Do farmworkers who increase their earnings by moving to nonfarm jobs stay in nonfarm jobs, or do they sometimes return to agriculture? Are geographic and economic mobility linked for workers who get nonfarm jobs? Answers to these questions will help to determine the trajectory of the farm labor market.
Expanded production of labor-intensive crops increases agricultural employment

