


All Issues
Looking back 60 years, California soils maintain overall chemical quality
Publication Information
California Agriculture 57(2):38-41. https://doi.org/10.3733/ca.v057n02p38
Published April 01, 2003
PDF | Citation | Permissions
Abstract
To learn whether soil properties important to production agriculture and environmental quality have changed significantly in the past half-century in California, we analyzed archival samples and samples collected in 2001 from the same locations. Comparisons of organic matter content, pH, electrical conductivity, total nitrogen, total carbon and plant-available phosphorus showed significant changes since the mid1900s. Across the state we found increases at the 95% confidence level for plant-available phosphorus, total carbon, pH, and percent clay, and increases at the 90% confidence level for percent silt and total nitrogen. We measured significant decreases at the 95% confidence level for electrical conductivity and percent sand. Based on this sample of 125 soils, we believe that California's soil chemical quality has not decreased significantly over the past 60 years. However, increased clay percentages may be interpreted as a sign of accelerated erosion, which is a sign of decreased soil quality.
Full text
Our goal was to assess how California's agricultural soils have changed during the past half century using laboratory analysis to measure soil quality indicators. In agricultural terms, soil quality is defined by the ability of the soil to sustain elevated yields of plant production. In an agricultural context, soil quality can be managed to maximize production without adverse environmental effects, while in a natural ecosystem, soil quality may be observed as a baseline value or a set of values against which future changes in the system may be compared (Singer and Ewing 2000)
The quality of California's soil chemistry has not declined significantly since the mid-20th century, although a greater proportion of clay indicates accelerated erosion.
We recovered 125 surface samples collected before 1959 by California's Natural Resources Conservation Service (NRCS) soil survey staff. The samples were taken in California's primary agricultural valleys: Sacramento, San Joaquin, Sonoma, Napa, Salinas and Imperial. In addition, soil samples collected in 1945 by UC Berkeley professor Hans Jenny, and archived at UC Berkeley and UC Davis were found. The two groups of archival samples presented an ideal opportunity to assess soil properties from 50 to 60 years ago. We refer to all these samples as the “1945” samples. The archival samples were collected as part of early investigations to determine the soil's agricultural potential and as part of soil surveys that were done by the University of California in cooperation with the USDA Soil Conservation Service. Samples were stored in closed glass bottles from the time of collection until we opened them. The samples were preserved because they represented widely distributed soil types at the time.
Using the known locations of the archival samples, we returned to the sites sampled by Jenny and the NRCS and took samples again in 2001. By combining landowner information, legal description, and soil survey mapping units, we were able to identify each site to within 40 acres from the old descriptions. Once on the site, using modern soil maps, we were able to find what appeared to be the same general location as the original sample site. In the field, we collected three surface samples at a 0-to-10-inch (0-to-25 cm) depth from the site and noted the current land use.
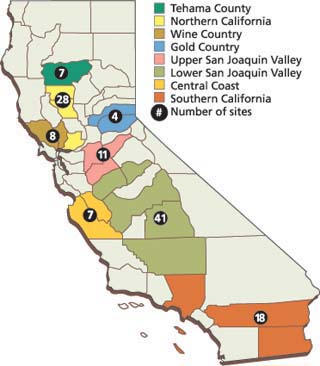
We combined counties that shared land-use practices and environmental conditions into larger geographic regions (fig. 1). Samples were air-dried prior to determining pH using a 1:1 soil-water ratio with a 20-gram subsample of soil. Electrical conductivity was measured on the solution from the pH measurements. We used 20-milligram subsamples to measure both total carbon (C) and total nitrogen N on a CarloErba gas analyzer. Soluble phosphorus (P) as an indicator of plant-available P was measured using the Olsen and Sommers (1982) method. We measured particle size distribution using a Coulter LS230 particle size analyzer.
We statistically analyzed data from the entire state, as well as by land use and geographic location using JMP 4.0 statistical software. Parametric t-tests were used to compare 1945 and 2001 values. The four land uses evaluated were tree crops such as almonds, walnuts and apples (25 sites); row crops (44 sites); rangeland (48 sites), and viticulture (8 sites). These statistics are the most effective way of demonstrating changes in soil quality since they evaluate change that has occurred at each site based on its 1945 state.
Changes in properties
pH levels
The average pH in 1945 for the 125 sites was 6.87, compared to 7.10 in 2001 (fig. 2). Across all sample locations, the increase in pH was significant at t < 0.01. Stratification of the data by location indicates a significant increase in pH in Southern California, the lower San Joaquin Valley, the Central Coast and Gold Country. No change was found in the upper San Joaquin Valley. When stratified by crops, pH increased significantly only in row crops.
Electrical conductivity
The average electrical conductivity (EC) for all the samples in this study was 0.85 deciSiemens/meter (dS/m) in 1945 and decreased significantly to 0.44 dS/m in 2001. Regionally, decreases in EC were limited to the 90% confidence interval but were found in all regions. Among the regions, only the EC in the Central Coast had a significant decrease at t < 0.01. The EC increased in soils being used for viticulture but decreased in row crops with no apparent change in pasture and tree crops (fig. 3).
Phosphorus
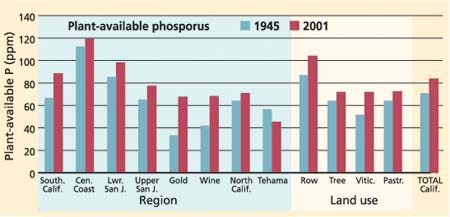
The statewide plant-available phosphorus average of 71.8 ppm in 1945 increased to 84.6 ppm in 2001. When geographical regions were considered, the lower San Joaquin Valley had significant increases in plant-available phosphorus, as did Southern California and Wine Country. The upper San Joaquin Valley, Northern California and Gold Country did not have significant changes in plant-available phosphorus. When land use is considered, significant increases in plant-available phosphorus levels were found in tree crops, row crops and viticulture (t < 0.1) (fig. 4).
Nitrogen and carbon
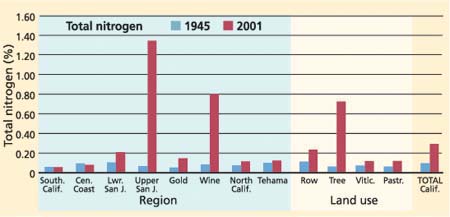
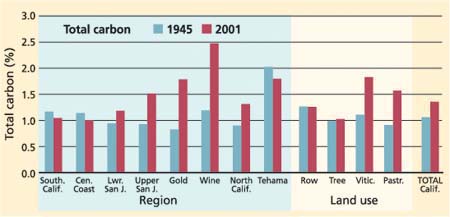
Total nitrogen and total carbon also increased significantly statewide, with total nitrogen at 0.09% in 1945 and 0.29% in 2001 (fig. 5). Total carbon increased from 1.06% in 1945, to 1.34% in 2001 (fig. 6). There were no significant changes in the carbon-to-nitrogen ratio with a mean of 11.48 found in the 1945 samples and 12.63 in 2001. However the range of the carbon-to-nitrogen ratio decreased between 1945 and 2001. Total carbon percentages increased significantly in all regions except Southern California, the Central Coast, Gold Country and Tehama County (fig. 6). Total nitrogen increased in the Northern California, the upper San Joaquin Valley and Gold Country regions. Carbon and nitrogen significantly increased in pasturelands. Nitrogen but not carbon increased significantly in tree cropping systems (t < 0.1).
Clay, silt and sand
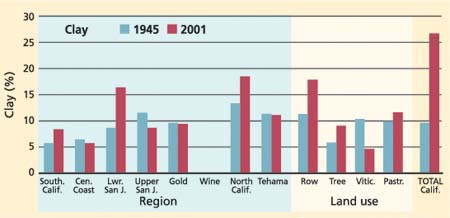
Clay percentages increased from 10% to 27% (fig. 7) and silt percentages increased from 50% to 55% while sand percentages decreased from 40% to 30% statewide. The laser grannulometer used to measure particle-size distribution underestimates clay percentages and overestimates sand percentages, but because the same method of analysis was used on both the 1945 and 2001 samples, we feel that the relative change is meaningful. Clay increases were found across the state in Northern California, lower San Joaquin Valley and Southern California (t < 0.05). Silt increases were significant in the lower San Joaquin Valley while decreases in sand percentages were found in the lower San Joaquin Valley, as well as in Southern California. No statistically significant changes in clay content were found in either Gold Country or Wine Country. Silt content increased significantly in Southern California and the lower San Joaquin Valley. Clay percentages significantly increased with reciprocal decreases in sand percentages in row crop, range and viticulture systems. Silt content increased significantly in row crops.


Has soil quality changed?
The scientific community, as well as regulators and the general public, has recently raised concerns that human uses of soil may be unsustainable, and that soil quality may be declining (Fournier 1989; Doran et al. 1996). Parr et al. (1992) state that “soil degradation is the single most destructive force diminishing the world's soil resources base.” Within the last decade, inventories of soil productive capacity indicate severe degradation on more then 10% of the world's vegetated land as a result of soil erosion, atmospheric pollution, excessive tillage, over-grazing, land clearing, salinization and desertification (Lal 1994; Sanders 1992). However, there is continued controversy over the definition and methods used to evaluate soil quality. We discuss our results as they relate to changes in each individual measure of soil quality
Soil pH
Based on soil survey classifications of pH levels (Soil Survey Staff 1993), any change in category away from neutral (a reading either more or less than 7.0) can be viewed as a negative change in soil quality. Based on this interpretation, 25% of the sites had positive changes in pH, in the sense that the pH became more favorable by moving closer to neutral or 7.0. Another 43% had negative changes, becoming less favorable by moving farther away from 7.0, either becoming more acidic or more basic, and 28% showed no change. Soil pH is not much of a concern to plant growth when it is within the range of 5.5 to 8.2, but it becomes a management concern when it is outside of this range (Singer and Munns 2002). The results of this study suggest that pH changes do not indicate a change toward either extreme acidification or sodification (sodium increase) of the soils studied. No doubt there are unsampled areas within California where acidification or sodification have reduced plant nutrient availability, where aluminum and manganese toxicity limit plant growth, or where exchangeable sodium negatively impacts soil physical properties and water management. However, based on the results of this study, no trend in pH change was found that could be interpreted to indicate a statewide change in soil quality. Although 68% of samples showed some change, the changes were within the acceptable range for plant growth so they should not be construed as problems. (It is unlikely that pH in the range found will be managed using chemical amendments.)
Salinity
Soil salinity is a major constraint to plant production in arid and semiarid regions of the world (Tanji 1990). Salinization is indicated by an increase in electrical conductivity. Electrical conductivity classes are clearly identified in the Soil Survey Manual (Soil Survey Staff 1993). Based on these values, 87% of the sites were nonsaline to begin with, and remained nonsaline. Nine soils were very slightly saline to moderately saline in 1945, and became nonsaline by 2001. Four percent of the sites were nonsaline in 1945 but became very slightly saline to slightly saline by 2001. This soil quality parameter indicates a small improvement in soil quality over the sampling interval. We note that approximately 4.5 million acres of California's irrigated croplands—primarily on the west side of the San Joaquin Valley—are known to be affected by saline soils or saline irrigation water, with salinization increasing at a debatable rate. However, these areas are a relatively small percentage of the state's 100 million acres in total, and salinization in these soils may be underrepresented in our sampling. Even with new salinization problems, the total area of saline soils in California is likely to be less now than it was in 1945 and much less than in 1900, because many acres were drained, amended and improved for agriculture during the twentieth century.
Phosphorus
Twenty percent of the sampled soils exhibited decreases in plant-available phosphorus, 39% showed no change and 41% showed an increase. Phosphorus is an essential element that is used in large quantities by plants and it is a major component in most fertilizer. It comes as no surprise that the intense agriculture found in California has led to increases in plant-available phosphorus in the soils tested, due to the routine application of phosphorus-based fertilizer in agricultural regions. Does this indicate a change in soil quality? For those in conventional agriculture who view mineral fertilizer favorably, the increase in plant-available phosphorus can be interpreted as beneficial. For those who advocate against the use of mineral fertilizer, an increase in plant-available phosphorus might be interpreted as the presence of extra pollution and a decrease in soil quality. We interpret the changes to indicate no significant decline in soil quality.
Organic matter
Soil organic matter (SOM) contributes to soil fertility, aggregate stability and susceptibility to erosion (Seybold et al. 1998). The largest changes in total carbon were in the Wine Country and the Gold Country. Overall, the change from 1.05% to 1.35% total carbon in California is larger than we expected. This may reflect sample variability as well as a real increase in total carbon due to the return of crop residues to the soil. We interpret the increased carbon and nitrogen found in 2001 compared to 1945 as a statewide increase in soil quality.
Texture
Texture is important in the retention and transport of water and chemicals (Seybold et al. 1998; Arshad and Coen 1992). In turn, crop yield frequently is directly related to the amount of available soil water. Soil texture and the amount and type of clay minerals and organic matter are the major factors affecting cation (positively charged ion) exchange capacity (Arshad and Coen 1992). Texture usually changes little with use, and is considered to be use-invariant (Grossman et al. 2001). Soils with relatively high clay contents tend to stabilize and retain more organic matter than those with low clay contents, possibly indicating an increase in soil quality. However, why would a variable that is usually considered time invariant, such as texture, change so dramatically over the past 50 years? Two explanations are possible. First the increased clay percentage is an indicator of soil erosion as the surface soil layer (A horizon) is lost, and the clay-rich subsoil (B horizon) becomes incorporated into the surface horizons. Second, clay particles are less susceptible to erosion due to their ability to form more stable aggregates, leaving the clay behind as more erodible fractions are removed. In either case, the increased clay percentages may be interpreted as a sign of accelerated soil erosion, a decrease in soil quality. In dense clay-rich subsoil, both water and root penetration decrease.
For purposes of this study, we conclude that most of the properties we have measured do not indicate a loss of soil quality in California. The properties measured representing soil fertility have changed positively. Carbon, which is of growing interest and concern has increased overall. Clearly, the small sample we used to measure changes cannot represent all the soils in the entire 43 million agricultural acres (including grazing land of about 45 million acres, irrigated farmland of about 10 million acres) of California. There may be unsampled areas where soil quality has declined, due to increased salt and sodium (e.g. the west side of the San Joaquin Valley and the Imperial Valley), decreased organic matter or pollution from excessive application of chemicals or inadvertent spills. While increased clay percentages may indicate accelerated soil erosion, we conclude that the soils of California have maintained their chemical quality over the past 50 to 60 years.
Looking back 60 years, California soils maintain overall chemical quality

