


All Issues
Global climate change will affect: air, water in California
Publication Information
California Agriculture 56(3):89-96. https://doi.org/10.3733/ca.v056n03p89
Published May 01, 2002
PDF | Citation | Permissions
Abstract
As we enter the 21st century, it is possible to reach beyond the headlines to describe what is now known about climate change. The Intergovernmental Panel on Climate Change evaluated the scientific aspects of global climate change; the current consensus is described in a recent series of reports. Since the 19th century, concentrations of atmospheric carbon dioxide, methane, nitrous oxide and sulfate aerosol dust have increased significantly. While there is scientific agreement that warming is occurring, the controversy now concerns the extent of subsequent impacts in the future. In California, the impacts of global warming are likely to include reduced water availability and quality, poorer air quality, associated economic consequences, biodiversity shifts and health effects. The changes are expected to continue at an increasing pace well into the next century, perhaps outstripping our scientific, economic and social ability to cope with them.
Full text
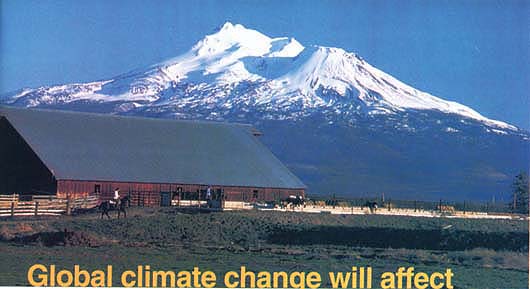
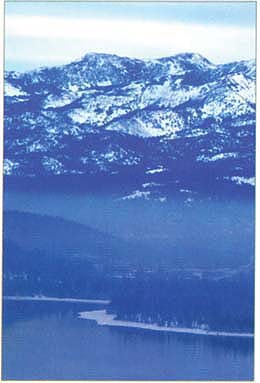
In its most recent rep the United Nations’ Intergovernmental Panel on Climate Change concurred that global warming is under way large part due to human activities such as burning fossil fuels. By 2050, the snow lines of mountains such as Shasta could go up by much as 1,000 feet, reducing summer water availability and increasing the risk of winter flooding.
During the past century, perhaps the most controversial subject in atmospheric science has been the question of whether humans are having a significant impact on climate. Anyone who picks up a newspaper is familiar with conjectures that within this century, average temperatures will be 5°F, 10°F or 15°F above their current values, precipitation patterns will substantially decrease the water available for agriculture, and a rise in the sea level will flood coastal regions. As we enter the 21st century, it is now possible to reach beyond the headlines and the controversies to describe what is known about climate change in the recent past and what is most likely for the future. It is also possible to summarize the likely consequences of global climate change for California and the southwestern United States.
The scientific aspects of global climate change have been evaluated recently in a set of extensive reports by the Intergovernmental Panel on Climate Change (IPCC), which were released over several months leading up to a synthesis report (Watson et al. 2001). These reports, compiled by a panel of hundreds of atmospheric scientists from around the world under the umbrella of the United Nations, describe the current consensus concerning the science of global climate change. This article emphasizes those factors that influence and are influenced by agriculture and forestry in the western United States.
Few scientists dispute that human activity is causing the atmospheric concentrations of greenhouse gases and particles to increase, and that this, in turn, is leading to global climate change. From about 1900 to the present, concentrations of atmospheric carbon dioxide (CO2), methane (CH4) and nitrous oxide (N2O) have increased substantially (fig. 1). The estimates of concentrations before the 20th century are derived mainly from analyses of air trapped in the ice of large glaciers; the more recent values are from well-calibrated direct observations. The concentrations of all three gases were relatively constant until the late 19th century. Since then, the numbers have risen dramatically. The rise in the carbon dioxide concentrations is closely tied to the burning of fossil fuels. Interestingly, only about half of the fossil fuel-related carbon dioxide released into the atmosphere has remained there. The other half has been deposited primarily into the deep oceans and terrestrial biomass — forests and soil humus. The increasing concentrations of methane are believed to be largely related to natural gas drilling and distribution activities, feedlot emissions and decomposition in landfills and rice fields. Increases in nitrous oxides are related to agriculture, industrial activities and livestock waste management.

Fig. 1. Estimates of atmospheric concentrations of four human-produced materials that can influence climate. Different-shaped symbols or lines indicate values from different measurement systems. Source: Houghton et al. 2001, p. 6.
Concentrations of sulfate aerosol dust (SO4) have also increased. These particles are primarily the result of large volcanic eruptions and the burning of fossil fuels, mainly soft coal. The aerosol estimates are derived from analyses of materials in Greenland ice cores and probably represent the higher latitude Northern Hemisphere, rather than the global variations, since aerosols tend to fall from the atmosphere within a few days of their emission. Sulfate concentrations appear to have peaked in the middle of the 20th century (fig. 1). This is believed to be the result of environmental regulations, which limited emissions of sulfur dioxide (the chemical precursor of sulfate) from the burning of coal and oil.
There is little scientific controversy that these changes are having an impact on the global climate. In general, the temperature of the Earth-atmosphere system remains relatively constant because the amount of trapped sunlight is offset by a nearly equal amount of heat being lost into deep space (fig. 2). Climate change will occur if, over years or decades, either the amount of trapped sunlight or emitted heat changes. The amount of absorbed sunlight can decrease for a variety of reasons, including an increase in cloud cover, the replacement of a dark surface such as asphalt by light materials like concrete, and an increase in snow cover. In addition, increases in sulfate aerosols (dust) lead to more sunlight being reflected back to space and less solar heating. Under conditions of increased sulfate, if all other things remain constant, the Earth-atmosphere temperature should decrease.
In contrast, carbon dioxide, methane and nitrous oxide reduce the loss of heat into outer space. All of these gases absorb heat as it leaves the relatively hot surface of the Earth and heads to space through the atmosphere. Once one of these molecules absorbs a tiny portion of heat, it must release it almost immediately. This release occurs in all directions, so that part of the heat, which was originally traveling upward out of the atmosphere, is redirected back down to the ground. This means that less heat escapes to outer space and more heat heads toward the Earth, increasing surface temperatures. There is virtually no controversy over these phenomena, or that the increases in certain gas concentrations are having an effect on the Earth's climate.
Observing climate change
Over the last century, several key measures of global climate have changed significantly — also facts few scientists dispute (table 1). Clearly the most discussed change is the rise in global surface temperature (fig. 3). These data strongly suggest a shift around the turn of the 20th century, a time of rapid growth in gasoline-consuming cars and trucks and the expansion of electrical networks fueled primarily by coal. Despite the considerable uncertainties in the temperatures of the past, it now seems clear that recent global mean temperatures are at least 1°F higher than any that have been observed in the past 1,000 years.
Changes other than in global surface temperature are also important. Many individuals care most about the changes closest to home. The left panels of figure 4 show the estimated temperature and precipitation changes in the southwestern United States in the past century. The temperature increases for the western United States are larger than those of the globe. There is also good evidence to suggest that these mean temperature increases are largely due to increases in nighttime low temperatures rather than daytime highs. The pattern for regional precipitation changes is more mixed: Some areas are up and some down, as is true for the Earth as a whole. However, there is reliable evidence that the frequency of extreme precipitation events — floods and droughts — is increasing, in part due to the increased intensity of both El Niño (generally bringing greater rainfall to California) and La Niñoa (often associated with drier periods in California) events.

Fig. 2. Interactions of sunlight (yellow) and heat (green) with aerosols (clouds and dust) and gases (water, carbon dioxide and others) in the atmosphere.
These findings are relatively non-controversial. However, important discussions continue as to the magnitude of the change. The measurements shown in figures 3 and 5 were taken at weather stations that are irregularly spaced around the globe. The oceans, for example, are relatively poorly sampled. It is also well known that station temperatures may be influenced by the “urban heat island” effect, by which temperatures taken in cities are higher than those in nearby rural areas. (Warmer urban areas are primarily the result of waste heat from buildings and the lack of the cooling effect of vegetation.) Finally, there is concern that “surface” temperature measurements made from satellite instruments, which sample the whole Earth, do not in their relatively short records show changes as large as those of the station data.
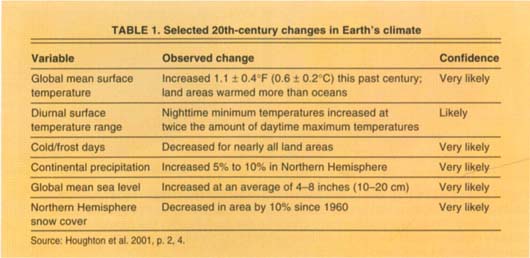
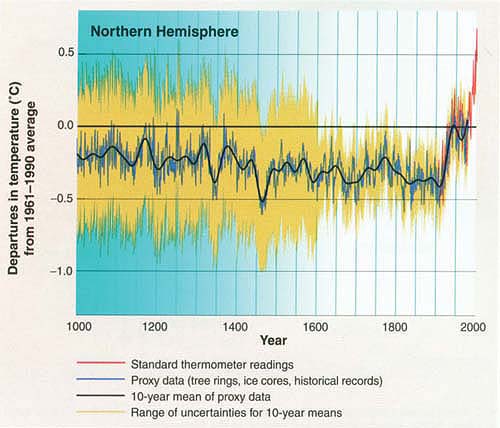
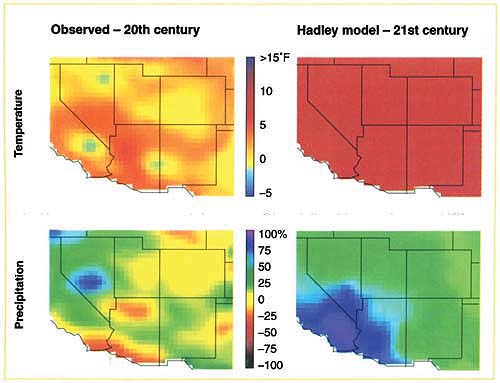
Fig. 4. Temperature (°F) and precipitation (%) changes from 1961-1990 means over western United States. Observed changes are for approximately 100 years of the 20th century. Predicted 21st-century changes are from British Meteorological Office's Hadley model, based on middle-range IPCC “greenhouse” gas assumptions. Source: NAST 2000, p. 65.
The criticisms of the station data have been carefully investigated and addressed. For example, stations with a heat island signature have been excluded from summaries discussed in this paper, such as those in figure 3. The satellite data are also subject to criticism. Some scientists have noted that they are created not from the measurements of a single satellite, but from about a dozen satellites, each of which falls slowly toward the Earth. As a result, daily temperature samples are made at different times of day, in one year when it is relatively warm and another when it is relatively cool. This problem has also been addressed, but some controversy remains with respect to both the surface and satellite data.
Predicting climate change
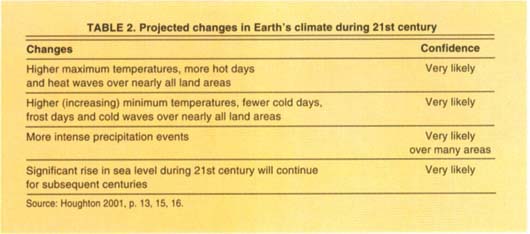
The main scientific controversies regarding the climate concern predictions for the future. The basic methodology for making these predictions is to combine social-economic estimates of fossil fuel usage, farming practices and pollution control with sophisticated computer models of the weather. The social-economic estimates are cast in terms of “scenarios,” forecasts based on different economic projections and social constraints, such as global legislation that limits the release of carbon dioxide to some fraction of a baseline level. Although there are substantial differences in these scenarios, they do not affect the ultimate temperature change projection as much as they influence the expected decade during the next century when a particular change is likely to occur (table 2).
The economically and politically based scenarios are translated into climate change predictions using global climate models. These state-of-the-art computer models are the outgrowth of weather forecast models, which are used to make regular forecasts 1 to 10 days into the future. These models divide the atmosphere into three-dimensional grids that are generally between 50 and 150 miles east-west and north-south, and as much as a few thousand feet in elevation. The models mathematically solve the basic laws of physics — which describe the interaction of grid mean temperature, humidity and winds — and carefully tested approximations of “subgrid scale” processes that occur in small spatial regions — which are much smaller than the model grids in even the most sophisticated global model. An example of this is interactions with clouds, which are almost always smaller than the grids of even the most sophisticated weather models, but which also are vitally important for determining the amount of sunlight heating the ground or precipitation reaching a crop. Most recent climate models also include submodels of the oceans and high-latitude glaciers.
All of the relevant equations are projected from an initial known condition into the future, in intervals of a few minutes or less. These simulations are regulated or “forced” by climatic factors like the amount of sun at the top of the atmosphere, the chemical composition of the atmosphere and the physical properties of the land surfaces and ocean. (This simulation process is something like an income tax program in which your income is the forcing and the tax rules are the laws of atmospheric and ocean physics.) This process creates pictures of day-to-day weather a month or a year or decades into the future; from this, mean temperatures and other meteorological variables can be created.
How good are these models? The weather-forecasting models, which underlie these climate models, have been carefully evaluated for decades. In general, despite occasional ridicule on late-night talk shows, these models very accurately predict regional temperatures about a week in advance; they perform less well for regional precipitation. The quality of forecasts decreases somewhat if one focuses down to a specific locale, which is much smaller than the model grid. Winter forecasts tend to be slightly better than summer.
Uncertainties with models
The uncertainties associated with climate predictions fall largely into two basic categories. First, there are complex climate feedbacks — interactions that can either amplify or diminish an initial tendency. For example, an increase in surface temperature due to increasing carbon dioxide concentrations in the atmosphere might lead to more and thicker clouds, which would reflect more sunlight back to space and cool the Earth's surface. Another feedback occurs when warmer temperatures reduce the amount of snow and ice at the Earth's surface, which in turn diminishes the amount of sun reflected to space, leading to additional warming. Although many such feedbacks are known to exist, none seem to have the possibility of changing an initial warming to a cooling or vice versa. However, they can substantially alter the magnitude of the temperature change. In nearly all models, the primary effect of a doubling of current carbon dioxide concentrations is a gradual increase in global average temperature of about a 2°F, whereas the cumulative effect, including all of the feedbacks, is typically between 5°F and 10°F. Understanding and correctly modeling feedbacks is critical to making reliable forecasts.
The second set of uncertainties is related to the problem scientists encounter in trying to gauge longer-term climate shifts in a system in which weather and climate are always naturally changing. How can we know whether or not an observed change over 10 years, for example, is due to outside factors such as human activities or to natural variability over dozens or hundreds of years? The way scientists usually try to deal with this question is by identifying as many features of natural variability as possible. Those factors are then included in the computer models, which are then forced with and without these variations plus those thought to be due to humans.
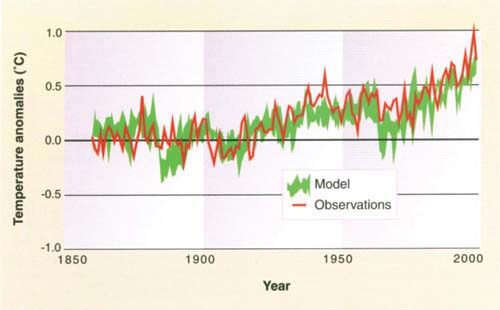
Fig. 5. Observed and modeled Northern Hemisphere surface temperature changes. Observations are by standard thermometer readings (see fig. 3). Model is average predicted value of British Meteorological Office's Hadley climate model, based on combination of natural and human-induced climate change forcing mechanisms. Source: Houghton et al. 2001, p. 11.
Hadley model shows dramatic change
The British Meteorological Office's Hadley global climate model has been used to reproduce surface temperatures for the past 140 years. The variations in the Hadley model are forced by the internal weather variability in the model plus a combination of natural and human-induced factors (fig. 5). The natural factors include the estimated amounts of dust inserted into the atmosphere following the strongest volcanoes and the estimates of changes in solar output associated with the 11-year sunspot cycle. The human factors include the effects of added carbon dioxide, nitrous oxide, methane and sulfate. Also included are variations in chlorofluorocarbons (CFCs/freon), which absorb heat and have a large influence on the amount of stratospheric ozone, which absorbs sunlight. Not only can this model reproduce all of the major changes in 10-year mean global temperatures over this time period, but it can also accurately simulate the magnitude of the year-to-year variability. Overall, the model shows that the human-related modifications to climate account for by far the largest part of the recent dramatic changes. These results are especially compelling when one notes that this model was run day by day for each point of the Earth starting in about 1860.
Other models
Many other models have been developed that give similar, but sometimes less conclusive results. In general, climate models are most accurate in replicating changes in global and hemispheric temperatures. They do slightly less well for regional (such as the southwestern United States) temperature and hemispheric precipitation. They do even less well for regional-scale cloudiness and precipitation. They probably have little value in predicting changes for individual weather stations or locales.
A number of models have been used to continue the forecasts from 2000 to 2100 using the best estimates of the likely human-induced forcing. These model predictions of temperature, precipitation and other meteorological variables are the basis for not only the assessments of likely climate change, but also of the potential impacts on agriculture, ecology, human health and global economies. The evidence for a moderate temperature increase in the western United States is strong, while there is a mixed picture for the expected precipitation changes (fig. 4).
Temperature
The global temperature change over the next 100 years, calculated by the Hadley model using a climate forcing near the middle of the range of the “realistic” social and economic projections, is about 7°F (4°C)(fig. 4). The IPCC report characterizes this general result as “very likely.” The authors add that, "The possibility of abrupt and irreversible changes in the climate system exists." This statement is based on the forecasts from a number of climate models utilizing various “reasonable” economic and regulatory scenarios (Houghton et al. 2001).
Clearly, temperatures are predicted to increase substantially everywhere in the Southwest. Globally, the largest increased temperature would be in the Arctic region and the smallest changes over the tropical oceans and the Southern Hemisphere. For the United States, the changes are in the range of 7°F to 9°F (4°C to 5°C) and are relatively uniform over the continental United States, and between summer and winter. These changes will be primarily due to relatively large increases in nighttime low temperatures and smaller increases in daytime high temperatures.

Fig. 6. Estimate of how much snow lines in Pacific Northwest are likely to shift by 2050, assuming about 4°F regional warming. Source: NAST 2000, p. 97.

As a result of global warming, sea levels are expected to rise an average of 1 foot in the next century, resulting in the direct loss of valuable coastal farmland. In Santa Cruz County, broccoli is cultivated along the coast near Pigeon Point lighthouse.
Precipitation
The patterns of precipitation change are more complicated. The Hadley model predicts substantial increases in precipitation in the Southwest, especially in Southern California. Globally, most models suggest that the Arctic region and the equatorial zones will be wetter, and the subtropics drier. However, there are a relatively large number of zones in which the seasonal changes are inconsistently predicted by different models. Overall, the United States is expected to be slightly wetter than today, especially in winter. This is partially due to the expected increased frequency of El Niño events in the equatorial Pacific and their influence on winter precipitation in both the western and southeastern parts of the country. Other analyses suggest that summer soil moisture will be less than today because greater drying associated with higher temperatures and lower cloud cover will more than offset the slightly greater precipitation.
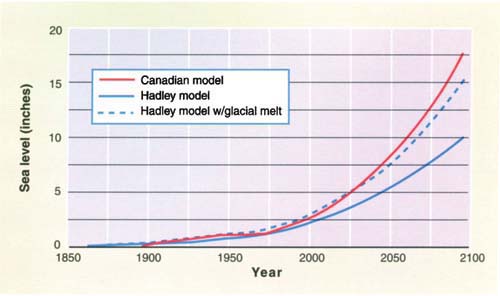
Fig. 7. Projections of sea level rise using the Canadian Climate Center and British Meteorological Office's Hadley global climate models. Solid lines represent changes directly due to increased ocean temperatures; dashed lines add influence of partial melting of Greenland. Estimates to about 2000 are in general agreement with observations. Source: NAST 2000, p. 112.
Consequences for California
Water availability
What do these and other “forecasts” mean for agriculture in California? The most important factor is related to water availability during the summer. A key aspect of the overall higher temperatures will be a dramatic increase in the mean snow line accompanying winter storms (fig. 6). Because of the roughly conical shape of most mountains, a relatively small rise in the snow line will dramatically reduce the area covered by snow and the associated water storage. This will not only lead to more runoff and heightened chances of winter flooding, but also to reductions in the water supplies from reservoirs that are available for irrigation and other uses in summer. This summertime reduction will be due to two factors: the decreased storage of water in the snowpack and the requirement that reservoirs be kept at relatively low levels throughout most of the winter to reduce the chance of flooding. Furthermore, this reduced irrigation water availability will coincide with a greater likelihood that water will evaporate more readily from irrigated fields.
Water quality
Another result of the predicted warming will be a reduction in water quality in a number of regions of the West. Mean sea levels are expected to rise about 1 foot, mainly due to heating of the ocean surface (fig. 7). Warm water occupies a slightly larger volume than an equal mass of cold water. These higher sea levels could lead to increased saltwater intrusions in the Sacramento Delta and well water in coastal plains. Furthermore, the higher sea levels could readily result in the direct loss of valuable low-lying farmland because of flooding.
Air pollution
Increased surface temperatures will likely be associated with more incidents of extreme air pollution. An increase in temperature of about 9°F (5°C) will lead to as much as double the typical maximum daily ozone concentration (fig. 8). The reasons for this are quite well understood. The burning of fossil fuel, largely from cars and trucks, produces the precursors of ozone. These undergo chemical reactions, which require sunlight and generally proceed faster at higher temperatures. Clear, hot days tend to produce more ozone for a particular quantity of direct pollutants. Also, in the West, hot summer days are often associated with evening thermal inversions — temperatures that increase with height — which leads to a trapping of the pollutants. This in turn results in higher concentrations of pollutants near the ground.
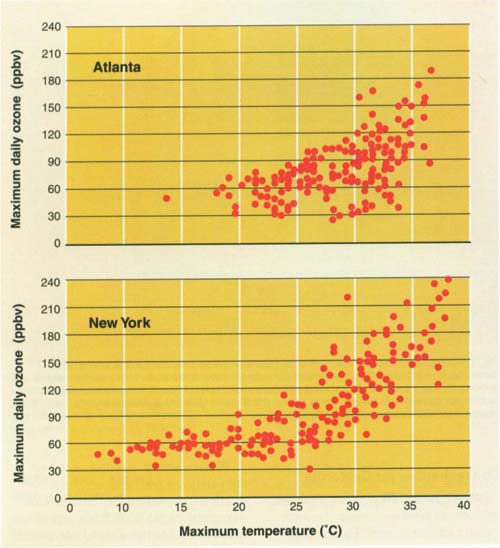
Fig. 8. Associations between observed ground-level maximum daily ozone concentrations (parts per billion by volume) and temperature for Atlanta and New York. Source: NAST 2000, p. 104.
Other impacts
There are many more possible impacts of global climate and environmental changes. These include crop yield fluctuations and associated economic consequences, biodiversity shifts and health effects related to extreme weather events. Of course, not all aspects of global change are necessarily bad for California and the West. Increased atmospheric carbon dioxide concentrations are expected to enhance crop and forest growth. However, recent studies suggest that this enhancement may be quite temporary unless increased amounts of fertilizer and adequate irrigation are applied.
Coping with climate change
Regardless of the consequences, we know that relatively large global and regional climate changes have been occurring. Our best scientific evidence strongly suggests that an important component of these changes is due to human activity. Furthermore, evidence indicates that the changes will continue at an increasing pace well into the next century. The rate of those changes may well outstrip our scientific, economic and social ability to effectively cope. It is important for all Californians to understand the causes of those changes, their likely implications and the nature of possible remediation.
Increased temperatures will result in the production of more ozone-related smog. Air pollution from wood smoke is already a significant problem at Donner Lake, near Truckee.
Global climate change will affect: air, water in California

