


All Issues
Survey identifies sediment sources in North Coast rangelands
Publication Information
California Agriculture 55(4):32-38. https://doi.org/10.3733/ca.v055n04p32
Published July 01, 2001
PDF | Citation | Permissions
Abstract
We conducted a sediment source survey to gain insight into soil erosion on Northern California rangeland watersheds and to provide information to facilitate informed land-use management, conservation prioritization and water-quality regulation decisions. The results indicate that by focusing on erosion associated with natural and historical influences, inventory and assessment efforts on these watersheds can characterize the majority of sediment deliverable to streams. While this volume of sediment does not require mitigation under current water-quality regulations, it none-theless prohibits the ability of instream sediment monitoring to detect water-quality changes. Water-quality regulations require managers to create inventories for all sources with 10 cubic yards or more of potentially deliverable sediment. If a monitoring threshold of 100 cubic yards was used, more than 99% of the deliverable sediment identified in this survey would be inventoried. This would require developing inventories for only 82 of the 117 sites in this study. Overall, we determined that rangeland managers can achieve the greatest reductions in sediment generation by focusing on erosion from roads.
Full text
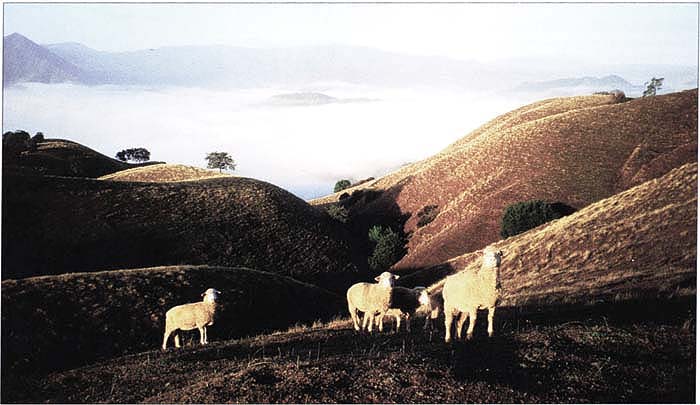
To protect water quality, many ranchers on California's North Coast are required to evaluate and mitigate the potential for delivery of sediment to streams on their property. Sheep graze on an oak woodland slope in the Russian River watershed.
Total maximum daily loads (TMDLs) for sediment are being established for Northern California watersheds. These water-quality standards will require agricultural landowners to inventory, monitor and control management-caused erosion on their properties (EPA 1998; SWRCB 2001).
Twenty-four Northern California rivers are on the federal Clean Water Act (CWA) Section 303(d) list of impaired water bodies because of excessive sediment from erosion, which results in impacts for salmon habitat. Land-use management, including silviculture, development and agriculture, has been identified as a source of sediment in these watersheds (NCRWQCB 1998a; EPA 1998). For each listed watershed, the U.S. Environmental Protection Agency (EPA) and the North Coast Regional Water Quality Control Board (NCRWQCB) are developing and implementing TMDLs as required by the Clean Water Act.
The first of these, the Garcia River TMDL, was initially drafted in 1998. Completion of all 24 TMDLs is scheduled for December 2011 with approval of the Russian River TMDL.
(Frequent updates on the status of TMDLs are at www.swrcb.ca.gov/tmdl/303d_lists.html.)
By definition, a TMDL is the quantity of a pollutant that can be added to a water body on a daily basis by all sources in the watershed and still allow for beneficial uses, such as habitat for aquatic species, recreation and drinking water. Each identifiable “point source” on the watershed (factory, sewage treatment plant and so on) is allocated a portion of the total daily contribution. For “non-point-source” pollution (road drainage, agricultural runoff and forestry practices) where natural levels and contributions by individual sources are often unknown, it is difficult to set a TMDL according to this definition. As a result, non-point-source pollution TMDLs are more often designed as watershed-scale strategies for establishing water-quality goals and implementing land-use management directives.
For example, the TMDL for the Garcia River (which runs from west of Cloverdale to north of Point Arena) calls for the reduction of “sediment delivery sites” instead of setting a daily loading standard (NCRWQCB 1998a). When approved, the Garcia River TMDL will be effective for 40 years. To comply with this TMDL, landowners “are required to inventory the sediment delivery sites on their property” and are “then directed to reduce the controllable volume of sediment.” Sediment delivery sites are erosion features such as a gully below a road culvert, an eroding stream bank, or a livestock corral where eroded sediment can be transported to a stream. Cost estimates for similar inventories conducted by consultants can be as much as $50 per acre, not including control measure installation expenses.
Landowners needed simple methods and tools to inventory sediment delivery sites for compliance with sediment TMDLs, and more importantly for the identification and prioritization of on-the-ground erosion control measures. Sediment Delivery Inventory and Monitoring: A Method for Water Quality Management in Rangeland Watersheds was developed in collaboration with North Coast agricultural landowners and staff from the California Farm Bureau Federation, the Natural Resource Conservation Service, NCRWQCB and UC Cooperative Extension (UCCE) (Lewis et al. 2000).
This method builds on the successful models of previous soil and water conservation efforts, which documented the value of capitalizing on landowner knowledge of soil erosion to facilitate conservation planning and implementation (Pretty and Shah 1997; Critchley et al. 1994). The method is listed in existing North Coast sediment TMDLs as compliant with inventory requirements for sediment delivery sites (NCRWQCB 1998a, 1998b). Since its introduction in 1998, we have trained more than 250 private agricultural landowners in Northern California in its use, including landowners from the Bear, Eel, Garcia, Mattole, Navarro, Redwood Creek and Van Duzen river watersheds.
The sediment survey
In 1999 we used this sediment inventory method to survey 10 representative North Coast ranches. Our objective was to provide information about sediment delivery sites located on North Coast rangelands relevant to the TMDL development efforts currently under way. It is our opinion that regional, even watershed-specific, survey information is critical to making land-use management, conservation funding and water-quality decisions for TMDL development and attainment. This information includes land-use types, relative contributions by each land-use type, and probable causes of sediment delivery sites.
Questions.
We specifically set out to explore the following questions:
-
What proportion of sediment delivery sites identified across these 10 representative ranches would the landowner be required to inventory and control for TMDL compliance?
-
Where are the majority of sediment delivery sites located in the landscape (riparian area, uplands and so on)?
-
What are the probable causes for these sediment delivery sites?
-
What types of erosion (gully, mass-wasting and so on) are associated with these sediment delivery sites?
Sites.
The 10 ranches we surveyed are representative of the extensive livestock production and silviculture that occurs on the North Coast. Ranch size varied from approximately 400 to 6,000 acres. In general, North Coast rangelands are a mosaic of annual grassland, oak woodland and redwood fir forest. Annual precipitation ranges from 40 inches in the south and inland to 100 inches in the north and along the coast. The soils in these rangelands are naturally erosive to highly erosive, due to their formation in a complex melange of marine sedimentary and metamorphic rock. Silviculture, viticulture, extensive livestock grazing and recreation dominate regional land use.
Methodology.
We identified sediment delivery sites on each ranch by querying the participating manager's knowledge of erosion features. Specifically, the following questions were asked:
-
Where are the 10 sediment delivery sites of highest concern on your property with regard to sediment volume and sediment delivery to a water course?
-
Where do livestock concentrate on your property (feed troughs, water sources and so on)?
-
Where do livestock cross water-ways and have access to water bodies on your property?
-
Where are the prominent stock trails or runways on your property?
We are confident that this approach allowed us to capture the bulk of active sediment delivery sites on each ranch. We identified a total of 117 sites. The authors visited and characterized each of the sites following methodology in Lewis et al. (2000).
Site classification.
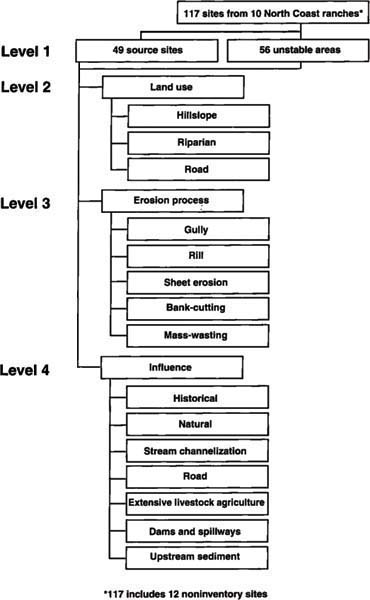
We first classified each sediment delivery site as a source site, unstable area or noninventory site according to NCRWQCB site-selection criteria established in the Garcia River sediment TMDL (NCRWQCB 1998a; fig. 1):
-
“Source sites” are “controllable, human-caused erosion sites that are currently eroding or have the potential to erode in such a manner as to deliver at least 10 cubic yards of sediment to a watercourse over the life of a TMDL.” At source sites, landowners are required to inventory, monitor and control erosion.
-
“Unstable areas” are “areas with a naturally high risk of erosion and areas or sites that will not reasonably respond to efforts to prevent, restore or mitigate sediment discharge.” At unstable areas, landowners are required to inventory and monitor but not control erosion. This assumes that current management is not exacerbating the problem.
-
“Noninventory sites” have a volume of less than 10 cubic yards. Landowners are not required to inventory, monitor or control sediment delivery from these sites.
Potential sediment delivery
The TMDL development process has created the term “potential sediment delivery” — the potential volume of sediment that can be eroded from a site and delivered to a stream over a 40-year period. This volume must be estimated to set priorities for individual site inventory, monitoring and control decisions. Despite the uncertainties and subjectivity associated with this estimation, it is the criterion that is currently required in water-quality regulations (NCRWQCB 1998a) and used by resource agencies (Cafferata and Poole 1993; Lewis and Rice 1989; Furman et al. 1983) and consultants (Meadowbrook Conservation Associates 1996; Pacific Watershed Associates 1990). All of the data presented from our survey is our best objective estimate of the potential sediment delivery for each site, based on our training and experience as hydrologists, rangeland scientists and soil scientists and on our experience working on sediment TMDL cases.
Potential sediment delivery at each site was determined by first estimating the amount of erosion that could occur over a 40-year period and the percent of eroded sediment that would be delivered from the site to a stream. This included estimating the possible length, depth and width of an erosion feature if left unchecked over the next 40 years. We took into account site features such as slope, soil type, age of the site, presence or absence of probable causes, depth to bedrock and various other features that determine the site's potential for continued active erosion. Landowner knowledge and site history were valuable assets when making these estimations.
The percentage of eroded sediment that could be delivered to a stream channel was estimated based on the site's connectivity to a watercourse, and was designated using four broad categories or ranks: (1) 0% to 30%; (2) 30% to 60%; (3) 60% to 90%; and (4) 90% to 100%. For example, the estimated sediment that could be eroded from the site shown on page 35 over a 40-year period is 160 cubic yards. Based on site connectivity to the nearest stream channel, we estimate that 60% to 90% of sediment eroded will be delivered to the stream. Therefore, the potential sediment delivery from this site is estimated to be between 96 and 144 cubic yards (160 cubic yards x 60% and 160 cubic yards x 90%).
Source site of sediment delivery associated with gully erosion and resulting from road drainage management and culvert design. Current water-quality regulations require inventory, monitoring and mitigation of this site.
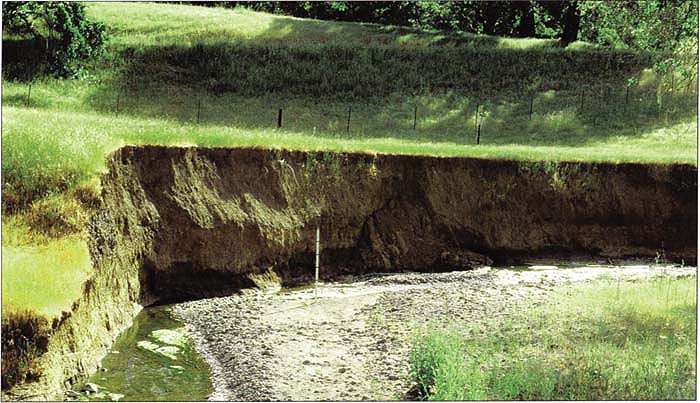
In comparison, the estimated sediment that could be eroded in the site shown on page 36 is 620 cubic yards. Because the site is a stream channel, 100% of the eroded sediment will be delivered to the stream, creating an estimated potential sediment delivery of 620 cubic yards.
Site characteristics
The 117 sites were first grouped by inventory designation to assess sediment delivery from source sites, unstable areas and noninventory sites (fig. 1). Source sites and unstable areas were then grouped by landscape position and erosion processes. Land-use types were divided according to three landscape geographic positions: hillslope, riparian and road. Finally, source sites and unstable areas were sorted by influence, including historical, natural, stream channelization, roads, extensive livestock agriculture, dams and spillways, and upstream sediment.
For each level of analysis, the total and mean potential deliverable sediment volumes, as well as mean percent deliverable rank were estimated for all 117 sites on the 10 ranches. Analysis of variance was conducted to test for differences in mean potential sediment volume and mean percent deliverable rank by inventory designation, land use, erosion process and influence.
Erosion and sediment trends
Question 1: What proportion of sediment delivery sites require inventory and control?
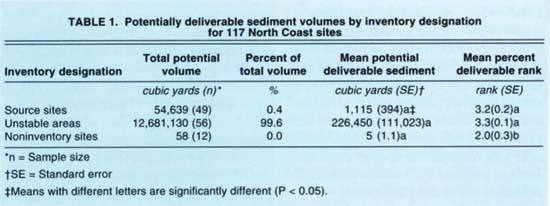
TABLE 1. Potentially deliverable sediment volumes by inventory designation for 117 North Coast sites
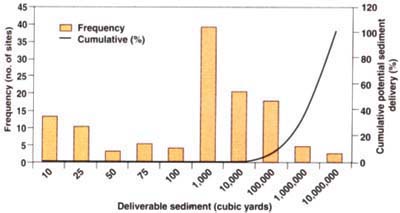
Total potential deliverable sediment was three orders of magnitude lower for source sites than for unstable areas, and represented less than 1% of the total volume for all 117 sites (table 1). The distribution analysis of the total deliverable sediment volume for all sites indicates that the majority (74%) have a deliverable volume equal to or greater than 100 cubic yards (fig. 2). In addition, this threshold of 100 cubic yards inventories nearly all of the deliverable sediment from all 117 sites.
These results indicate that the vast majority (99.6%) of deliverable sediment on the North Coast ranches we surveyed is attributable to unstable areas, and that current TMDL development and implementation strategies will address no more than 1% of the total deliverable sediment identified. Landowners commented that on unstable areas they had the least capacity to control sediment delivery because of the large site size and the engineering and financial resources required to implement control measures, which can be likened to CalTrans efforts to control mountain slides on the Pacific Coast Highway. Landowners also stated that these sites represent the greatest economic losses in terms of degraded and lost rangelands, and that they generate the greatest concern about regulatory ramifications. Nonetheless, mitigation of unstable areas appears to be critical to attainment of TMDL goals, and will require the cooperative efforts of regulators, landowners and restoration funding agencies.

Unstable area of sediment delivery associated with bank-cutting and resulting from historical and natural influences. Current water-quality regulations require inventory and monitoring but not mitigation of this site.
Our results also question the applicability of in-stream sediment monitoring to the current TMDL implementation process. Because in-stream sediment monitoring methods only detect water-quality changes larger than 10% to 20% (MacDonald 1992), the control of a small percentage of source-site deliverable sediment may not be detected. Finally, increasing the deliverable sediment volume threshold used to screen sites for inventory to 100 cubic yards would omit identification of 26% of the sites in this survey but still inventory more than 99% of the deliverable sediment (fig. 2). Reducing the number of sites requiring inventory would save time that could be better used for conservation and sediment delivery prevention.
Question 2: Where are the majority of sediment delivery sites located in the landscape?
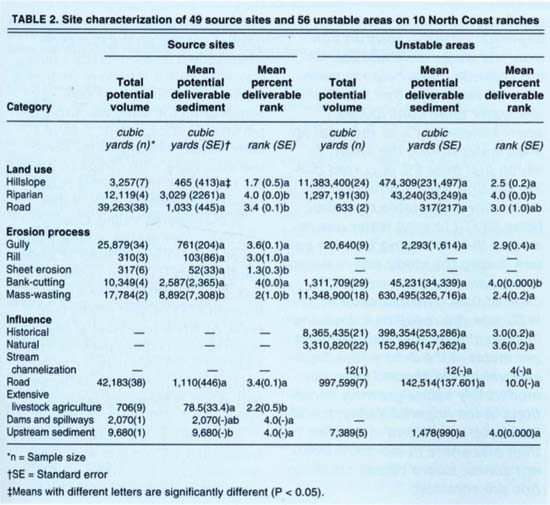
The greatest number of source sites (77%), and the majority of source-site potential deliverable sediment (71%), are associated with roads (table 2). The majority of unstable areas (53%) are associated with riparian zones, and the majority of unstable area sediment (90%) is associated with hillslopes. These results indicate the importance of road management to identify and control deliverable sediment from source sites. In addition, it is clear from the sites we surveyed that TMDL strategies can be successful through recognition of the cumulative volume of sediment associated with hillslopes and upland unstable areas.
Question 3: What are the likely causes of sediment delivery sites?
The majority of sites and potential deliverable sediment volume (77%) for source sites are influenced by roads, including culvert design, road drainage design, road-cut failure and road-fill failure (table 2). Nine of the 117 sites and 706 cubic yards of the deliverable sediment volume were attributed to extensive livestock agriculture. This includes deliverable sediment from livestock concentration areas, water crossings and trails identified in the survey questionnaire, and represents less than 2% of the total deliverable sediment volume from all source sites and less than 0.01% of total deliverable sediment volume. It is important to note that 11 of the 12 sites not meeting the inventory threshold of 10 cubic yards of potentially deliverable sediment were associated with extensive livestock agriculture. Additional management influences include dams, spillways and upstream sediment.
The majority of unstable area sites are associated with historical (38%) and natural (39%) influences. Historical influences are those with sediment delivery resulting from previous, discontinued management. These included grazing livestock management, road installation, and timber harvest practices that removed vegetation and exposed soil surfaces to rainfall impact and fluvial erosion processes. Changes to these previous practices include residual dry-matter standards for range management, road construction standards and State of California Forest Practice Rules. Natural influences that cause sediment delivery include climate, geology, slope and soils. The total deliverable sediment from historical and natural influences is 92% of the total deliverable sediment from all unstable areas and 91% of total deliverable sediment volume from all 117 sites.
Question 4: What types of erosion are associated with these sediment delivery sites?
Gully erosion drove 69% of erosion processes at all sites (table 2). Erosion process assessment for roads and extensive livestock agriculture source sites indicate that road-influenced sediment delivery is associated primarily with gully erosion (33 of 38 sites), while agricultural sediment is associated with sheet erosion, which is the removal of thin layers of soil from unconcentrated flow (6 of 9 sites) and bank-cutting (2 of 9 sites). In addition, the mean percent deliverable rank for the road-influenced source sites was significantly higher (P < 0.05) than for extensive livestock agriculture (table 2). Unstable areas were primarily associated with stream bank-cutting (52%) and mass-wasting (32%). Mass-wasting is the downslope movement of soil and geologic meaterials under force of gravity and is often used synonymously with “landslide.”
Based on these results, water-quality managers should research and implement gully erosion-control measures for source-site mitigation. These recommendations are supported by indications that improved road building and maintenance techniques have reduced sediment delivery in Northern California watersheds (Rice 1999). Survey results also indicate that extensive livestock agriculture is not a significant sediment source risk to impaired water bodies. Furthermore, monitoring efforts that investigate and identify stream bank-cutting and mass-wasting processes account for the majority of deliverable sediment. This is consistent with work summarized by Lewis and Rice (1989), which indicated that the majority of soil erosion and sediment delivery in Northern California is generated from mass movement on hillslopes.
Managing sediment delivery
Our survey indicates that the total deliverable sediment at unstable areas is three orders of magnitude larger than source-site sediment volume. These results support previous indications that soil erosion and sediment delivery in Northern California are primarily associated with climate, geology and soil conditions (Lewis and Rice 1989). The majority of this deliverable sediment is associated with historical land use and not current management practices. Cooperative efforts to mitigate unstable areas will be required by regulators, landowners and restoration funding sources to attain TMDL goals.
The large volume of deliverable sediment associated with unstable areas is likely to mask any in-stream efforts to monitor the control of sediment from source sites, bringing into question the role of in-stream sediment monitoring in the TDML development and implementation process.
Criteria and thresholds for sediment delivery site identification should address the majority of deliverable sediment in a watershed. The established criterion of 10 cubic yards resulted in the inventory of 35 sites that represented less than 1% of the total deliverable sediment in this survey. Raising the threshold to 100 cubic yards would identify over 99% of the deliverable sediment from the surveyed sites, reduce the number of sites requiring inventory, and allow reallocation of time and funds for soil conservation and sediment delivery prevention.
The majority of deliverable sediment in Northern California rangeland watersheds can be characterized by accounting for cumulative effects of unstable areas through the inventory of hillslope sediment delivery sites, mass-wasting erosion processes, and historical and natural influences. Management and conservation efforts can bring about the greatest improvements to water quality by focusing on source sites associated with road land-use areas, gully erosion and road influences.
Survey identifies sediment sources in North Coast rangelands

