


All Issues
Monitoring soil moisture helps refine irrigation management
Publication Information
California Agriculture 54(3):38-42. https://doi.org/10.3733/ca.v054n03p38
Published May 01, 2000
PDF | Citation | Permissions
Abstract
Soil moisture sensors can be used to determine the appropriate interval between irrigation, depth of wetting, depth of extraction by roots and adequacy of wetting. We tested the performance of soil moisture sensors in different crops. Sensors that read on a continuous basis, such as the Enviroscan device, can provide valuable information that may not be readily evident from periodic measurements. The Watermark blocks responded well throughout the wetting and drying cycles, indicating that they function more consistently over a wider range of soil moisture contents compared with tensiometers and gypsum blocks.
Full text
Irrigation scheduling addresses the questions of when to irrigate and how much water to apply. Determining when to irrigate requires estimating the irrigation timing so that yield reductions will not occur due to excessive soil moisture depletions. One method for irrigation scheduling is to measure or monitor soil moisture content. This paper discusses methods for estimating when to irrigate and presents case studies of using various soil moisture sensors for irrigation scheduling.
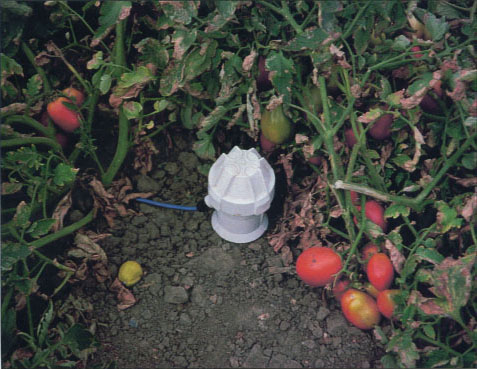
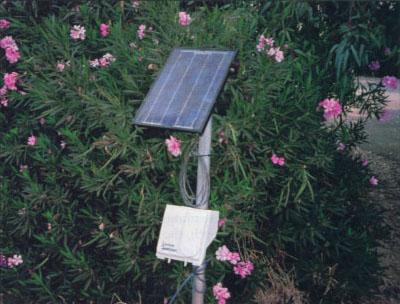
Enviroscan soil moisture sensors like the one shown, that monitor on a continuous basis, provide more information that can be valuable.
When should you irrigate?
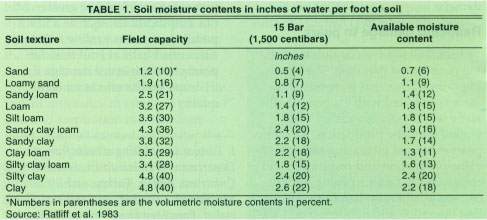
Available soil moisture is the water that plants can use. It is the difference between the field capacity moisture content and that at 15 bars (1,500 centibars), sometimes referred to as the permanent wilting point. Table 1 lists typical moisture contents at field capacity and at 15 bars for various soil textures and their available soil moisture (Ratliff et al. 1983).
Two methods are recommended for determining when to irrigate. One method recommends irrigating when the soil moisture tension reaches a recommended value (Taylor 1965), which depends on crop type (table 2).
The second method recommends irrigating when the available soil moisture is depleted to an allowable value, called the allowable depletion. Recommended allowable depletions (Doorenbos and Pruitt 1977) are expressed as a percentage of the available water (table 3). For most crops, an allowable depletion of 50% is used.
Normally, recommended soil moisture tensions and allowable depletions are presented independent of climate and soil texture.
However, research has shown that for cool, humid conditions, relatively large allowable depletions can occur before transpiration and yield are reduced. For warm, dry conditions, allowable depletions may be relatively small for the same soil type.
Some incompatibility may exist between the two methods. A recommended tension of 70 centibars may deplete 60% to 70% of the available soil moisture in sandy soil, based on generic soil moisture release curves (not shown). In contrast, the 70-centibar recommendation may deplete only 15% to 20% of the available soil moisture in clay soil. However, a 50% allowable depletion in this soil may cause a soil moisture tension of 150 centibars.
Which irrigation scheduling method is the best? The best method is that which maximizes crop yield. The recommended values in tables 2 and 3 reflect site-specific conditions, and thus some adjustment may be necessary for other soil types, salinity, climate, cultivars and cultural practices. Site-specific conditions under which recommendations were developed are not known, and thus any adjustments may require some trial-and-error.
We developed the following guidelines using the recommended values in tables 2 and 3 and the generic moisture release characteristic curves:
-
For sand/loamy sand, consider using allowable depletions as the criterion for irrigating. Use of soil moisture tension may result in soil moisture depletions greater than allowable depletions.
-
For sandy loam/loam/silty loam soils, either method may be appropriate. Compatibility between the two methods is more likely for these soils.
-
For clay loam/clay soils, consider using allowable depletion as the criterion for irrigating. Use of soil moisture tension may result in small depletions.
These recommendations are appropriate for low-frequency surface and sprinkler irrigation, where irrigation intervals are such that large soil-moisture depletions occur between irrigations. For high-frequency irrigation (microsprinklers, drip emitters and drip tape), small irrigation intervals recommended for these systems result in very small soil moisture depletions between irrigations. Therefore these recommendations do not apply for high-frequency irrigation.
Methods of monitoring/measuring soil moisture include tensiometers, electrical resistance blocks, neutron moisture meter and dielectric soil moisture devices. Advantages of measuring/monitoring soil moisture include determining soil moisture depletions, adequacy of wetting from irrigation, patterns of soil moisture extraction due to root uptake of water and trends in soil moisture content with time during the irrigation season. This information can also be used to validate other irrigation scheduling techniques. The following examples illustrate the type of information that can be obtained from monitoring/measuring soil moisture.
Flood-irrigated walnut orchard
We used Watermark blocks, gypsum blocks and tensiometers to evaluate flood or border irrigations of a walnut orchard planted on sandy loam (fig. 1). Soil moisture contents were also measured with a neutron moisture meter (NMM) to help interpret the readings of these instruments for this article.
Tensiometer readings were lowest just after an irrigation. Minimum readings were less than 20 centibars at the 6-inch depth; between 20 and 30 centibars at the 18-inch depth; and between 25 and 50 centibars at the 24-inch depth. Readings increased with time after an irrigation to a maximum reading of about 80 centibars, the maximum reading that can be obtained with tensiometers at or near sea level. The tensiometer at the 12-inch depth did not respond with time, possibly due to a leaking instrument.
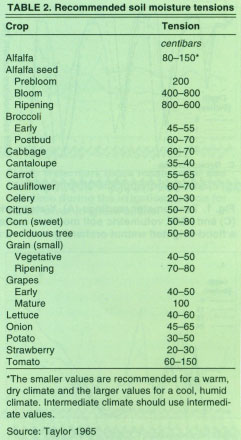

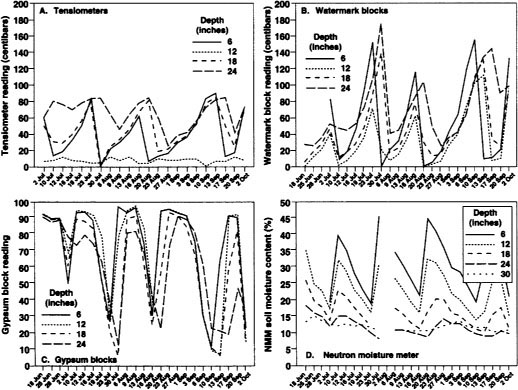
Fig. 1 Tensiometer readings (A), Watermark block readings (B), gypsum block readings (C) and NMM volumetric soil moisture contents (D) with time during irrigation season for a flood-irrigated walnut orchard grown in a sandy loam soil.
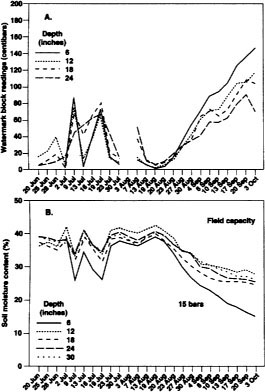
Fig. 2 Watermark block readings (A) and NMM volumetric soil moisture contents (B) with time during the irrigation season for furrow-Irrigated processing tomatoes grown in a silty clay soil.
Watermark block readings also increased as soil moisture depleted after an irrigation. Maximum readings ranged between 100 and 180 centibars, indicating that Watermark blocks operate under drier conditions than tensiometers. Readings just after an irrigation were less than 20 centibars for all depths except 24 inches, where minimum block readings ranged between 30 and 50 centibars.
Gypsum block readings exceeded 90 just after an irrigation (except at 24 inches deep), to between 5 and 25 just before an irrigation. However, little change in readings occurred for about 1 week after an irrigation.
Thereafter, large changes in readings occurred over the next 2 weeks.
NMM soil moisture contents ranged between 30% and 40% for the 6- and 12-inch depths just after an irrigation. Just before irrigations, soil moisture contents were about 15%. Lower moisture contents occurred at the deeper depths, indicating less wetting at those depths. Little change in moisture content occurred 30 inches deep, indicating that irrigation water was not reaching this depth.
All devices responded to changes in soil moisture content between irrigations. However, as the soil dried, soil moisture tensions exceeded the tensiometer's maximum reading of about 85 centibars. Thus the tensiometers were not effective in monitoring soil moisture in this field. The gypsum blocks also responded to soil moisture changes, but they changed little during the week following an irrigation. By the time they started responding, soil moisture tensions were nearly 60 to 70 centibars. The Watermark blocks responded well throughout the wetting and drying cycles, indicating that they function more consistently over a wider range of soil moisture contents compared with tensiometers and gypsum blocks.
For this crop, the recommended allowable depletion is 50%, and the recommended soil moisture tension is about 70 centibars. Both Watermark block readings and NMM soil moisture contents indicate that intervals between irrigations were too long. Watermark readings greatly exceeded 70 centibars. Soil moisture contents ranged from field capacity to nearly the 15-bar moisture content (using values in table 1), indicating that most of the available soil moisture was used between irrigations instead of the recommended 50%.
For this soil type, however, the recommended soil moisture tensions were compatible with the recommended allowable depletion. Watermark and NMM data showed about a 50% depletion at about 70 centibars of tension.
Furrow-irrigated tomatoes
Just after an irrigation, NMM soil moisture contents for furrow-irrigated processing tomatoes grown on silty loam soil were about equal to field capacity (table 1) for all depths of measurement (fig. 2). Watermark block readings were less than 20 centibars. Between irrigations, moisture contents decreased to about 35%, while block readings increased to between 70 and 85 centibars. After the irrigation cutoff date of Aug. 19, moisture contents decreased over time to less than 30%, a practice designed to increase soluble solids of the fruit. Watermark block readings generally increased to more than 100 centibars.
These measurements indicate that optimal irrigation water management was used at this site. Between irrigations about 50% of the available soil moisture was depleted, the allowable depletion recommended for this crop. Depth of wetting was adequate.
Center pivot-sprinkled alfalfa
Watermark block readings were made in an alfalfa field irrigated with a center pivot sprinkler machine (fig. 3). To help interpret the block readings, we also measured soil moisture contents with an NMM. Measurements were made at 1-foot intervals down to 5 feet. Irrigations occurred every several days. Soil texture ranged from loam at 1 foot to loamy sand at 3, 4 and 5 feet.
Initially, Watermark readings were between 10 and 20 centibars, about field capacity for this soil. However, NMM soil moisture contents varied with depth, reflecting soil variability, with the largest moisture content near the surface and the smaller contents about 3 feet deep. This variability was not detected from the Watermark block readings because they measure soil moisture tension only. (For a given soil moisture tension, soil moisture content depends on soil texture.)
Block readings at 1 foot started increasing on about May 6 as crop evapotranspiration increased. At the same time, soil moisture content started decreasing at that depth. Block readings periodically showed large readings followed by smaller readings, after which readings increased with time. The large readings occurred when the grower quit irrigating before cutting the alfalfa. Irrigations following the cutting decreased soil moisture tension.
Watermark readings at the deeper depths initially lagged the 1-foot readings. The deeper the depth, the greater the lag. Readings at the 1-, 2- and 3-foot depths increased to about 100 centibars at the end of May, the time of the first cutting. However, no decrease occurred after the irrigation in early June. Instead, the Watermark readings continued to increase with time, indicating that soil moisture depletion occurred at those depths, but applied water was inadequate to rewet that deep. The soil moisture depletions at the deeper depths indicate that more water per irrigation was needed.
Wheel-line sprinkled aifalfa
Watermark block readings from an alfalfa field irrigated with a wheel-line sprinkler system generally remained less than about 40 centibars at all depths (not shown). This indicates that the field is irrigated too frequently, thus too much irrigation water was applied. The irrigation frequency and /or duration of irrigation should be reduced to correct the problem.
Wheel-line sprinkled pasture
We installed Watermark blocks in an irrigated pasture at 1-foot intervals down to 4 feet. An additional block was installed at 0.5 feet in early July to better monitor soil moisture of this shallow-rooted crop. In early March, Watermark block readings ranged between 10 and 20 centibars, except at 4 feet (fig 4). The 1-foot readings increased slightly with time until near the end of May. Watermark blocks at both the 0.5-and 1-foot depths showed a periodic behavior of increasing readings with time, followed by a large decrease and then an increase. Maximum readings for the 0.5-foot depth were much larger than for the 1-foot block.
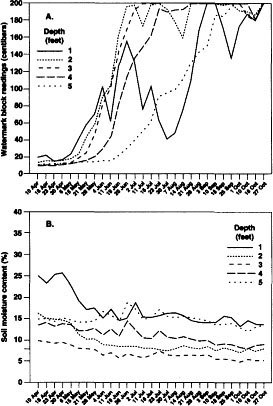
Fig. 3 Watermark block readings (A) and NMM volumetric soil moisture contents (B) with time during the irrigation season for center-pivot-irrigated alfalfa.

Fig. 4 Watermark block readings with time during the irrigation season for sprinkler-irrigated pasture.
At the deeper depths, Watermark readings increased slightly until about mid-July. These readings were generally between about 10 and 30 centibars, indicating little soil moisture depletion at those depths.
These readings show that much of the soil moisture depletion was occurring at less than 2 feet deep. The wetting and drying cycles reflect the cutting and irrigation schedule of the pasture. NMM soil moisture contents (not shown) revealed that most of the available soil moisture was depleted during the cutting/drying periods.
These readings differed considerably compared with the alfalfa readings (fig. 3). Moisture extraction occurred down to at least 5 feet deep for the alfalfa, but occurred only in the upper 2 feet for pasture, which shows the smaller root depth of the pasture. Therefore pasture should be irrigated more frequently, with smaller water application per irrigation, compared with alfalfa.
Furrow-irrigated garlic
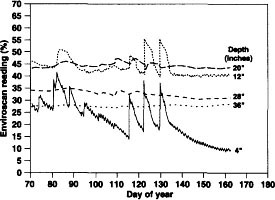
We used an Enviroscan system in a garlic field that was furrow irrigated weekly until cutoff. Soil type was silt loam. The sensors, which read every hour, were installed in a plant row at depths of 4,12, 20, 28 and 36 inches. Although the Enviroscan system is designed to directly measure soil moisture content, some of the readings were not realistic for this soil type. Nevertheless, the continuous measurements provided useful information on the irrigation water management.
In some soil types, the Enviroscan readings were inaccurate.
At 4 inches deep, large changes in readings caused by irrigations and rainfall occurred between days 80 and 90 (fig. 5). Readings at 12 inches also changed, but only a slight change occurred at 20 inches. No change was found at the other depths.
Between days 90 and 110, readings at 4 inches deep steadily decreased, showing little response to the weekly irrigations. This behavior reflected inadequate wetting due to very nonuniform infiltration of irrigation water along the furrow length.
The uniformity problem was corrected by increasing the furrow inflow rate of the subsequent irrigations. Thereafter, substantial changes in Enviroscan readings occurred.
These continuous measurements clearly showed the lack of wetting caused by inadequate infiltration. This behavior was less obvious from the weekly measurements made with an NMM.
Irrigation problems identified
Monitoring soil moisture tension or soil moisture content can help identify problems in irrigation water management that might affect crop yield or water use. Problems identified in these examples include excessive intervals between irrigations (walnut), inadequate wetting (alfalfa and garlic), too-frequent irrigations (alfalfa) and differences in soil moisture extraction patterns between alfalfa and pasture.
Tensiometers and electrical resistance blocks can be used to determine when to irrigate, trends in soil moisture content, and adequacy of wetting. They cannot be used to estimate changes in soil moisture content unless they have been calibrated for a particular soil type, a process that is difficult and time consuming. Dielectric soil moisture sensors can be used to measure soil moisture contents, provided that they are reasonably accurate. Continuous monitoring of soil moisture content can identify trends that might not be readily detectable from weekly measurements, even though the instrument may not be accurate.
Monitoring soil moisture helps refine irrigation management

