


All Issues
Black Mission fig production improved by heavier irrigation
Publication Information
California Agriculture 53(6):30-34. https://doi.org/10.3733/ca.v053n06p30
Published November 01, 1999
PDF | Citation | Permissions
Abstract
An analysis of tree-water relations and fruit yield indicates that Black Mission fig production responds favorably to a higher volume of water applied during the summer than is currently used by most of the industry. Larger fruit size was the primary yield component responsible for the improved production and profit. Based on historical reference crop evapotranspiration rates and the crop coefficients determined using data from this study, summer-applied water should be about 36 inches for maximum Black Mission fruit production and grower profit in the Madera area.
Full text

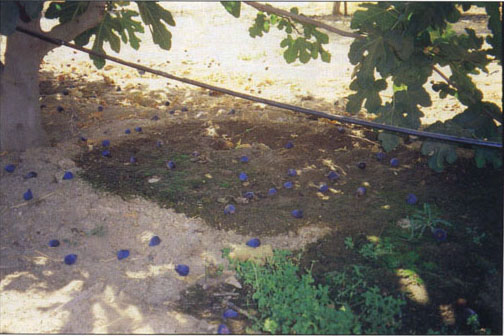
Trees in the foreground received a total of 10.7 inches of water (note defoliation) while trees in the background were irri- gated with 33.3 inches of water. Photo was taken during the harvest period.
Figs have been produced in the San Joaquin Valley for more than a century. During the last few decades, much of the production has been displaced from the flat topography in Fresno County to more undulating land in Madera County. Flood irrigation has been largely replaced by drip irrigation, which offers much better control of irrigation timing and amounts. However, realization of potential production benefits from drip irrigation while using minimum irrigation amounts requires knowledge of tree response to different levels of applied water. Since little work has been done in California on fig irrigation requirements, we studied the response of the two primary varieties — Calimyrna and Black Mission — to various irrigation regimes in 1994-95. This paper reports on our results for Black Mission and presents irrigation scheduling recommendations.
Seven irrigation treatments
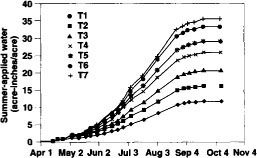
This work took place in a commercial 20-year-old Black Mission orchard located just east of Madera. The soil is a shallow sandy loam with a 2-to-3-foot root zone with relatively low infiltration rates. We established seven irrigation regimes, based on applying various percentages (75% to 225%) of the grower/cooperator's irrigation rate during the summer (fig. 1). This grower's irrigation regime was typical of that used by much of the fig industry in California. There were six replications of each irrigation treatment. Since the irrigation amounts between the progressive treatments were small, single tree rows served as replications; there were no “;guard” rows between the adjacent treatments, which minimized the size of the project. Each replication (tree row) contained seven trees, and the interior five trees were monitored. The grower generally irrigated for 12-hour durations, one to four times per week.
To facilitate the differential irrigation, we modified the existing single-line drip irrigation system by adding another drip line to each replication. Each irrigation treatment was imposed by varying the number and discharge rates of drip emitters per tree. The original drip line was maintained in each replication and used during fertilizer application. Manifold valving on each replication allowed easy switching of drip lines. Dual pressure regulators were installed on each replication to maintain desired operating pressures. In-line meters were used to measure applied water. Table 1 shows mean 1994-95 summer-applied water. Rainfall and winter irrigation filled the soil moisture reservoir at the start of the season with an estimated 5 inches of available soil water.
Tree-water status measurements
Both predawn (before sunrise) leaf water and midday (noon to 1:30 pm) stem water potentials were measured monthly in 1994. Midday stem-water potential appeared to be more sensitive to the various irrigation regimes. Therefore, stem water potential was monitored more frequently in 1995 as an indicator of tree stress. The procedure involved placing a foil-covered polyethylene bag over a shaded leaf close to the tree trunk at about 10 am. At about 1 pm, the leaf and bag combination was removed with a small knife and immediately placed in a pressure chamber for stem water potential determination. Single leaves on one tree in each of three replications per irrigation treatment were sampled every week or two.
On Aug. 18, 1995, we conducted a diurnal study of stem water potential and stomatal behavior on one replication of each irrigation treatment. Single interior canopy leaves close to the trunk on each of three trees per irrigation treatment were used to determine stem water potential every 2 hours from 4 am to 8 PM. To determine stomatal conductance, we used a steady-state porometer on three fully sunlit leaves on each of three trees per irrigation treatment every 2 hours from 8 AM to 6 PM.
Fruit growth, yield components
Beginning in early July, we randomly sampled four fruit per tree on each of the five monitored trees per replication each week. We determined fresh-and oven-dry weights and measured the diameter of the fresh fruit with electronic calipers.
There were five harvests — Aug. 23, Sept. 2, 14 and 22, and Oct. 3. To avoid interfering with the grower's harvest, we hand-racked the fruit in each replication just prior to the grower's normal mechanical sweeping and removed it from the orchard. The fruit was placed on paper trays and air-dried 4 to 6 days. The fruit was then collected and weighed to determine gross yield. All fruit was then placed in cold storage. Following the last harvest, all fruit was removed from cold storage and transported to a commercial sorting operation. Each fruit was characterized as “;product” (commercially sellable) or “cull” (no commercial value), based on visual appearance. Total “product” and “cull” fruit were weighed and a subsample of the “product” (300 fruit) taken. This sample was analyzed by a commercial laboratory to determine industry size categories, which was necessary to calculate tonnage value.
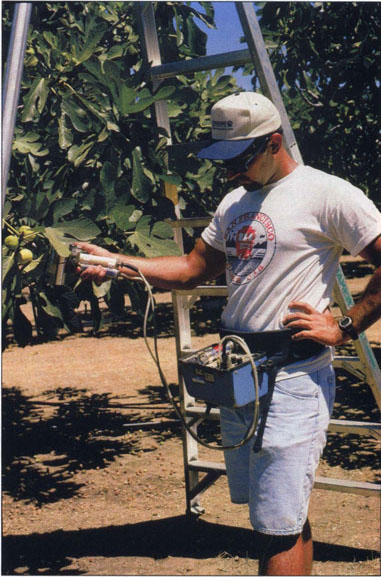
Stomatal conductance is measured with a porometer by Dan Howes.
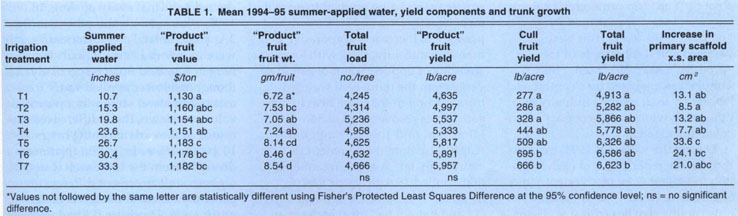
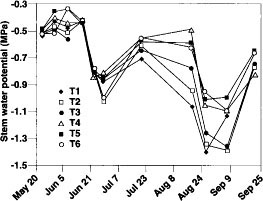
Fig. 2 Midday stem-water potential with time during 1995 for the first six irrigation regimes. T7 was similar to T6 and has been omitted for clarity.

Fig. 3. Diurnal measurements of stem-water potential and stomatal conductance on Aug. 18. 1995, for the first six irrigation regimes. T7 was similar to T6 and has been omitted for clarity.
During the winter of 1994, trees in three of the replications of each irrigation treatment were inadvertently mechanically topped. This influenced not only canopy size but fruit size. There-fore the data reported in this paper is mean values (1994-95) from the three of the original six replications that were not topped.
Scaffold growth
The circumference of one primary scaffold on each of the five trees per replication was measured before and after the study. These values were used to determine the increase on scaffold cross-sectional area.
Plant-water relations
Tree-water status and stomatal behavior can be used as indicators of water stress. Seasonal stem water potential is shown in Figure 2. The more negative the stem water potential, the greater the water stress. Through mid-June, treatment values were -0.3 to -0.5 megapascal (1 MPa = 10 bars), with no clear differences between irrigation regimes. This reflects the fact that the soil water reservoir was fully refilled by rainfall and winter irrigation, and this reservoir must be depleted before summer irrigation treatment differences become apparent.
The stem water potential for all treatments declined from mid-June to early July. This is consistent with inadequate water being applied to even the most heavily irrigated treatment, and possibly to increased evaporative demand. In mid-July, trees with lower amounts of applied water began to diverge from the more well watered trees. Although the more heavily irrigated trees recovered to -0.5 to -0.6 MPa from mid-July through mid-August, treatment differences remained. By late August, treatments that applied 19.8 inches or less of mean 1994-95 summer-applied water (T3 and below) had an average stem water potential of -1.4 MPa compared with -0.9 MPa for the treatments with at least 23.6 inches of 1994-95 mean summer-applied water (T4 and greater). Again, it appears that inadequate water was applied from late August through mid-September to all treatments.

Mario Salinas prepares to measure stem water potential with a pressure chamber.
Another approach for using tree-water relations to identify stress is with diurnal measurements. We conducted a diurnal study on Aug. 18, 1995, where stem water potential (fig. 3A) and stomatal conductance (fig. 3B) were monitored every 2 hours beginning at 4 am and 8 am, respectively. Although the lower applied water treatments had lower stem water potential values predawn, these differences narrowed in the early morning hours. By 10 am, the lower irrigation treatments diverged from the more well watered regimes, and treatment differences generally reflected the levels of applied water. However, T5 had the least negative stem water potential in the late afternoon. The largest treatment differences occurred at the noon and 2 PM readings. This greater sensitivity of midday stem water potential compared with predawn leaf water potential was observed throughout the season (data not shown).
Stomatal conductance diurnal patterns also reflected applied water amounts (fig. 3B). Although the deficit irrigated treatments had lower stomatal conductance throughout the day, maximum stomatal conductance occurred at midday in all treatments. Higher stomatal conductance results in higher photosynthesis, the process that produces the sugars necessary for vegetative and reproductive growth.
Yield and yield components
There are three primary yield components in figs — fruit size, fruit load and the amount of “;cull” fruit. Since growers receive premium prices for larger fruit, maximizing harvest fruit size is important for top grower profits. The higher irrigation regimes had larger amounts of the premium size Extra Fancy and Fancy fruit ($0.70/lb) (table 2). Most fruit was categorized as Choice ($0.57/lb), and there were no treatment differences in the size. Standard fruit ($0.52/lb), the smallest size category, was higher with the lowest applied water regimes. Individual product fruit weight was significantly lower for treatments that received less than 26.7 inches of summer applied water (T5).
Fruit load was not significantly different between treatments even though primary scaffold growth tended to be less for the lower irrigation treatments (table 1). Therefore, total fruit production differences were due almost entirely to differences in fruit size. Cull fruit was directly related to irrigation amounts and ranged from 277 to 666 lb/acre for the lowest and highest irrigation treatments, respectively (table 1). This was due to the larger wetted surface area in the higher irrigation regimes. Fruit that dropped on wet soil was subjected to conditions much more likely to promote fungal disease. This was the primary factor that resulted in the fruit being characterized as culls. We must emphasize that the experimental orchard had soil with relatively poor infiltration, which aggravated the problem of large wetted areas in the tree row. Even though the lower irrigation regimes had less cull fruit, they also produced less product yield, again mostly the result of the aforementioned smaller fruit size (table 1).
Black Mission figs that fall on wet soil are more likely to develop a fungal disease than those on dry soil. Diseased figs are culled out at the fruit processor.
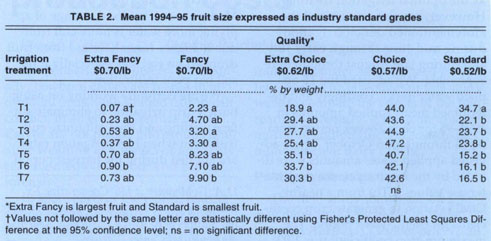
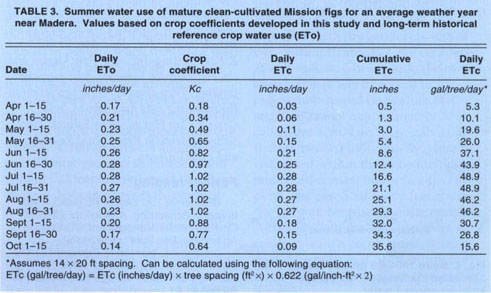
TABLE 3 Summer water use of mature clean-cultivated Mission figs for an average weather year near Madera. Values based on crop coefficients developed in this study and long-term historical reference crop water use (ETo)
Larger fruit size resulted in higher product tonnage prices for the higher irrigation treatments (table 1). This was the main factor in the gross revenue differences (fig. 4). Seasonal irrigation with 26.7 inches or more — T5 and greater — had gross revenue of about $3,400/acre compared with about $2,600/acre with 10.7 inches (T1).
Irrigation recommendations
Based on the tree-water relations and production data, we selected T5 as the optimal irrigation treatment. However, we also recognized the aforementioned deficit irrigation during mid-June through early July and during late August through mid-September. We adjusted the T5 applied water data accordingly and determined mean applied amounts in 1994-95 for each 2-week period from April through mid-October. These adjusted applied water amounts were divided by the mean reference crop water use values (ETo) from a nearby CIMIS station to generate crop coefficients for each 2-week period. The maximum crop coefficient was 1.02 from July through August. Crop coefficients and long-term historical ETo for Madera were used to determine normal-weather-year Black Mission fig orchard evapotranspiration (table 3). This resulted in 35.6 inches of summer-applied water and a maximum orchard water use value of 49 gallons/tree/day for mature Black Missions on a 14-foot-by-20-foot spacing.

Analysis of tree-water relations and fruit yield components indicates that Black Mission rig production responds favorably to higher levels of summer-applied water than is currently used by most of the industry. Greater fruit size was the primary yield component responsible for the improved production and profit. Based on historical ETo and the crop coefficients determined using data from this study, which we believe are transferable for Black Missions in the San Joaquin Valley, summer-applied water should be about 36 inches for maximum fruit production and grower profit in the Madera area. The disadvantage of applying more water is more cull fruit due to higher fungal disease from fruit dropped on wet soil, especially if the soil has poor infiltration.
We are currently working on using buried drip irrigation to eliminate surface wetting and thus minimize cull fruit even when high irrigation rates are applied during the harvest period.

A goal of every dairy producer is to raise fast-growing, healthy heifers to replace older cows in the milking herd, while minimizing costs. Most calf-rearing facilities are labor and capital intensive and must be well managed to minimize death loss and disease. Unfortunately, newborn heifer calves often receive insufficient colostrum immunoglobulins, predisposing them to illness. Rearing immunodeficient calves in groups on pasture (mob rearing) from birth offers dairy producers an opportunity to reduce production costs with no greater risk of mortality while improving animal performance. In this pilot study, feed costs were 48% lower for mob-reared calves from birth up to 165 days of age. Additionally, the rate of gain for mob calves was greater immediately following weaning, and the risk of mortality was 40% less for mob calves than for calves reared in individual pens with limited calf-to-calf contact.
Black Mission fig production improved by heavier irrigation

