


All Issues
Food preparation practices influence nutrition
Publication Information
California Agriculture 53(1):29-32. https://doi.org/10.3733/ca.v053n01p29
Published January 01, 1999
PDF | Citation | Permissions
Abstract
How do low-income families' food preparation practices contribute to their nutrition? To answer this question, 97 families in the Expanded Food and Nutrition Education Program (EFNEP) were surveyed about their cooking methods and food purchasing practices. The survey revealed that more-adequately nourished families were more likely to prepare dishes from scratch, purchase more fruits and vegetables, and use a greater variety of cooking methods. Researchers also found that EFNEP families could benefit from learning food preparation skills that reduce fat in the diet, particularly learning new ways to prepare fruits and vegetables — foods that are naturally low in fat.
Full text
Few studies have been published on the food preparation practices of low-income families. The Expanded Food and Nutrition Education Program (EFNEP) teaches low-income families how to prepare a healthy diet using a variety of approaches with very positive results (Brink and Sobal 1994; Del Tredici et al. 1988). A study in Hawaii showed that learning cooking skills from cooking demonstrations also improved nutrition knowledge (Boushey and Rauch 1989). Other researchers have found that recipes, particularly if they are demonstrated, enhance learning (Hertzler 1983; Nowalk et al. 1986; Gussow 1988) as well as promote the use of healthy foods (Derrickson and Gans 1993).

The more-adequately nourished families purchased more fruits and vegetables and were more likely to use a greater variety of cooking methods.
Adequate food preparation skills are needed to prepare low-cost, nutritious meals that meet current dietary recommendations. These skills are especially critical in families with limited resources since financial obligations often leave very little money for the purchase of food. Limited food-preparation skills can also reduce the variety of foods consumed and lead to a low consumption of certain foods that contribute to a healthy diet.
The purpose of this survey was to study the food purchasing and preparation skills of low-income participants in two different geographical regions of California. The two regions, one urban and one rural, were studied so results would be more representative of the state.
Survey design
Participants (n = 97) were English-speaking low-income mothers enrolled in EFNEP in Santa Clara (n = 50) and Tulare (n = 47) counties from fall 1994 to winter 1996. Two age groups were studied: 15- to 19-year-olds and 20- to 30-year-olds. All participants volunteered to participate in the study. None of the families had received EFNEP instruction prior to the survey. Questionnaires were used to gain information about the foods consumed and the food purchasing and preparation practices of the participants in the study.
Trained nutrition researchers interviewed the 97 participants using two instruments: a food preparation questionnaire and a dietary profile. Each interview took one to two hours.
Food preparation questionnaire
We conducted focus groups before the study to determine the types of questions to ask participants in order to assess food practices and skills. Trained interviewers conducted eight focus groups in each of the two counties. The focus groups' conversations were tape-recorded and transcribed. The groups' comments were then used to develop a questionnaire on food preparation practices.
One major finding from the focus groups was the genuine interest in both learning new ways to prepare foods, especially fruits and vegetables, and learning about low-fat recipes and foods from the meat group. A second finding was the fact that the families interviewed reported that they knew how to cook. Researchers, like others in the field, believed that low-income families lacked many of the basic cooking skills. A four-page questionnaire was developed based on the focus groups' responses.
The questionnaire focused on a variety of food purchasing and preparation practices. Questions were asked about the frequency of eating away from home and eating at fast food restaurants (times per week). Other questions concerned purchasing practices (fresh, frozen, canned) of 12 vegetables and 6 fruits, and preparation practices (bake, broil, stew, stir fry, steam, microwave, uncooked) for these same foods. For example, questions about how they prepared vegetables allowed participants to check off the following methods: bake, broil, stew, stir fry, steam, microwave and uncooked.
Several variety scores were calculated from the questionnaire results. The variety scores for fruits and vegetables represented the number of different ways the participants reported purchasing these foods (three ways for fruits and three for vegetables). The fruit variety score was calculated by counting the number of different fruits each participant reported purchasing (range 0–6 fruits). The vegetable variety score was calculated similarly (range 0–12 vegetables). The fruit and vegetable variety score was calculated by adding the fruits and vegetables together (range 0–18 fruits and vegetables). The preparation variety score represented the number of different ways that foods were prepared by the participants. The fruit and vegetable preparation variety score (range 0–10 ways) was calculated by adding the fruit preparation variety score (range 0–3 ways) to the vegetable preparation variety score (range 0–7 ways).
Other variables that we studied included the number of food items (range 0–10) that participants prepared from scratch. Participants scored 10 combination dishes (macaroni and cheese, spaghetti with sauce, casseroles, soups, stews, pizza, tacos, burritos, enchiladas and other) as something made from scratch, purchased in a package or box, or a combination of these two methods. We asked other questions about eight preparation methods of beef, pork, sausage, bacon, chicken, fish and eggs (bake, broil, fry, boil, roast, stir fry, grill, microwave). In addition to these, we asked open-ended questions about types of salads, and whether participants would like information on recipes for salads, combination dishes and stir-fry dishes.
The dietary profile
In addition to the food practices questionnaire, we administered a dietary profile to assess food consumption practices (Murphy et al. 1997). The dietary profile was used to determine the foods consumed in a typical week. This instrument was chosen to reflect usual intake and is a better indicator than the 24-hour period that is typically measured. Results of the dietary profile were assumed to reflect intake over the past month so that the associations between the dietary profile and food practices questionnaire could be examined.
The dietary profile data were analyzed using UC Berkeley nutrient analysis software, which converts food items and serving sizes to nutrient intakes. Two dietary outcome variables were of primary interest: nutrient inadequacy (a measure of underconsumption) and the percent of calories from fat (a measure of overconsumption).
We examined participants' intake of 15 nutrients: protein, vitamins A, C, E, B-6, B-12, thiamin, niacin, folacin, riboflavin, and minerals calcium, phosphorus, iron, zinc and magnesium. Participants whose intake for three or more of the 15 nutrients was less than two-thirds of the recommended dietary allowance (RDA) (National Research Council 1989) were considered less adequately nourished (LAN). Those whose intake for at least 13 nutrients was two-thirds or more of the RDA were considered more adequately nourished (MAN). LAN and MAN participants were compared to see if there were differences in food purchasing and preparation skills between the two groups. (Two-thirds of the RDA is used as the cut-off level because the RDA includes a safety factor to meet the needs of practically all healthy adults; therefore, most adults require less than the RDA for a nutrient.)
Another variable calculated from the dietary profile was the percent of calories from fat. Participants with less than 30% of calories from fat, a measure of a lower-fat diet, were compared to those with a diet that was more than 30% calories from fat. In this way, the individuals with lower-fat diet and higher-fat diets could be compared to see if there were any differences between the two groups in food purchasing and preparation practices.
Data were analyzed using the SPSS statistical package (SPSS 1997). The two independent sample t-test was the statistical procedure used to evaluate these relationships.
Participants' characteristics
Study participants ranged in age from 15 to 30 years, with an average age of 21.1 years (47.3% was 15 to 19 years and 52.6% was 20 to 30 years). Because differences between the two age groups were not significant, the two groups were combined for analysis. Participants in the study included Hispanic (62.1%), White (26.3%), African American (7.4%) and other (Asian, Native American, 4.2%). Household size ranged from 2 to 10 members with an average of 4.3 members.
Food preparation results
Table 1 presents food preparation data comparing the LAN (less adequately nourished) group with the MAN (more adequately nourished) group. Several variables were compared to determine the relationship between nutritional adequacy and these variables: percent of calories from fat; fruit and vegetable variety scores; and fruit and vegetable preparation variety scores. Other variables compared were the number of foods prepared from scratch, the frequency of eating away from home and the frequency of eating fast foods.
The participants who were more adequately nourished were more likely to prepare food from scratch than those who were less adequately nourished (table 1, P = 0.041). None of the other variables evaluated was significantly different.
The participants with less than 30% calories from fat scored higher in the fruits and vegetables variety score (P = 0.036) and in the vegetable preparation variety score (P = 0.006) (table 2). Other variables were not significantly different.
For the LAN participants, 30.7% of calories were from fat, compared to the MAN participants whose diets were 31.4% of calories from fat (table 1). Both these figures are low, especially if compared to national data. A national study conducted from 1989 to 1991 reported 34.5% for this same age group of women whose income was less than 131% poverty level (USDA 1995). This may mean that fat is under-reported in this study.
Other food preparation skills
We also asked about the ways meats, poultry and fish were prepared. Of the participants who ate beef, 69.1% sometimes fried it, 33% sometimes broiled it and 30.9% used a stir-fry method. For pork, 62.9% fried it, 15.5% broiled it and 17.5% prepared by a stir-fry method. For chicken, 72.2% fried it, 22.7% broiled it and 25.8% used a stir-method. For fish, 37.1% fried it, 9.3% boiled it, 4.1% broiled it, 4.1% grilled it and 3.1% used a stir-fry method. The meat most commonly reported prepared in the microwave was bacon.

TABLE 1. Food consumption patterns of participants less adequately nourished compared to those more adequately nourished
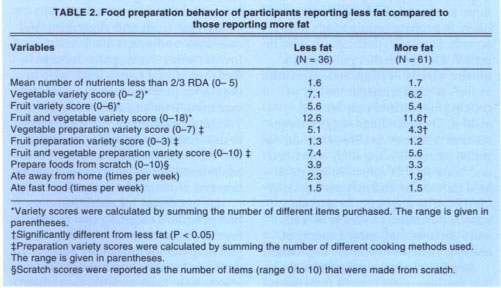
TABLE 2. Food preparation behavior of participants reporting less fat compared to those reporting more fat
Most participants were very familiar with preparing green salad (80.4%). Other salads, made by fewer participants, included potato (44.3%), fruit (30.9%), macaroni (26.8%) and pasta (12.4%).
Study limitations
This study had several limitations in its design and methodology. The study sample was limited to low-income families because families enrolled in EFNEP were recruited. Furthermore, this may reflect a more motivated group of people than might be found if the sample were completely random. Also, because only two counties are represented in the sample, the results may not be applicable to other geographical areas.
In addition, self-reported dietary data using instruments such as a dietary profile are known to under-report energy intake (Mertz 1991), and probably other nutrients as well. However, if the underreporting is fairly uniform across the participants, then the associations with food practices reported here are still valid. In particular, data on cooking preparation methods and added fat may not be easily obtained when a typical week's worth of intake data is collected.
Practices for better diets
Important findings from this study indicated that participants who were more adequately nourished were more likely to prepare certain foods from scratch. Similarly, participants who reported a lower fat diet purchased a greater variety of fruits and vegetables as well as used a greater variety of cooking methods to prepare vegetables. These findings suggest a significant relationship between good nutrition (i.e., more adequately nourished and lower fat diet variables) and good food purchasing and preparation skills (as shown by preparing foods from scratch, purchasing a variety of fruits and vegetable, and using a variety of cooking methods to prepare vegetables).
Results from this study indicate that families could benefit from learning new ways to reduce the fat in their diet. Since nearly 63% of participants had diets with 30% or more calories from fat (and this may be an underestimate), teaching ways to lower fat during food preparation could reduce the amount of fat in the diet. Frying was the most familiar method of preparing meat, fish and eggs. Cooking methods that used less fat to prepare meats were less familiar to families (i.e., broiling, roasting and stir-frying).

Vegetable dishes are nutritious and low in fat.
Other ways to reduce fat in the diet include preparing dishes that are lower in fat such as salads, pasta, beans, rice, fruits and vegetables, and casseroles and soups that combine low-fat foods. Participants reported that they would like to learn techniques for preparing pasta, potatoes, macaroni, fruit and Asian salads. Teaching participants different ways to use fruit and vegetables and other low-fat foods (beans, rice, pasta) in salads is another way of increasing nutrition and reducing fat in the diet.
It is important for nutrition education programs targeting low-income families to teach food-related skills that help families make the most of their limited time and money. One way to help these families is to teach them low-fat cooking techniques that yield low-cost, quick, easy, appetizing and nutritious meals.
Food preparation practices influence nutrition

