


All Issues
Computer model improves real-time management of water quality
Publication Information
California Agriculture 51(5):14-20. https://doi.org/10.3733/ca.v051n05p14
Published September 01, 1997
PDF | Citation | Permissions
Abstract
Members of the San Joaquin River Management Program's Water Quality Subcommittee have developed a water-quality forecasting model to help improve the timing, coordination and management of agricultural drainage and reservoir releases into the San Joaquin River. The goal of this effort is to improve water quality in the San Joaquin River and to meet federal and state water-quality objectives for salt, boron and selenium. A graphical user interface has been developed and features have been added to make this computer software useful and accessible to a wide range of decision makers.
Full text

The San Joaquin River sometimes contains high levels of selenium, boron and salt from drainage water. Reservoir releases can be timed to dilute these concentrations.
The San Joaquin River provides essential drainage for agricultural land and managed wetlands in the San Joaquin Valley. The river has an average annual flow of approximately 1.8 million acre-feet, measured at Vernalis. During the period 1985 to 1994, an average of 70% of the annual flow in the San Joaquin River was derived from the major east-side tributaries (Stanislaus, Tuolumne, Merced and Upper San Joaquin rivers), which receive flow from New Melones Reservoir, New Don Pedro Reservoir, Lake McClure and Millerton Reservoir. The remainder of the flow during this period consisted of surface drainage (14%), subsurface drainage (1%) and contributions from Salt Slough (9%) and Mud Slough (2%).
The major water-quality problems on the San Joaquin River are caused by high loadings of selenium, boron and salt, much of which is contained in agricultural subsurface drainage from the west side of the San Joaquin Valley. The Mud and Salt sloughs are tributaries of the San Joaquin River and contribute approximately 85% of the selenium load, 65% of the boron load and 45% of the salt load carried by the river. Seasonal drainage from 90,000 acres of wetlands in the Grassland Water District and in state and federal refuges contributes approximately 20% of the boron load and 30% of the salt load discharged from the Mud and Salt sloughs to the San Joaquin River. The average annual salt load carried by the San Joaquin River is approximately 920,000 tons, of which the east-side tributaries contribute 16%, Salt Slough 33% and Mud Slough 11%. The remainder of the salt load consists of groundwater (21%) and surface drainage (16%) (fig. 1).
Assimilative capacity
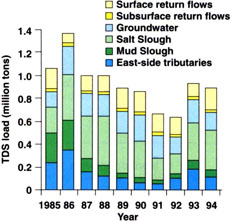
There is a large year-to-year and seasonal variation in water quality in the San Joaquin River (fig. 2). Downstream users are particularly sensitive to elevated salinity during the spring months of March and April when preirrigation and crop germination occur. March and April are also the months when many seasonal wetlands are drained for reseeding to provide overwintering habitat for migrating wildfowl. Spring pulse flows for salmon migration also occur during this time, providing potential dilution flows.
Electrical conductivity (EC) is directly correlated with the concentration of dissolved salts. In the 1985-to-1994 period, the electrical conductivity at Vernalis exceeded the State Water Resources Control Board (SWRCB) water-quality objective of 700 micro-Siemens per centimeter (μS/cm) 61% of the time during the irrigation season (April 1-Aug. 31). The non-irrigation season (Sept. 1-March 31) EC objective at Vernalis of 1,000 μS/cm was exceeded 15% of the time. These objectives were set as part of a negotiated settlement between the U.S. Bureau of Reclamation (USBR) and the South Delta Water Agency.
Although the U.S. Bureau of Reclamation tries to meet these water-quality objectives by making releases from New Melones Reservoir, water-quality forecasting capability has been inadequate to prevent frequent violations. Water is sometimes wasted when releases exceed the amount required for dilution. Precisely timing releases is difficult because of the fluctuating EC at Vernalis and the uncertain travel time between the reservoir and the main stem of the San Joaquin River. Improved forecasting of river assimilative capacity for salt load would help to remedy this problem.
Assimilative capacity for salt, as used here, is defined as additional salt load that the river can accept without exceeding EC objectives at Vernalis. Positive assimilative capacity indicates that additional drainage discharges can be made to the river without violating water-quality objectives. Negative assimilative capacity indicates a need for additional dilution.
Past analyses using mass-balance models of the river, such as the State Water Resources Control Board's San Joaquin River Input-Output model (SJRIO), suggest that considerable opportunity exists for improved coordination of drainage discharges and reservoir releases to more efficiently use river assimilative capacity for salt, boron and selenium while complying with water-quality objectives. Complementary studies by the U.S. Bureau of Reclamation — using a model that combined irrigation, drainage and crop-production functions — suggested that successful long-term operation of such a system might be possible without impairing crop yields and forcing irrigated land out of production.
Recent actions initiated by local water districts to improve compliance with water-quality objectives include increased drainage recycling; use of short-term, on-farm surface and subsurface storage; and the adoption of water conservation and drainage reduction technologies to increase control of drainage discharges and contaminant loads. In addition, real-time, telemetered data-acquisition systems have been installed on the major tributaries to the San Joaquin River, at compliance points on the river as well as at drainage outlets from the agricultural water districts.
San Joaquin River Management
The California Legislature established the San Joaquin River Management Program (SJRMP) in 1990 to identify some of the pressing water-management and water-quality problems in the San Joaquin River. A Water Quality Subcommittee (SJRMP-WQS) was formed to implement solutions to these problems. The SJRMP-WQS is currently made up of representatives from the California Department of Water Resources (DRW), Lawrence Berkeley National Laboratory and California Regional Water Quality Control Board. In 1994 the SJRMP-WQS was awarded a U.S. Bureau of Reclamation Challenge Grant to demonstrate that improved management and coordination of tributary releases and agricultural drainage contaminant loads from west-side sources could significantly reduce the frequency of violations of water-quality objectives for salinity, selenium and boron on the main stem of the San Joaquin River.
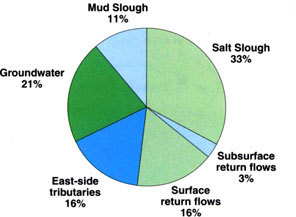
Fig. 1. Sources of total dissolved solids (TDS) contributed to the San Joaquin River for water years 1985–1994.
The SJRMP-WQS identified the need to develop a decision-support system. This system would provide current flow and water-quality data and forecasts of river assimilative capacity for selenium, boron and salinity to decision makers. The system would interrogate existing monitoring stations that continuously measure flow and water-quality parameters, using telemetry equipment to allow rapid access to current data and using computer models to make reliable forecasts of future flow and water-quality conditions. These forecasts would be useful for timing and coordinating west-side flows and contaminant loads from agricultural fields, wetlands and wildlife refuges with east-side reservoir releases for salmon migration, recreation, power and water quality. The SJRMP-WQS hired Systech Engineering Inc. to design a Microsoft Windows-based user interface for the forecasting model. The interface was to be simple and understandable to the novice user and capable of uploading the data necessary to run the model.

Fig. 3. Flow and salinity monitoring network for the lower San Joaquin River between Highway 165 (near Stevinson) and Vernalis.
The SJRMP-WQS limited the water-quality parameter of concern to electrical conductivity because EC can be monitored continuously with commercially available sensors, whereas the technology is not yet available to monitor selenium and boron concentrations. The U.S. Bureau of Reclamation Challenge Grant required that the project demonstrate the utility of the final product.
Real-time monitoring
The SJRMP-WQS identified 14 sites for continuous monitoring of flow, EC and temperature along the San Joaquin River and its tributaries. These monitoring sites, with the type of data collected at each site, are listed below:
Primary (existing)
-
Mud Slough in Kesterson Wildlife Refuge, near Gustine (EC, flow, temp)
-
Salt Slough at Highway 165 Bridge (EC, flow, temp)
-
Merced River near Stevinson (EC, flow, temp)
-
Tuolumne River at Modesto (flow)
-
Stanislaus River at Ripon (EC, flow)
-
Stanislaus River at Orange Blossom Bridge (flow)
-
San Joaquin River at Crows Landing Bridge (EC, flow, temp)
-
San Joaquin River at Vernalis Bridge (EC, flow, temp)
-
Grasslands Bypass opposite Pond 7, Kesterson Reservoir (EC, flow, temp)
-
Orestimba Creek (EC, flow)
Secondary (not yet installed)
-
San Joaquin River at Newman Bridge (flow)
-
San Joaquin River at Lander Avenue Bridge (EC, flow, temp)
-
Patterson Irrigation District diversion from San Joaquin River (flow)
-
West Stanislaus Irrigation District diversion from San Joaquin River (flow)
The first 10 stations on the list are located at primary sites that are essential for water-quality forecasting (fig. 3). The last four stations are at secondary sites that will help improve the reliability of flow and water-quality forecasts once they are installed.
The sensors deployed at each site collect stage, EC and temperature data. At each station, discharge is calculated from stage readings with the application of a rating curve, which specifies the stage-discharge relationship and applies any curve shifts to take account of changes in river hydraulics or bed configuration. Dataloggers and cellular telephones are used at each station to record data at 15-minute intervals and to transmit the recorded data to computers at the USBR, DWR and the U.S. Geological Survey (USGS).
Real-time management principles
Using the hydrologic year 1993 as an example, the San Joaquin River assimilative capacity for salts was plotted as an area graph (fig. 4). The river assimilative capacity depicted by the graph is shown as positive from October 1992 through February 1993, negative from March through April, positive from May until June, negative in July and positive in August and September of 1993. Eliminating the negative peaks requires a shift of the excess salt loading to periods when river assimilative capacity is positive. Discharging salts earlier in the nonirrigation season during water year 1993 might have allowed compliance with EC objectives (fig. 5). A practical application of this strategy might be an early release of ponded water by refuges and duck clubs in the Grassland Water District. Early release and refilling of refuges and duck clubs would increase the salt loading during February and reduce the average EC of the ponded water for release during March and April. This strategy might also benefit wildlife by making more food available to birds during February at the margins of the draining ponds.
To improve communication among individuals involved in decision making related to water quality on the San Joaquin River, the SJRMP-WQS set up an electronic listserv on a USER DataGeneral workstation. The listserv forwards e-mail sent by one person to everyone who has subscribed to the service. The listserv currently has more than 60 subscribers representing more than 15 agencies and organizations. Information posted on the listserv includes weekly updates of past flow and water quality on the San Joaquin River, current water-quality forecasts, notices of meetings and experiments and notices of major actions that might affect flow or water quality.

Site H: The San Joaquin River upstream from the confluence with the Merced River.
SJRIODAY model
The decision-support system developed by the SJRMP-WQS contains a graphical user interface and a daily mass-balance model that calculates daily flows and concentrations of total dissolved solids (TDS), boron and selenium for a 60-mile reach of the San Joaquin River from Highway 165 to Vernalis. The original version of the model, SJRIO, and the database created to run the model were used in developing water-quality objectives and in evaluating agricultural drainage reduction strategies to meet these objectives. The SJRIO was modified to run on a daily time step so that it could be used with real-time flow and water-quality data on the San Joaquin River. An extensive database has been assembled, with data for water years 1977 through 1996, to run the model.
The daily model, SJRIODAY, contains the following tributary river segments:
-
5 miles of the Merced River below the USGS gauging station near Stevinson
-
15 miles of the Tuolumne River below the USGS gauging station at Modesto
-
9 miles of the Stanislaus River below the DWR gauging station near Ripon
-
6 miles of Salt Slough below the USGS gauging station near Stevinson
-
9 miles of Mud Slough below the USGS gauging station near Gustine
-
Several miles of three west-side tributaries: Del Puerto, Orestimba and Hospital/Ingram creeks

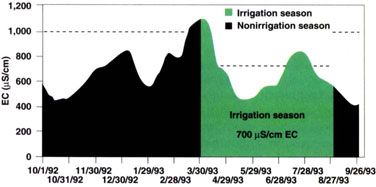
Fig. 5. Electrical conductivity (EC) for San Joaquin River at Vernalis showing 30-day running average EC objectives, 1993.
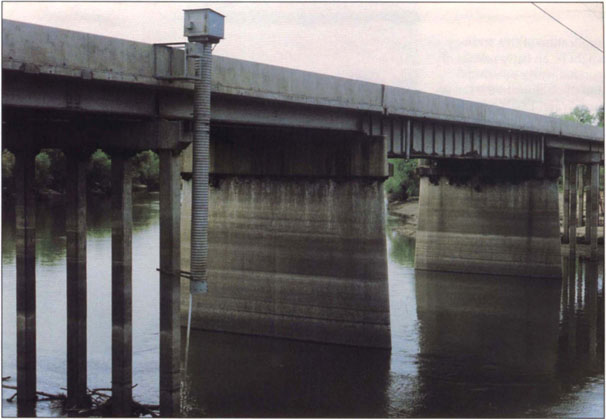
Site N: San Joaquin River at Crows Landing Bridge. The box contains a datalogger for the sensors, which measure electrical conductivity and height of the river.
Daily flow calculations use the concept of mass balance and the assumption of fixed lag times between tributary nodes on the main stem of the San Joaquin River. Both historical and current real-time data are used to establish initial conditions for model runs and to generate a 2-week forecast of flow and EC. The validity of the first week can be judged based on real-time data available for the San Joaquin River at Crows Landing and Vernalis. Discrepancies between modeled and observed data can then be used to update and correct input data for the next model run.
Forecasted rainfall can be used to account for additional runoff in the basin. Real-time data is supplemented by mean monthly flow and water-quality data for model components for which no real-time data is available, including groundwater, riparian and appropriative diversions, surface and subsurface agricultural return flows, riparian evapotranspiration, evaporation and precipitation. These components are estimated in the model based on seasonal variability and water-year classification provided by the modeler.
Model results for this 2-week period represent a model estimate of flow and water-quality conditions based on forecasted data. Validity of these results cannot therefore be judged at the time the run is made; results can be judged only as real-time data become available. For the end user to appraise the validity of the model, flow and EC forecasts for major model inputs and other model assumptions are provided, together with model results.
Results from model runs were posted 2 weeks in arrears during 1996, providing a retrospective of model performance and allowing the SJRMPWQS to develop a working knowledge of operations in the San Joaquin system. To provide time for users to evaluate the merits of the model and to prevent them from acting in an uncoordinated manner on the information provided, water-quality forecasts have not been made available to users immediately.
Graphical user interface
There are two versions of the graphical user interface (GUI). The general version for water operators has the capabilities to edit and upload operational schedules of reservoir releases, to download the results of computer runs using the forecasting model and to display the output from these runs. This version does not allow the user to make a full model run. The full version of the GUI has the same capabilities as the operators' version but also allows the user to download monitoring data and to run the forecasting model SJRIODAY. Weekly water-quality forecasts for the San Joaquin River have been made by the SJRMP-WQS since January 1996.
The GUI is typically used to make flow and water-quality forecasts according to the following sequence of operations:
- 1.
Acquire operational schedule from water managers, including reservoir operators, wetland managers, agricultural water district managers and fishery biologists who are responsible for setting fish flow schedules.
- 2.
Acquire real-time flow and water-quality data by telemetry to serve as initial conditions for the water-quality model.
- 3.
Forecast water-quality conditions with SJRIODAY, using the forecasted operational schedule obtained in (1) and the initial conditions obtained in (2).
- 4.
Display forecasted water-quality conditions to show pulses of water passing various points in the San Joaquin River.
- 5.
Evaluate whether the water-quality objectives are met at various points and times.
- 6.
Display the assimilative capacity of the San Joaquin River for salt at various locations and times.
- 7.
Provide information to water managers to help adjust operating schedules to meet water-quality objectives. Alert other managers to these operational changes and redo forecast of water-quality conditions.
Model results and forecasts
Forecasts of flow and water quality at Vernalis have been made weekly since November 1995 and a postaudit of forecast accuracy has been broadcast on the electronic listserv, comparing the forecasts with observations obtained from the real-time monitoring system. Figures 6 and 7 show the performance of the forecasting model for predicting flow and TDS at Vernalis. As might be expected, the observed and model-simulated flows at Vernalis and the observed and simulated TDS concentrations and assimilative capacities are in closer agreement for the 1-week forecast than for the 2-week forecast. The model performed well during most of 1996 and in particular during the summer months, when flows and water quality on the San Joaquin River were dominated by agricultural drainage from Mud and Salt sloughs (fig. 6). In general, the model tends to overestimate flow as well as EC.
Between Dec. 25, 1996, and Jan. 25, 1997, the San Joaquin Valley was subjected to severe winter storms, which produced an extraordinary volume of runoff from the east-side Sierran watersheds. Figure 7 illustrates the problems encountered in making accurate flow forecasts during this period. Without an accurate watershed model, runoff forecasts were based on estimates of the flood hydrograph from each contributing watershed and realtime flow data. Although both model and forecast flows continued to overestimate real-time flows between Jan. 14 and Jan. 25, 1997, leavee breaks along the San Joaquin River diverted considerable flood flow and may account for much of the error. The dominance of east-side tributary flows on San Joaquin River water quality during this period made the EC somewhat easier to predict with accuracy. Model and forecast EC are not significantly different from the real-time EC data (fig. 7).
How to use the San Joaquin River Input-Output model

Fig. 1. Graphical user interface for the flow and water-quality forecasting model SJRIODAY. The river achieved compliance with the Vernalis salinity objective of 618 mg/L at all points downstream of Del Puerto Creek on Feb. 21, 1993.
When the graphical user interface (GUI) of the San Joaquin River Input-Output model is opened, a map of the San Joaquin River system is displayed on the computer screen. Nodes depicting major tributaries, diversions and compliance points are represented by red dots. According to the Microsoft Windows convention, a horizontal menu bar contains pull-down menus. The user can click the cursor on any part of the map to recall the data. By clicking on the red dots, the user can view either observed or simulated flow information at that site or obtain concentrations or mass-load information for selenium, boron or total dissolved solids.
The Communication menu contains routines to upload operational schedules or to download model results. Reservoir operators can enter daily schedules of diversions and discharges and upload these schedules every 2 weeks to the person making the flow and water-quality forecasts. Similarly, this person can download operational schedules from agencies where timely data is routinely posted to a public ftp site. An ftp site is a computer with file transfer protocol (ftp) access. A user can dial up and connect to the site, then download (obtain) or upload (provide) flow and water-quality data.
With the Criteria menu, the user can specify the color code used to display the spatial variations of water quality. Numeric values can be altered in the Criteria menu and used to recalculate assimilative capacity for EC, selenium and boron. Results from model runs can be viewed as a time series or by spatial location. When Time Series is selected, the user can select Flow, TDS, Boron or Selenium. If the user clicks consecutively on TDS, Flow and a location on the map, flow and TDS concentrations are graphed for a 3-week period. When Spatial is selected, the user can choose from Flow, TDS, Boron and Selenium. The interface shows the river system with each river reach colored either green (below objective) or red (above objective). In the case of salinity, the concentration objective for the nonirrigation season is 618 mg/L (1,000 μS/cm EC). When the EC in the river is above the threshold value of 618 mg/L, the river segment is colored red. Below the threshold concentration, the river is colored green.
The user can scroll through a display of dates, viewing the temporal variations of water-quality parameters at any map location and can display spatial color-coded changes in water quality at any given time. By clicking a time-advance button, the user can create a near-animation of how a slug of poor-quality water moves through the San Joaquin River.


Case study
During early January 1996 the Grassland Water District, which had acquired supplemental water under the Central Valley Project Improvement Act, sought an early release of ponded water to reduce the likelihood of downstream salinity impacts and salinity objective violations at Vernalis in the San Joaquin River. The water district requested that the SJRMP-WQS forecast the most advantageous time to make this release. A model forecast made on Jan. 15, 1996, suggested that the combination of high river flows and an imminent rainstorm might provide the necessary assimilative capacity.
The peak wetland release was timed to coincide with the peak flow in the San Joaquin River. Wetland flushing began on Jan. 18 and ended on Feb. 19, with the peak wetland discharge occurring on Jan. 27 (fig. 8). The flow at Vernalis was 2,600 cfs on Feb. 18, and the EC peaked at 806 μS/ cm on Jan. 20 before the arrival of the wetland discharge water. The peak discharge at Vernalis was 5,300 cfs on Feb. 1; the EC at Vernalis declined to 222 μS/cm on Feb. 19 (fig. 8). Because of the rainfall-runoff events in the upper watershed, assimilative capacity was positive in the river throughout the simulation period. The EC objective in the San Joaquin River was achieved during the trial period as well as during the regular wetland discharge period in March and April 1996.

Fig. 8. Flow and EC in the San Joaquin River near Vernalls showing period of peak wetlands discharge, Jan. 15-Feb. 29, 1996.
Future work
The accuracy of San Joaquin River water-quality forecasts could be improved with additional continuous-flow and water-quality monitoring stations in both agricultural water districts and wetland areas in the Grasslands Basin. A greater challenge will be to gain the cooperation of the east-side reservoir operators, wetland water managers and agricultural water districts in manipulating their release schedules. Each institution has its own operating rules that are followed to satisfy the needs of its clients and customers. At the present time, there are few incentives or requirements for these institutions to assist in water-quality management of the San Joaquin River. Policy changes and financial incentives may be needed to foster cooperation from these institutions.
Computer model improves real-time management of water quality

