


All Issues
Intensive land preparation emits respirable dust
Publication Information
California Agriculture 51(2):27-30. https://doi.org/10.3733/ca.v051n02p27
Published March 01, 1997
PDF | Citation | Permissions
Abstract
Respirable dust (RD), defined as particles smaller than 4 µm diameter, was collected at the implement from 29 farming operations performed for furrow-irrigated tomato, corn, and wheat crop production over a 2-year period. Land preparation, such as land planing, ripping, plowing, and disking, produced significantly higher concentrations of RD than most other cultivation operations. Land preparation accounted for 67% of all farming operations, but produced 82% of the RD. The number of operations and the timing of land preparation were responsible for the difference in RD concentrations among the seven 2-year crop rotations. Of the studied crops, tomato and corn were the most intensively cultivated and yielded the highest RD amounts. Soil moisture was an important environmental variable that influenced the amount of dust and the variability in dust concentration from sample to sample. Among the cropping systems studied, those that required more tillage or land preparation to be performed when the soil was driest produced the most RD.
Full text
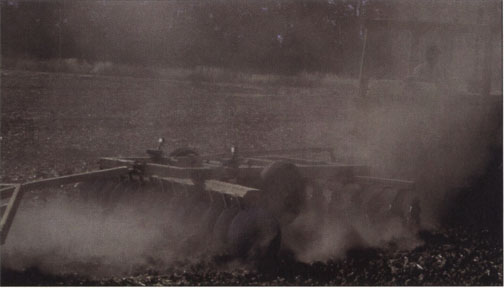
Disking with an open-cabin tractor in the morning after the wheat harvest. Duplicate samplers are visible in the middle of the disk. Scientists measured emissions of respirable dust at the source, not downwind. Concentrations decrease markedly downwind from the source as dust is dispersed in the atmosphere and diluted.
The impact of agricultural operations on dust emissions and air quality is not well known. According to studies by the California Air Resources Board, the air quality in most of California's intensively farmed San Joaquin Valley frequently exceeds the California standard of 50 μg/m3 for a 24-hour average of particulate matter smaller than 10 micrometers in diameter (PM-10).
Dust is a concern to health and environmental professionals because inhalation of elevated levels of mineral dust or a combination of mineral and organic dust, regardless of its source, is associated with well-documented health risks. The respirable dust (RD) fraction is the most dangerous to human health because it reaches the alveolar region of the lungs, where it cannot be removed by the lungs' natural cleaning mechanisms. The RD fraction is composed of atmospheric particles with a cut point of 4 μm (i.e., 50% of the particles have an aerodynamic diameter of 4 μm). This 4 μm size has replaced the 10 μm size as the fraction of greatest concern.
There is little knowledge about how individual agricultural operations affect the amount and composition of atmospheric dust produced. We present data on RD emissions from 2 years of monitoring all farming operations performed on furrow-irrigated tomato, corn, and wheat crops, and compare dust emissions from seven cropping systems.
Sampling site
For this study, we measured agricultural emissions of respirable dust and the influences of climate, soil and implement conditions on RD production. RD was collected at the implement from 29 farming operations for two complete annual crop cycles on the Long-Term Research on Agricultural Systems (LTRAS) plots at UC Davis. The sampling site consists of 72 carefully controlled 1-acre field plots located 6 miles west of Davis. The site is composed of organically and conventionally managed tomato and corn, fertilized and unfertilized winter wheat, a fallow rotation, and a winter-legume cover crop. These systems are arranged in seven 2-year rotations — fallow/wheat, fallow/fertilized wheat, winter-legume cover crop/wheat, fertilized wheat/conventional tomato, conventional corn/tomato, winter-legume cover crop and conventional corn/conventional tomato, and organic corn/tomato.
Several soil series are located at the research site, including Yolo, Brent-wood and Rincon. The texture of the uppermost horizon of the sampling site is clay loam.
Dust sampling
A total of 482 samples were collected with standard personal cyclone samplers mounted directly on each implement. The cyclone's cylindrical design results in a spiraling motion that separates fine and coarse particles. The cut point of the particle fraction collected on the filter is controlled by the flow rate of the vacuum pump that draws air through the filter. Sampling near the dust source measured the relative RD production from each operation, but did not measure dust concentration downwind from the source.
Agricultural operations that generated RD were classified into two broad groups: those involving soil-implement interactions, such as soil preparation, in which RD was primarily inorganic, and those involving plant-implement interactions, such as wheat and corn harvest, in which RD was mainly organic. Duplicate samples were obtained using two samplers attached to each implement in close proximity and at the same height above the ground (average height 38 inches).
Dust amounts
An overview of the 29 farming operations shows the wide range of RD concentrations measured (table 1). The results are sorted according to the timing of the operation (spring through fall) so that comparisons can be made between similar operations at different soil moisture contents. Note that the source emission concentrations far exceed the California standard of 50 μg/m3 and the federal air quality standard of 150 μg/m3. It is important to recognize that we measured emissions at the source, not downwind concentrations. Concentrations decrease markedly downwind from the source as the dust is dispersed in the atmosphere and diluted. Over the two growing seasons, we collected a large number of samples under a variety of soil conditions for each operation, exsuring that the average RD concentrations are representative of the emissions from each operation.
Several operations involving different crops were combined due to similarities of the implement. Land-preparation operations (land planing, ripping, plowing and finish disking) generated the highest RD concentrations (fig. 1). The corn harvest also ranked high, due to the high plant biomass, dryness of the plants at the time of harvest, and dust that had collected on the leaves over the growing season.
Climate and soil conditions had a dramatic influence on dust production. High coefficients of variation for certain operations — such as harrowing, cultivation, seeding and stubble disking — resulted from sampling over a wide range of environmental conditions (fig. 1). The disking of stubble into the soil, for example, included disking of vetch/pea in spring, wheat stubble in midsummer and corn stubble in fall. Soil moisture measurements prior to these operations ranged from less than 1 to 18% (table 1). Other climatic variables, such as humidity, wind speed and soil and air temperatures, also ranged widely throughout the sampling period. Operations with low coefficients of variation, such as ripping, plowing and wheat harvest, were performed over a narrower range of soil and climate conditions.

TABLE 1. Average respirable-dust concentration from farming operations collected at the source March 31, 1994, to Nov. 22, 1995

Land planing at noon on April 20, 1994, for the furrow-irrigated land preparation. Over the two growing seasons, a large number of dust samples were collected from each operation under a variety of soil conditions.

Tomato harvest at noon on Sept. 9, 1995. Conventionally managed tomato crops more than doubled dust production, while cultivation of organically grown tomatoes increased respirable dust 3 1/2 times over fallow fields.
In comparing land-preparation operations with cultivation and harvest operations for all seven crop and management systems, we found that on average, land preparation accounted for 67% of all operations but produced 82% of the RD. Conversely, cultivation and harvest accounted for 33% of the operations but produced only 18% of the RD. Depending on the crop, the percentage of total operations involved in land preparation ranged from 53% for the wheat crops to 80% for the winter-legume cover crop. The percentage of the total RD that came from land preparation ranged from 75% for the wheat crops to 96% for the winter cover crop. In every case, land preparation accounted for a disproportionate amount of the total RD for the crop.
Land preparation requires much more implement contact with the soil than cultivation and harvest, accounting for the greater RD emissions. In particular, the land leveling necessary for furrow irrigation adds considerably to the RD emissions from each cropping system. Another reason for the difference in RD production is that the soil-moisture content is usually higher during cultivation (up to 10%) than during land preparation, when soil moisture is usually less than 7%.
Comparing cropping systems
RD production for the 1994 growing season varied significantly for the seven cropping systems as a function of the number of operations and various environmental influences (fig. 2). Fallow fields were disked five times in 1994 to discourage weed growth.
Using the fallow RD index as a baseline, a winter-legume cover crop nearly tripled the amount of dust produced. The wheat and the conventionally managed tomato crops more than doubled dust production, while cultivation of organically grown tomatoes and conventionally grown corn increased RD three and a half times over the baseline. Cultivation of organically managed corn caused the greatest increase in RD, more than four times baseline.
The differences in RD production among cropping systems were mainly due to inherent plant-growth characteristics and the number of operations performed. The inherent crop differences are especially evident in the comparison of the corn and tomato crops, which involved a similar number of operations. The corn crop produced approximately 20% more RD than the tomato crop, chiefly because of higher plant biomass and dryness during harvest, as well as additional postharvest operations. Of the studied crops, tomato and corn were the most intensively cultivated and yielded the highest RD amounts.
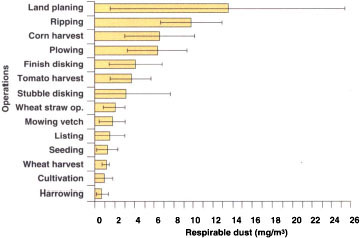
Fig. 1. Average respirable-dust concentrations and their standard deviations from 14 farming operations.
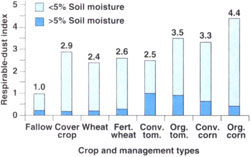
Fig. 2. Index of potential respirable-dust production over the 1994 growing season for different crop and management types relative to fallow fields disked five times. Each bar represents the sum of the RD concentrations of all operations for a particular cropping system, indexed with reference to fallow fields.
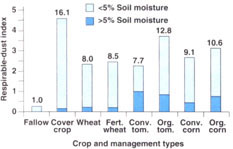
Fig. 3. Index of potential respirable-dust production over the 1995 growing season for different crop and management types relative to fallow fields disked twice.
In addition to the total number of operations, the number performed during the dry season is clearly a major influence on RD production. Comparing the winter-legume cover crop with fallow fields, we found that the greater number of operations during the dry season accounted for the tripling of RD production from the cover crop even though the actual number of operations only doubled. A comparison of RD production from wheat and conventionally managed tomato crops demonstrates the combined influence of operating during the dry season and crop differences. The two crops had similar RD index values, even though the wheat crop requires only two-thirds as many farming operations. This is because a higher percentage of wheat operations were done during summer and the wheat crop has higher plant mass and dryness than the tomato crop.
The seasonal influence is further illustrated by the 20% increase in RD production from organically grown corn and tomato crops compared to their conventionally grown counterparts. This increase can be attributed entirely to the delayed cultivation schedule of the main crop due to the time necessary for incorporation and decomposition of the preceding winter cover crop, which serves as a fertilizer source.
Additional disking and land-preparation operations caused the total RD concentrations to go up significantly in 1995 compared to 1994 (figs. 2 and 3). The weather in the Sacramento Valley in 1995 was unusual in that the winter rains lasted well into the month of May, so the cultivation of crops had to be managed differently. Fields required additional disking and land planing to work the soil into a manageable condition. As a result, the index numbers are higher overall for 1995. Otherwise, relations between the different crop and management systems are similar to the 1994 season, except for the winter-legume cover crop and the organically grown tomatoes. These crops were strongly affected by adverse soil structure in 1995 and had to be tilled more often.
The high RD production of the winter cover crop in 1995 was caused by disking the plots 13 additional times and land planing them eight additional times as compared to 1994. The winter wheat required only one additional disking and two additional land-planing operations to improve soil structure. The conventionally grown corn and tomato crops had some additional tilling operations done during the wet spring in the fallow period.
In the organically grown crops, all operations related to soil structure improvement were performed in the dry fall. The organically grown corn was disked five times and land planed only once in the fall, while the organically grown tomatoes had four disking and three land-planing operations. As a result, the organically grown tomatoes had a much higher RD production. As in 1994, the organically grown crops produced more respirable dust than their conventional counterparts. The RD increase relative to conventionally grown crops ranged from 15% for the organically grown corn to 40% for the organically grown tomatoes.
Conclusions
Respirable dust emissions differed significantly among the 29 sampled farming operations. The highest RD concentrations were produced by intensive land-preparation operations (land planing, ripping, plowing and disking) and certain harvest operations (i.e., tomato and corn harvest). In addition to the type of operation, the timing of farming operations, particularly with respect to soil-moisture content, affected the amount of RD produced. Operations done in the summer when soil moisture was low produced more RD than the same operations done when the soil was wetter.
Different cropping systems also affected RD emissions. Although management systems using winter cover crops can have advantages for sustainable crop production, they require special attention in California's semiarid Mediterranean climate, where they resulted in higher RD production. We found the RD associated with a winter cover crop to be approximately 20% higher than without cover crops in 1994, when a dry spring resulted in delayed spring cultivation of the main crop. In 1995, a growing season with a very long wet period in the spring, additional soil tillage in the dry fall raised RD production ranging from 15 to 40%.
The RD concentrations presented from each farming operation should enable estimation of the RD production for other furrow-irrigated crops grown under similar conditions (i.e., Mediterranean climate and soil texture of the uppermost horizon, predominantly clay loam). RD production for different crop rotations could be calculated as well.
Intensive land preparation emits respirable dust

