


All Issues
Wholesale nursery surveys reveal inventory, customers and business practices
Publication Information
California Agriculture 50(5):16-21. https://doi.org/10.3733/ca.v050n05p16
Published September 01, 1996
Abstract
The California greenhouse and nursery industry is the second most important agricultural commodity in the state and the leading producer in the nation. Surveys in 1989 and 1994 collected information from wholesale nurseries regarding basic characteristics and the way they conduct business. Results show that more new nurseries were started between 1983 and 1988 than during the following 5 years. Over that same time period, nurseries employed fewer permanent and more temporary personnel. The surveys reflect the diversity of the California nursery industry, which produced a wide range of landscape plant categories, none of which accounted for more than 18% of overall sales. More than 80% of nursery products are grown in containers, and the majority of California nursery products are sold within the state.
Full text
Environmental horticulture encompasses the industries that maintain and improve the functional use of plants in populated areas. Major categories include the production of ornamental plants, services related to ornamentals, and equipment and accessories. California's environmental horticulture industry has an annual economic activity of more than $7 billion, as reported in 1991, and is serving about 29 million urban residents.
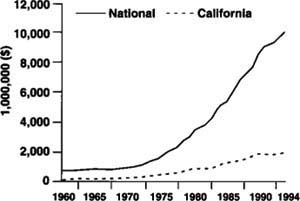
California's nursery and greenhouse industry leads the nation's production with cash receipts of $1.9 billion in 1993. The value of cash receipts steadily increased for two decades starting from the 1960s, but more than doubled for the California industry from 1980 to 1990 (fig. 1). The value of nursery-stock sales subsequently decreased slightly, leveling off in 1993. In 1975, the industry started to boom nationwide as part of the “green” industry — ornamental plant production and related service, equipment and accessories businesses — which is considered the fastest growing segment of agriculture. California's contribution to the industry's national cash receipts hovered around 25% from 1971 to 1981, and maintained 23% until 1990. According to the California Department of Food and Agriculture, 8,843 nursery licenses were sold during 1993 and 1994, similar to the number during 1988 and 1989. These numbers include backyard operations as well as nurseries selling several million dollars of product per year.
California is also headquarters for the nation's three largest nurseries, based on recent years' sales. Nursery production is notably diverse and includes materials such as potted plants and flowering foliage, woody deciduous and evergreen ornamentals, bedding plants, bulbs, roses, propagation material and herbaceous perennials.
National and statewide statistics of the nursery industry provide limited information regarding detailed nursery characteristics, production methods, product flows, and business practices of nurseries. This information would be very useful to nurseries and related industries in environmental horticulture, and to government, research and extension personnel as support for decision-making processes, but it is difficult to obtain. Many nurseries produce large numbers of a wide diversity of plant species and much of the data is considered proprietary. The objective of this article is to summarize some California results of surveys conducted in 1989 and 1994 to determine trade flows and marketing practices within the U.S. wholesale nursery industry.
A questionnaire was developed by members of the Southern Regional Research Committee (S-103) to determine the primary plant categories produced, production methods, top destinations of products sales, methods of transportation, and constraints that limit the geographic scope of trade. One of the primary goals of the surveys was to delineate the interstate trade flow for nursery products. Other information collected but not summarized here includes transaction methods used, price determination practices, and resources allocated to advertising.
The mail survey was conducted in 23 states in 1989 and in 24 states in 1993. Each state administered the survey in a slightly different way. In California, questionnaires were sent out by the California Association of Nurserymen to members operating wholesale nurseries. Surveys were mailed in the springs of 1989 and 1994 and asked questions regarding business practices during the previous year. Questionnaires were mailed to 450 nurseries in both years; 131 responded in 1989 and 52 in 1994.
Based on results of the 1989 survey, questions were refined for the 1994 survey. Some sections were clarified and strengthened in the second survey and questions with unsatisfactory results were eliminated.
California nurseries that responded to the survey were grouped into three categories based on gross value of product sales. Small nurseries had a sales volume up to $99,999; medium nurseries had between $100,000 and $999,999; and large nurseries had $1,000,000 or more per year. In 1989, nurseries were well represented in each category, with 45 small, 43 medium, and 43 large. The lower response rate in 1994 provided less balance with only 9 small, 23 medium, and 20 large nurseries returning surveys. Because the following results represent only a small portion of the wholesale nursery industry, they should be interpreted with caution.
Survey results between nursery size categories and between the 2 years of survey cannot be compared statistically. We are presenting characteristics and marketing information about the California nursery industry based on the surveys of nurseries that operate wholesale businesses, are members of the California Association of Nurserymen, and that responded to the mail questionnaires.
Basic characteristics
Age
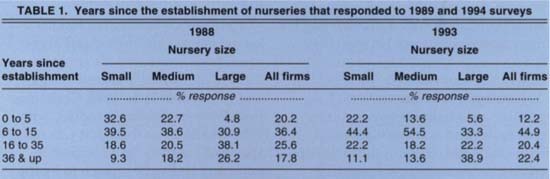
Sorting nurseries by age groups, one-third or more of the respondents represented nurseries 6 to 15 years old (table 1). The remaining categories accounted for approximately 18% to 26% of the respondents, except for the 0-to-5 age group in 1993, which accounted for only 12%.
These data show a decline in the establishment of new nurseries between the two surveys, reflecting the relatively strong national economic conditions from 1983 to 1988 when more new businesses were started, as opposed to the 1988–1993 period, which included a lengthy recession and extremely slow recovery. Responses from other states also indicated a general trend of fewer new nurseries started during the 5 years preceding the 1994 survey in contrast to the 1989 survey.
Employees
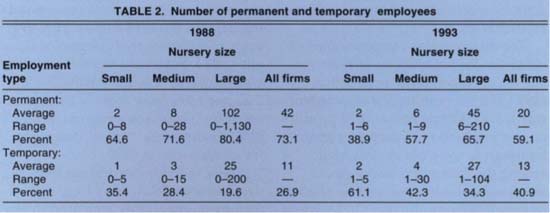
California nurseries surveyed in 1989 had an average staff of 53, with nearly three-fourths permanent employees and just above one-fourth temporary employees (table 2). In the 1994 survey, the average staff size was significantly smaller at 33, and only 59% of these employees were permanent staff members. This is indicative of a general trend in the economy, where businesses tend to hire more temporary and part-time employees to avoid the additional costs associated with permanent employees. Large nurseries employed more permanent staff and often had a more stable workforce because they have a larger capital base to invest in experienced and skilled workers.
California's nursery industry:
-
Total value of nursery stock sales (excluding floral products) increased from $919 million in 1988 to $1.6 billion in 1991.
-
Only 1% of California crop land was used to generate a total value of $1 9 billion nursery / greenhouse cash receipts in 1991.
-
Greenhouse and nursery production is the second most important commodity following dairy production in the state.
-
Leading counties in nursery valuation in 1993 as reported by the County Agricultural Commissioners are:
-
1. San Diego ($553,277,700)
-
2. San Mateo ($162,569,000)
-
3. Los Angeles ($145,594,000)
-
4. Orange ($116,459,600)
-
5. Monterey ($116,341,000)
-
6. Ventura ($104,648,000)
-
-
Individual nurseries produce as many as 1,000 different species of plants.
-
More than 80% of nursery stock is produced in containers.
Acreage (1994 survey only)
A positive correlation between nursery gross sales and acreage was found, with small and medium nurseries operating on an average 4.2 and 10.0 acres, respectively, and large nurseries on 69.5 acres.
The different size nurseries allocated similar percentages of their acreage for open-container production (46%) and for buildings and infrastructure (13%). Allocations to field production or production in shade- or greenhouse areas were not as universal among the different nursery sizes. Small nurseries tended to favor shade- or greenhouse production (26%), while medium-sized nurseries generally emphasized field production (27%). Large nurseries devoted similar acreage (19%) to both types of production.
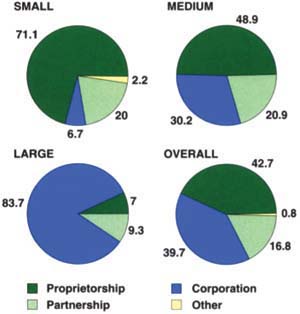
Form of business organization (1989 survey only)
Nursery firms responding to the 1989 survey were either proprietorships or corporations. Partnerships accounted for less than one-fifth of the nurseries (fig. 2).
There were significant differences in organization among the different three nursery sizes. Small nurseries were far more likely to be proprietorships than any other form of business, followed by partnerships and a small number of corporations. Medium nurseries had more breadth in their organizational structure — half were proprietorships, one-third were corporations and one-fifth were partnerships. Large nurseries were predominantly corporations, and only a small number were listed as partnerships or proprietorships. The tendency for small nurseries to be proprietorships and large nurseries to be corporations most likely stems from natural advantages that each type of organization provides, and may be part of an overall evolution of nursery firms as they grow from small, family-oriented businesses into more complex operations with more partners and additional resources.
Plant inventory and sales
Herbaceous perennials, broad-leaved evergreen shrubs, and evergreen trees accounted for about one-third of all plants produced in 1988 and 1993 (table 3). In 1988, Christmas trees were the leading product, with 18% overall, even though it was not a specified category on the questionnaire and had to be written in by the respondents. There are no corresponding data for the 1994 survey. However, since a Christmas tree category was not added, but a new “other” category was available, it is likely that Christmas tree sales were included and account for a significant portion of the 21% of sales in the “other” category for all nurseries in 1993.
Trees, including evergreen trees, deciduous and flowering trees and fruit trees, apparently increased in importance for small and medium nurseries, which doubled their percentage of sales from 1988 to 1993. The opposite trend emerged for large nurseries; the percentage of total sales declined from 37% in 1988 to 17% in 1993.
Shrubs — including broad-leaved, narrow-leaved evergreens and deciduous shrubs — accounted for similar percentages of sales for all nurseries for both years, with 29% of sales in 1988 and 22% in 1993. Small nurseries sold more shrubs than other-sized nurseries, accounting for the largest proportion of this plant category in both years.
Herbaceous perennials comprised the fastest-growing plant category and sales increased by 10% for large nurseries over the 5-year period. Medium nurseries sold the same percentage of herbaceous perennials both years, but sales declined slightly for small nurseries from 1988 to 1993 (table 3). Herbaceous perennials were the fastest-growing segment of nursery sales nationwide. The percentage of total sales of these plants in California was the fourth highest in the nation in 1993, following Connecticut, Maryland and Georgia. Sales of herbaceous perennials in California more than doubled from $10.4 million in 1992 to $22.4 million in 1993.
Propagating material accounted for 9% and 19% of sales for small nurseries in 1988 and 1993, respectively. This category of plants was of little importance to medium and large nurseries (table 3). Vines and ground covers were most important for medium nurseries both years, and decreased in importance for both small and large nurseries over the 5-year period.
Overall, between 1988 and 1993, the percent sales declined for only three plant categories: vines and ground-covers, narrow-leaved evergreen shrubs, and broad-leaved evergreen shrubs. In 1988, the first two of these categories were between 8% and 10% overall, but 5 years later they had decreased to 3% to 5% of overall sales, not far from the lowest percentages of all plant categories. Broad-leaved evergreen shrubs declined 3% to 4% in sales for small and medium, and 7% for large nurseries.
Sales of evergreen trees, herbaceous perennials and fruit trees changed dramatically for the different size nurseries. Sales of evergreen trees in 1993 more than doubled for small nurseries, increased moderately for medium nurseries, and decreased 70% for large nurseries compared to the percentage sales in 1988 (table 3). Sales of herbaceous perennials declined slightly from 1988 to 1993 for small nurseries, remained stable for medium nurseries, and increased almost fivefold for large nurseries. The sales of fruit trees accounted for 11% of sales for medium nurseries in 1993, but only 4% in 1988. The trend was reversed for large nurseries, where sales of fruit trees decreased from 10% to 3%.
The surveys reflect the diversity of the California nursery industry, which produces a wide range of landscape plant categories, each of which accounted for 18% or less of overall sales. The plant categories listed in the surveys failed to cover the whole spectrum of plants that are produced in California, as indicated by the large percentage in the “Other” category in the 1994 survey and the number of nurseries that found it necessary to write in Christmas trees as a separate category in the earlier survey.
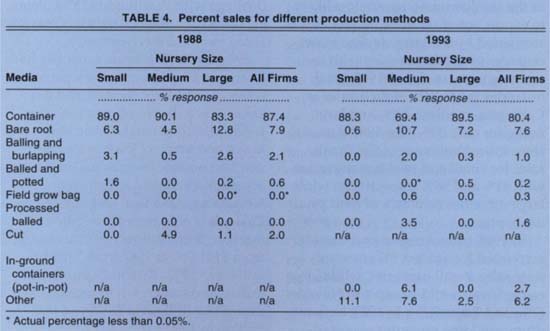
Production methods
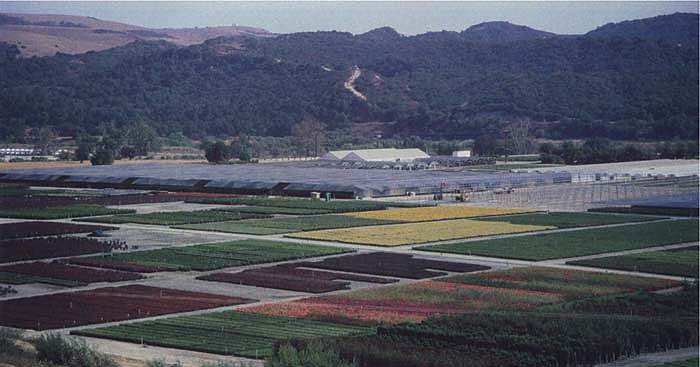
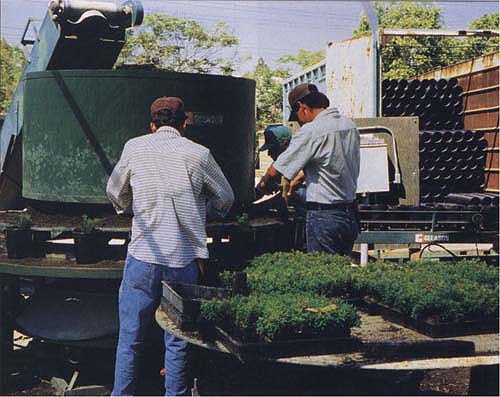
California's role as a leader in container production is reflected in the survey results. Container production accounted for more than 80% of production overall for the California nurseries surveyed in 1989 and 1994 (table 4). The mild climate in the coastal areas, where most nurseries are located, allows plants to grow almost year-round with little necessity for winter protection. Container plants allow for easy transportation due to the low weight of the media, and have a year-round marketing and planting season.
Bare-root production was the only other significant method of production for the nurseries, accounting for 8% of sales in both years.
For medium nurseries, 5% of 1988 sales were cut stock, and 6% in 1993 were produced as in-ground containers. The “Other” category was second most important for small nurseries in 1993.

Top destinations by state
The destination of nursery products showed the dominance of California for both years; 90% in 1988 and 48% in 1993 were sold within the state. The apparent decline is likely an artifact of a change in the wording of the question in the 1994 survey.
Originally, the nurseries were asked to specify the top six destinations of their product. In 1994, the survey asked for the top five states, included an “Other” category, and also added the caveat “if you sell any product outside of your home state” to the question. The new phrasing of the question apparently confused some respondents as the nurseries sometimes specified California sales, and sometimes did not. The percentages given in California's 1994 results are thus low, since it is likely that many of those nurseries that did not answer the question at all sold 100% of their product within the state. This probably explains why only two of the nine small nurseries responded to this question, as the smaller nurseries are less likely to export out of the state. In fact, this is supported by the large decline in percentages of California sales with increasing nursery size in 1993: small nurseries made 94% of their sales in California, medium 58%, and large nurseries only 30%. The 1988 data also shows the dominance of California sales for small and medium nurseries, with 91% and 96% respectively, while large nurseries sold 84% of their product in-state.

More than 80% of California nursery products are grown in containers. Container plants are easy to transport because of the light weight of the media and can be marketed and planted year-round.
In 1988, only Arizona and Canada accounted for at least 1% of out-of-state sales for all nurseries, while large nurseries also sold product in Nevada (2%) and Texas (1%). In 1993, both medium and large nurseries exported more of their goods out of California, with large nurseries encompassing a larger geographical scope. The medium nurseries traded significantly with Nevada, Arizona and Maryland. The large percentage of trade with Maryland, however, was a reflection of a single respondent which indicated 60% of its trade was with that state. Large nurseries sold most of their out-of-state products in Nevada (16%) and Arizona (9%), and also had significant dealings with Washington (5%), Pennsylvania (7%), and 22% with nurseries listed in the “Other” category.
In general, California nurseries had a regional bias towards the western states, particularly Nevada and Arizona. Given the transportation costs for exporting to neighboring states are lower and many of these states depend on outside sources for their nursery stock, this is not surprising. Nevada's greenhouse and nursery industry has only recently begun to flourish, with cash receipts increasing from $181,000 in 1987 to about $3.1 million in 1992. Arizona's nursery industry also has grown in recent years from $13.2 million in 1987, to $48.0 million in 1992.
The eastern states that California nurseries trade with are large, populous states such as New York, Pennsylvania and New Jersey. However, other population centers like Michigan, Illinois and Ohio account for none of the trade, except what might be accounted for in the “Other” category. This is probably because there are already large nursery industries in these regions. Indeed, in 1992, Ohio ($470 million) and Michigan ($387 million), ranked as the fourth and fifth largest greenhouse and nursery production states in terms of cash receipts, respectively.
Transportation of product
(1989 survey only)
The most popular method for transporting products in 1988 was via truck. Overall, 93% of nurseries sent their product by truck, with small nurseries using this method slightly less than their counterparts (small: 85%, medium: 97%, large: 98%). Overall, parcel post or United Parcel Service transported 5% of nursery shipments, air freight accounted for 1% and rail was not used at all by the nurseries.
Most of the nurseries owned, rented or leased the trucks (77% overall), with small nurseries following this practice to a lesser extent (69%). Trucks owned, rented or leased by the buyer were second in popularity (17%), with small nurseries (23%) using this method more than medium (13%) or large nurseries (15%). Commercial common carriers were used for only 7% of the shipments.
The vast majority of company truck deliveries were also backhaul deliveries, 93% for all nurseries on average. Bringing back goods on the return trips increases the efficiency of trading and use of transportation resources. Small nurseries had the lowest percentage of backhauls, with only 88%, as opposed to 95% for medium and large nurseries.
Most nurseries have a maximum delivery radius (74% overall, and 69% for small, 87% for medium, and 67% for large nurseries). The average radius increases with size: 70 miles for small nurseries, 106 miles for medium, and 211 miles for large nurseries. The radii ranged from 5 to 500 miles for small, 10 to 750 miles for medium, and 2 to 1,000 miles for large nurseries.
The workforce in California nurseries decreased from an average of 53 employees in 1988 to 33 in 1993. Temporary or part-time employment increased from 27% to 41%, according to surveys conducted in 1989 and 1994, respectively.
Limitations to expanding trade
Capital and market forces were considered the most important limitations overall in 1993, both with average scores of 2.7 (table 5). Five years earlier, the emphasis was also on capital (included in 24% of the responses), but the market was not nearly as significant a limitation (table 6). In fact, market demand, development, competition or consumer knowledge were rated among the least limiting factors for geographical expansion of trade in 1988.
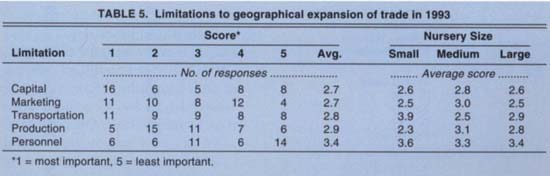
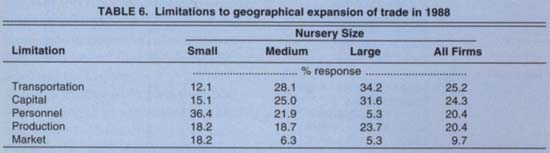
Transportation was ranked third after capital and the market in 1993, while ranking as most important in 1988 for medium and large nurseries (tables 5 and 6). In 1993, transportation was of less importance to large nurseries. Transportation restrictions include freight costs, number of trucks and drivers available and transportation accessibility.
Production was listed as the fourth, but still important factor setting geographic boundaries for expansion of trade in both years surveyed. Limited supply of product, insufficient inventory, product perishability, climate or lack of product adaptability are all aspects of nursery production preventing expansion. Personnel scored as the least important limiting factor in 1993 across all nursery sizes, while it ranked even with production in 1988. At that time it was perceived as the major obstacle for small nurseries, of average importance for medium nurseries, and not a limitation for large nurseries.
Summary of survey results
Results of the 1989 and 1994 surveys of the California wholesale nursery industry indicate that production method, diversity of plant categories that are produced, and the high demand for California nursery products within the state seem to be stable factors. They are primarily dictated by the climate and the large urban population in the state. The less favorable economic conditions preceding the 1994 survey affected the number of new nurseries established, the ratio of permanent and temporary employees, and raised the market to an important factor limiting geographic expansion of nurseries. Plant categories are always changing in popularity and growers need to follow these trends carefully to project the changing market demands. The nursery industry is expected to continue to grow in the next decade, and information from these surveys can be used by decision makers to anticipate future needs and expansion in this industry.
Wholesale nursery surveys reveal inventory, customers and business practices

