


All Issues
Airborne imaging aids vineyard canopy evaluation
Publication Information
California Agriculture 50(4):14-18. https://doi.org/10.3733/ca.v050n04p14
Published July 01, 1996
Abstract
During the 1993 and 1994 growing seasons, airborne digital sensors were used to collect visible and near-infrared images of phylloxera-infested vineyards near Oakville in Napa County. Computerized processing enhanced the information content of the images with respect to leaf area of the canopy. Processed image values were strongly related to ground measurements of vine pruning weight and leaf area made within a 12-acre study site. The images were useful for mapping patterns of leaf area throughout the site and in surrounding vineyards, and for assessing year-to-year changes in canopy. The vineyard manager found the imagery valuable in planning for replacement of phylloxera-infested fields, managing for crop uniformity and segregating grapes of differing quality during harvest. This tool was particularly useful in evaluating and managing newly acquired property.
Full text
Many grape growers routinely use interpretation of color-infrared aerial photographs as a vineyard monitoring tool. The aerial view reveals growth patterns that may not be obvious from ground level, helping growers to locate and more effectively manage problem areas and to assess year-to-year changes in management practices.
Investigators at NASA/Ames Research Center in Mountain View, in collaboration with UC Davis, UC Cooperative Extension, California State University at Chico and the Robert Mondavi Winery in Oakville, (Napa County) recently evaluated the use of digital image processing techniques for vineyard assessment. Images collected over the Napa Valley were processed to enhance and map spatial patterns and show year-to-year differences in vineyard canopy size.
As the name implies, the Grapevine Remote-sensing Analysis of Phylloxera Early Stress (GRAPES) project was initiated in response to the grape phylloxera (Daktulosphaira vitifoliae [Fitch]) infestation, which affects a number of California grape-growing regions and is pronounced in the North Coast (California Agriculture March-April 1991). The insect (Biotype B) is a form of plant lice that debilitates the root system, depriving the vine of water and nutrients and posing increased management problems in the form of reduced vine growth, decreased grape yield, retarded grape maturation and lower wine quality. Phylloxera outbreaks tend to appear in satellite locations, adding to management time and cost. The infestation spreads rapidly through the vineyard and vines typically succumb within 3 to 5 years of initial infestation.
Pesticide application is not effective for phylloxera control, due to the deep rooting of grapevines and to the high rate of phylloxera reproduction. No effective biological control agent is known. Management practices (more severe pruning, additional irrigation and fertilization) may lessen phylloxera impact for the short term, but the only long-term solution is to remove the infested vines and replant with a more resistant rootstock. Improved knowledge of the current and potential future extent of phylloxera infestation would enable growers to make better-informed decisions for near-term management and for replanting. The GRAPES project builds on the earlier work of Wildman et al. (1983, Am. J. Enology and Viticulture 34(2):83–94), who used color-infrared photography to monitor phylloxera damage and estimate spread rate.
For aerial observation, the most pronounced symptom of phylloxera-induced stress is decreased vegetative growth. Because canopy reduction is a common stress indicator in perennial and annual crops, we believe that the analysis presented here is relevant to the broader agricultural community.
Measurements & manipulations
Shortly before the 1993 growing season (early May), a partially infested field of Cabernet Sauvignon vines grafted to AxR#1 rootstock was chosen as the study site. Mondavi's 12-acre vineyard near Oakville was planted in 1981 in Clear Lake clay and Bale clay loam soils. The vines were trained on a standard two-wire trellis without shoot positioning. Rows were 12 feet apart, oriented northeast to southwest; within-row vine spacing was 8 feet. The site was clean cultivated with hoe plows and discs.
Nine study plots were established in the study site (fig. 1), each plot consisting of a total of 40 vines (4 rows, 10 vines per row). The plots were delimited on the basis of grower knowledge, a 1992 aerial infrared photograph and a phylloxera survey involving excavation of shallow roots and visual examination of phylloxera population through a hand lens (table 1). Plots 1 through 3 were visually symptomatic, with obvious reductions in shoot length and leaf area and some vines with visible leaf chlorosis. Plots 4 through 6 were infested but visually asymptomatic, and plots 7 through 9 were uninfested. The phylloxera survey showed mean ratings, based on a subsample of nine vines per plot, of 1.5 (plots 1–3), 0.5 (plots 4–6) and 0.0 (plots 7–9). Two Global Positioning System (GPS) receivers were used to determine latitude/longitude coordinates for the study site and plot boundaries. The commercially available receivers computed location by receipt of radio signals from the GPS satellite network, maintained for military and civilian use by the U.S. Air Force.
Vine-leaf area was measured by sampling 14 vines per plot in mid-July and mid-August 1993. The number of shoots on each sampled vine was recorded, then all leaves with widths greater than 0.5 inch were removed from two randomly selected shoots per vine, placed into polyethylene bags and stored in an ice chest. The surface area of each leaf was measured in the laboratory with a LI-COR Model 3100 (Lincoln NE) leaf area meter within 36 hours of collection. Means for per-vine leaf area (ft2) were 57.1 (plots 1–3), 95.0 (plots 4–6) and 91.7 (plots 7–9). Leaf area measurements were not made in 1994. (To a large extent, plots 4–6 were visually asymptomatic in mid-1993. The small difference between leaf area in plots 4–6 and plots 7–9 was not statistically significant.)
Canopy size was affected by management practice throughout the study site in 1993 and 1994. In addition to normal spring removal of suckers, the grower balanced the crop-to-leaf ratio by removing shoots and grape clusters in early July 1993, which resulted in a canopy reduction. During the following dormant season, the grower pruned to a lower bud count throughout the site. The intention was to decrease the number of shoots in 1994 relative to 1993, yet increase shoot length and leaf area per shoot. Midseason shoot removal was not performed in 1994, due to a satisfactory balance between shoots and grape clusters.
In the dormant periods following the 1993 and 1994 growing seasons, pruning weights were obtained for each of the 40 vines in each plot. The pruning weight is the total weight (pounds) of shoots per vine, less a small amount of shoot growth retained to support the following season's growth. Mean per-vine pruning weight in each plot for 1993 was related to mean per-vine leaf area as: leaf_area = 49.1 + 8.0*prun_wt, r2 = 0.58, n = 9. We used the mean pruning weight per vine in each plot (fig. 2) to assess differences in canopy size among plots within season, and also per plot differences between 1993 and 1994. Infested plots 1–6 showed year-to-year declines in pruning weight, presumably associated with continued phylloxera-induced stress. Plots 7–9, which were uninfested or lightly infested, had greater pruning weights in 1994 than in 1993, we believe as a result of the more aggressive pruning. Pruning weights were negatively correlated with midseason phylloxera ratings in both 1993 (prun_wt = 5.8 – 1.5*p_rating, r2 = 0.71, n = 9) and 1994 (prun_wt = 8.4 – 3.5*p_rating, r2 = 0.72, n = 9), suggesting that phylloxera stress influenced canopy size in the study site.
Reconciling different images
Digital sensors were used to collect images over the Napa Valley and vicinity during the 1993 and 1994 growing seasons. The images were recorded as a matrix of numbers on a computer disk rather than on film, each number representing the brightness of each picture element, or “pixel” (minimum resolvable area on the ground). The digital images were computer processed to enhance information content, and were visually examined either on a computer screen or as paper prints.
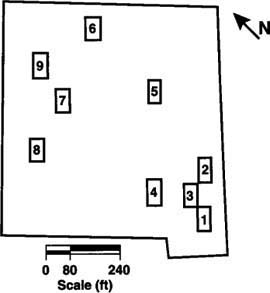
Fig. 1. Map of 12-acre study site, showing position of nine study plots, 40 vines each. At the time the plots were established in May 1993, visual assessments of vine roots determined that plots 1–3 were severely infested, plots 4–6 were lightly to moderately infested and plots 7–9 were not infested.
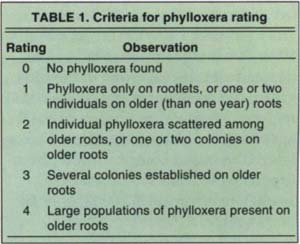
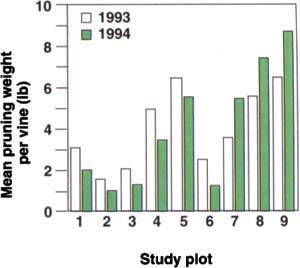
Fig. 2. Mean per-vine pruning weight in each study plot, 1993 and 1994. For 1994 vs. 1993, weights were lower in plots 1–6 due mostly to continued phylloxera-induced decline, and higher in less affected plots 7–9 due to pruning practices described in the text.

Color-infrared images of 12-acre study site acquired by airborne digital sensors on July 28, 1993 (a) and August 1, 1984 (b). High leaf area shown as red; lower leaf area tends toward blue-gray. Images were computer enhanced to improve contrast. Locations of the nine study plots are superimposed.
The Compact Airborne Spectrographic Imager, a commercial scanner developed by ITRES Research (Alberta, Canada), flew at 4,000 feet aboard a light aircraft to collect images over approximately 5,000 acres of vineyard near Oakville on July 28, 1993. The images measured light reflected from the vineyard in the blue, green, red and near-infrared spectral regions. The pixel resolution of the imagery was 6 feet by 6 feet. Two weeks later, film-based color-infrared photographs were collected at scales of 1:6,000 inches and 1:32,000 inches by NASA aircraft.
The GRAPES project was designed in part to evaluate the use of image processing techniques to reconcile images from different sensors having somewhat different imaging characteristics, a situation that might be encountered in practical operation. Therefore a different sensor was flown in 1994: an electro-optic camera, developed and operated by NASA/Ames Research Center. The camera acquired imagery in the green, red and near-infrared regions over a large portion of the Napa Valley and adjoining Carneros region on August 1. Approximately 40,000 acres were imaged in 1 hour near midday by a NASA ER-2 aircraft flying at 65,000 feet. The images had a pixel resolution of 15 feet by 15 feet. At the same time, the ER-2 collected film-based color-infrared photographs at a scale of 1:32,000.
Using image-processing software, the 1993 and 1994 images of an approximately 700-acre parcel including the study site and surrounding area were “ground registered” (a map coordinate was assigned to each image pixel) using a translation based on the GPS map coordinates. The GPS coordinates were also used to delineate the nine study plots in the imagery. The 1993 pixel resolution (6 feet) was degraded to match that of the 1994 scene (15 feet). The software was then used to generate a color-infrared picture from the data, and a contrast enhancement was applied to accentuate canopy patterns within the site (see images a and b above).
Normalized differences
Various combinations of near-infrared and red reflectance have been shown to be sensitive to the amount of photosynthetically active vegetation present in the plant canopy (Tucker, 1979, Remote Sensing of Environment 8:127–150). Reflectance of near-infrared light from plant canopies tends to be positively correlated with the amount of leaf surface area per unit ground area, while reflectance of red light tends to be negatively correlated with leaf area. For this analysis, a normalized difference vegetation index (NDVI) image was generated for both years by calculating for each pixel the quantity
NDVI = (NIR − RED) / (NIR + RED) where NIR and RED are light recorded by the sensors in near-infrared and red frequencies. In addition to leaf area sensitivity, the NDVI tends to lessen the influence of brightness differences associated with solar illumination or sensor viewing angle. In an earlier study (Pearson et al., 1994, Remote Sensing of Environment 49:304–310), NDVI imagery was used to detect stress in a number of high-value annual crops in Wisconsin.
The NDVI generally ranges from near 0.0 for bare soil to near 1.0 for dense canopy. Due to the relatively large proportion of exposed soil found in the study site (typical of vineyards), the mean NDVI for the study plots occupied the low end of this range: 0.19–0.38 in 1993 and 0.13–0.37 in 1994. The 1993 mean NDVI per plot was related to field measurements of leaf area as: NDVI = −0.75 + .56*LOG(leaf_area), r2 = 0.79, n = 9. For the combined 1993 and 1994 data set, the mean NDVI per plot was related to mean per-vine pruning weight as: NDVI = 0.15 + 0.24*LOG(prun_wt), r2 = 0.72, n = 18.
The absolute value of the NDVI may be affected by factors unrelated to changes in the crop canopy (for example, year-to-year differences in atmosphere, sensor response). To lessen this influence, an image processing routine was used to assign each NDVI pixel to one of 12 levels ranging from low to high NDVI. These relative NDVIs were color coded to facilitate visual discrimination, with brown corresponding to the lowest NDVI level (1), dark green corresponding to the highest NDVI level (12) and black (0) corresponding to areas of no apparent vegetation (images a and b above). For the combined 1993 and 1994 data set, the relationship of mean relative NDVI to mean per-vine pruning weight (fig. 3) was somewhat stronger (r2 = 0.76) and more linear than that observed with absolute NDVI.
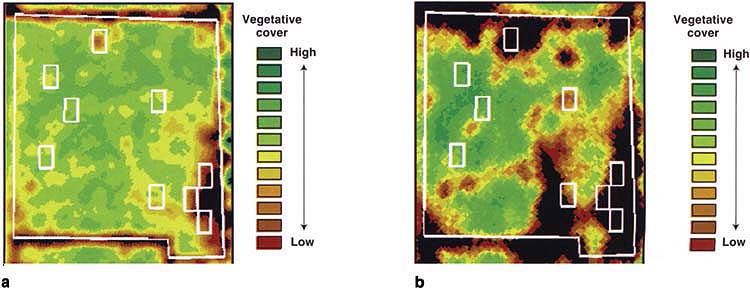
Relative vegetation index image of study site for 1993 (a) and 1994 (b). The index, which is sensitive to leaf area, was first computed for each image pixel as the difference of the infrared and red channels divided by the sum of the infrared and red channels. Next, areas of bare soil or very low leaf area were assigned black (level 0). An image processing routine was used to assign each remaining pixel to one of 12 levels ranging from low to high index value, and to color code output as shown in the legend.
To show year-to-year changes in canopy, the 1994 relative NDVI image was digitally superimposed upon and subtracted pixel by pixel from the 1993 image (see image p. 18). Consistent with the pruning weights, the resulting image shows a decline in canopy at and near plots 1–6, due mostly to phylloxera infestation, and constant values or year-to-year increases at and near less infested and uninfested plots 7–9.
Practical evaluation
Color-infrared and relative NDVI images were provided to the grower both as paper prints and as digital files compatible with the grower's geographic information system software (ArcView 1.0; Environmental Systems Research Institute, Redlands). Using this software on a laptop computer, the grower was able to enlarge, view and print the images. The images were shared with various company personnel, who generally felt that it agreed with their perception of the property. The imagery provided an objective measure of canopy cover that corroborated field observations and measurements. The consensus was that the relative NDVI images (above) were far easier to interpret visually than either the contrast-enhanced color-infrared images (such as the images on p. 16) or film-based color-infrared photographs, which were believed to be about equal in information content.
The imagery, essentially a map of strong and weak areas throughout the vineyard, was used to target areas for investigation and possible remedial action to improve vineyard uniformity. Field verification showed that canopy differences observed in the images were generally related to either phylloxera infestation or soil water-holding capacity. Considered along with other routine measurements and observations, the imagery was useful for evaluating the viability of particular fields with regard to phylloxera stress (as judged by canopy size and uniformity) and in making replanting decisions during the study period. The images were used to place backhoe pits for soil investigation prior to replanting, resulting in establishment of new block boundaries that more closely match soil patterns and thus should simplify management and enhance crop uniformity. This tool was found to be particularly useful on newly acquired property, with which management was less familiar. The imagery was also used for strategic placement of sampling sites to monitor brix, and we feel is potentially useful for establishing sample sites for node levels and cluster numbers for improved yield prediction.
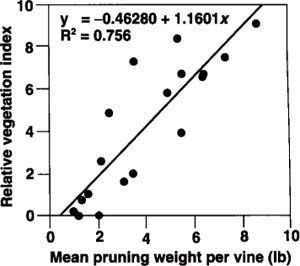
Fig. 3. Mean per-vine pruning weight in each study plot vs. mean relative vegetation index assigned to each plot by processing of images acquired in 1993 and 1994. No significant difference was seen in the slope of the 1993 and 1994 regression lines. Strong goodness-of-fit (r2 = 0.76) for the combined regression underscores the effectiveness of the relative NDVI approach to monitoring canopy size over time.
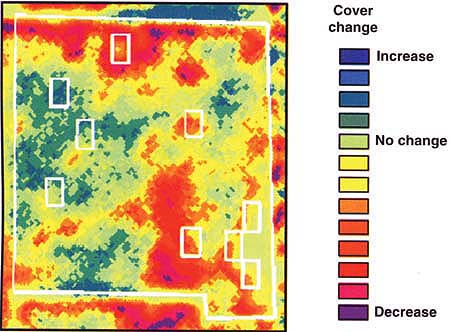
Change in relative vegetation index from 1993 to 1994 in the study site. The image was generated by digitally superimposing and subtracting on a per-pixel basis the 1994 relative vegetation index image from the 1993 image (see images, page 17). Areas of decline, generally associated with phylloxera infestation, are displayed as yellow and red.
Maturity measures (Brix, titratable acidity, pH and taste) were different between the strong and weak areas shown in the imagery. In a limited test, the imagery was used to subdivide fields for harvest based on observed patterns of strength and weakness. Resulting wine quality was found to be dramatically different between the strong and weak areas; strong areas were of “Reserve” quality, weak areas were of lower quality. Thus, where uniformity cannot be improved, the imagery will help to prevent the combining of differing quality harvest into the same wine lot.
The imagery provided a direct comparison of the current and previous season's canopy (such as the image above). With this, the grower was able to assess the rate of phylloxera spread (by vine and block) and to project its future extent, again in support of replanting decisions. Year-to-year comparison was also useful for assessing the effect of pruning and other management practices on canopy size and uniformity.
Availability of the technology
In the GRAPES project, airborne digital sensors acquired imagery over increasingly large regions during each year of the project. In 1993, coverage was limited to the Oakville vicinity in the Napa Valley. In 1994, coverage included most of the Napa Valley and the Carneros region (southwest of the city of Napa). In 1995, the project acquired imagery over much of the vineyard region in Napa and Sonoma counties. Since 1995, at least one commercial service in California collects and processes digital imagery over agricultural lands, delivering color-infrared images on paper or computer media to clients within 48 hours of overflight. These images are suitable for subsequent processing into absolute and relative NDVI products. Beginning in 1998, planned commercial satellite systems will acquire visible and near-infrared imagery with sufficient pixel resolution (about 15 feet) to be of use in agricultural management. The image processing steps outlined here are within the capabilities of commercial remote sensing and geographic information system vendors, and perhaps could be incorporated at the level of the agricultural consultant.
Currently and for the near future, the most common way to generate a digital image is to scan a color-infrared aerial photograph. In GRAPES, a common desktop scanner was used to convert 1993 and 1994 film products of the study site to digital format. Limited investigation produced relative NDVI results similar to those reported here for the digital sensors. One disadvantage of this approach is slower turnaround time due to film processing, which may prove unacceptable for some agricultural applications that require quick response.
Finally, trends in technology are combining to enable the manipulation of processed imagery and other spatial data at the grower or grower-consultant level. These include dramatic improvements in the cost/performance of personal computers and image display/geographic information system software, and the continued evolution of commercial GPS receivers to permit accurate and rapid collection of geographic data for coupling fieldwork with imagery.
Citations
Airborne imaging aids vineyard canopy evaluation

