


All Issues
Cracks in irrigated clay soil may allow some drainage
Publication Information
California Agriculture 46(5):9-11.
Published September 01, 1992
PDF | Citation | Permissions
Abstract
Cracking clay soil poses unique water management problems. Typically, clay soil is presumed to have negligible drainable pore space. Field measurements, however, suggest that there may be as much as 10% drainable pore space available, due in part to soil cracking. Such pore space may be useful in designing irrigation-drainage systems for these soils.
Full text
Clay soil may not be sandy loam, but it isn't all bad. By understanding the nature of soil cracks that appear in clay soils after irrigation, engineers may be able to improve irrigation and drainage systems for these soils.
Cracking clay soils in California often are saline and have poor drainage characteristics, thereby limiting their cultivation value. Excess salinity in the root zone of these soils is not easy to remove because of their low permeability to water; consequently, salts cannot be leached. On the other hand, arid conditions in the San Joaquin and Imperial valleys encourage formation of desiccation cracks that are the main route of water through the soil profile.
The extent of soil cracking appears to be related to soil salinity. Studies show that, with increasing salinity, crack widths tend to increase and crack depths tend to decrease. Overall, water management of these fields to control salinity and meet plant water requirements may be enhanced by improving our understanding of rootzone drainage in these soils.
Key to determining the extent of root-zone drainage is the soil's drainable pore space or porosity, also called its apparent specific yield, or simply its specific yield. Specific yield (Sy) is the ratio of the volume of water that drains under the force of gravity to the bulk volume of the profile. It is often expressed as a percentage. Aquifer stratification, slow drainage above the water table, and air entrapment in the pore space all tend to reduce the value of measured Sy for shallow water table aquifers. That is to say, though Sy ought to be a simple measure of drainable pore space, in reality its measured value is affected by soil permeability and water table fluctuations.
Specific yield has been determined for a range of geologic materials and some soils. For sedimentary materials, Sy tends to be greatest for sand at about 30%, and then decreases in this order: gravel (25%), silt (15%), and clay (3%). Windblown loess soil (a mixture of fine-grained materials) has an Sy value similar to silts at about 18%. In general, a soil's Sy decreases rapidly as its texture becomes progressively finer.
The U.S. Bureau of Reclamation (USBR) noted this relationship. Based on results of several laboratory and field measurements of soils in the western states, USBR developed an empirical relationship between Sy and soil permeability. The relationship illustrated the tendency for Sy to decrease as soil permeability decreases (i.e., at a permeability of 10 inches per hour, Sy = 22%; at 1 in/hr, Sy = 10%; and at 0.1 in/hr, Sy = 1%). In many cases, the permeability of clay soils is less than 0.1 in/hr, suggesting that they have negligible drainable pore space. Due to soil cracking in the field, however, it appears that some drainable pore space exists in these soils, at least in the cracks. This aspect of soil cracking and drainable porosity was not explicitly considered by the USBR.
The purpose of this study was to determine the Sy of a cracking clay soil in the field, and in doing so to quantify aspects of rootzone drainage. The investigation took place in the Imperial Valley at a site where irrigation, drainage, water tables, salinity, and soil moisture have been regularly monitored for several years. This paper considers some of the collected data in an idealized sense to give the reader an overall perspective of the meaning of Sy and the cracked-clay drainage process in the field.
Field measurements
Soil at the field site is classified as Imperial silty clay. Based on soil samples taken from the top 6 feet of the profile, it is 50 to 70% montmorrilonitic clay. An arid, hot climate prevails at the site and irrigation is required for crop cultivation. Soil salinity there has varied little over three decades, despite the presence of subsurface drains in the field. Salinity increases with depth, ranging from 7 to 11 decisiemens per meter (dS/m, or millimhos per centimeter [mmho/cm]) across a depth of 0 to 3 feet.
Water movement in the field was measured during several irrigations. Measured were the irrigation on-flow rate for each border check, irrigation surface advance rate along the border, subsurface drainage flow rates of each lateral at midfield along each border, water table depth at three transects across the borders, and soil moisture at two transects across the borders. Water table depth was monitored using transects of 16 observation wells, each crossing the area between three subsurface drain laterals. Neutron probe access tubes located near the observation wells were used to monitor soil moisture.
Soil salinity at the test site has varied little since subsurface drains were installed. Growers install the drainage pipe to provide an outlet for irrigation waters that cannot penetrate a clay layer into the deeper aquifer, and for additional waters applied to leach salt from the soil.
Also measured were soil and drainwater salinity and soil permeability at different depths of the profile. In addition, near-surface (less than 1 foot deep) measurements of soil water content were made on some irrigations following observation of the loss in soil structure at the surface during irrigation.
Results
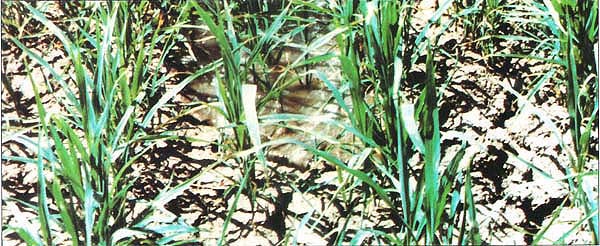
Irrigation advance down the border checks was typically steady for each irrigation, although rates differed for each irrigation. The steady rate of advance was due to the extremely low permeability of the soil and the relatively uniform distribution of soil cracks. Water would advance on the surface as cracks filled; deeper cracks resulted in a slower advance rate. Cracks did not close during irrigation or for several days after. The constant rate of advance enabled use of a simple volume balance model to determine the depth of infiltrated water or crack volume in the field. Infiltrated depths ranged from 0.12 to 0.18 meter (about 6 inches) for eight different irrigations.
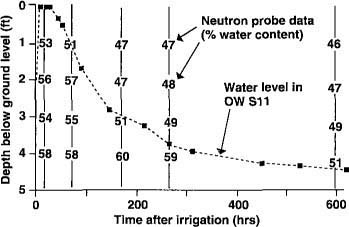
The water table responded quickly to irrigation, approaching the soil surface within hours of irrigation. Figure 1 shows the response of a typical observation well, together with data from an adjacent neutron probe access tube, to irrigation and subsequent drainage. For this location, the saturated water content appears to be about 55% for most of the profile. The observation well data for water table position seems to lag slightly behind the actual position due to the time required for water to dissipate from the well.
Data from the northern transect of observation wells just before irrigation and at several different times afterward are shown in figure 2. Note that the water table at the backfilled trenches of the drainline is coincident with drain depth.
Detailed measurements of the rate of drain flows from the center drain and the water table position in and adjacent to the trench indicated that the rapid increase in drain flow rate and its decline resulted from drainage of the backfilled soil over the drain in the drainline trench. Additional isotopic composition of the water data and modeling studies confirmed that the rise and fall of drain flow rates above base flow levels were simply drainage of the backfilled soil of the trench, hereafter referred to as “trench flow.” This means that the drains collected little rootzone drainage water beyond the soil water immediately above the drain. We also found that soil salinity in the trenches was 2 to 3 dS/m lower than in the adjacent soil, presumably because of increased leaching of the backfilled soil.
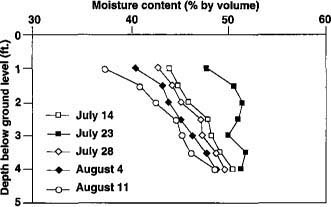
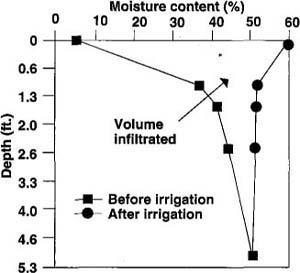
Field measurements of vertical permeability at two locations and three depths showed that conductivity decreased uniformly with depth from just over 0.4 in/day at about 2 feet deep to about 0.1 in/day at 4 feet deep. Finally, data from measurements of soil moisture by direct sampling for the first 30 cm (1 foot) and by neutron probe from 30 to 150 cm (1 to 5 feet) are shown in figure 3 and figure 4, respectively. Generally, soil water content was about 52% in the profile, and approached 60% near the surface following irrigation. Drainage of the root zone required more than 1 month.
Estimating Sy
Values of Sy for the field soils can be estimated by several methods, including estimates based on the volume of drainage through the backfilled trench, direct measurement of soil permeability, the rate of water table decline, the volume of applied water draining from the field, and changes in soil moisture of the profile. Each method is considered here. Bear in mind that the fundamental definition of Sy is the incremental volume of water released from the soil per unit of soil volume (that is, soil depth for a specified surface area).
Based on drain-flow hydrographs, the volume of subsurface drain water resulting from “trench flow” ranged from 18 to 20 m3 (636 to 706 ft3) for the irrigations considered here. Length of the drainline was 185 m (607 feet), depth was 1.6 m (5.25 feet), and the original excavation trench width was about 0.6 m (2 feet). Using average values, Sy = 19 m3 + (0.6 m × 185 m × 1.6 m) = 10.7%. Although it is larger by more than a factor of 10 than previously indicated comparative values for clay soil, this value of Sy seems consistent with the relatively greater permeability of the trench soil.
Based on soil permeability measurements averaging about 0.2 inches/day, the Sy indicated by the USBR empirical curve is negligibly small. However, the water table declined at a much more rapid rate than could be accounted for by the soil permeability. The average rate of water table fall from all the observation well data is about 10 cm/day or 0.16 in/hr. Again, using the USBR curve, the Sy corresponding to this rate is approximately 2.4%. The fieldwide rate of water table decline appears to be a better estimate of the field's hydraulic characteristics than the point permeability measurements. This is logical, considering that the fieldwide average rate of fall measurement characterizes the overall hydraulic characteristics of a much larger soil mass sample that includes the effects of cracking on rootzone hydraulic properties.


The Sy at the field scale can also be estimated from the volume of drainage leaving the field. Within about 3 days of irrigation, the water table had fallen below the root zone of the shallow-rooted crops grown at the site. This suggests that the volume of water remaining below the water table in the profile drains into the deeper aquifer. This volume is simply the infiltrated volume less the 3 days of evapotranspiration use by the crops and the “trench flow” volume (about 2% of the total applied). For the irrigations considered here, this volume corresponds to a depth of about 0.14 m. The specific yield of the profile, then, over a depth of 1.5 m (5 feet) is Sy = 0.14 m + 1.5 m = 9.3%. This value of Sy is comparable to that for the trench backfill soil (10.7%) and is much larger than that indicated by profile drainage rates (2.4%) and the USBR empirical curve (≍0%).
The final estimate of Sy can be obtained from measuring changes in soil moisture before and after irrigation. The volume represented by these changes over depth in the profile represents something of the available capacity of the profile to take water; that is, it is an estimate of the size of the soil profile reservoir. Judging from the relatively rapid rate of water level decline in the profile as compared with permeability, this reservoir is largely a result of soil cracking. Figure 5 presents an idealized sketch of the change in soil moisture with depth before and after irrigation, based on data from figure 3 and figure 4. The volume of water enveloped by the two curves represents a depth of about 0.17 m (6.7 inches), which corresponds closely to measured infiltrated depths. Again, correcting for water losses to evapotranspiration, the Sy is comparable to that obtained above at about 9%.
In summary, observations of the volume of infiltrated water measured either when applied or as changes in soil profile moisture suggest that the Sy for the cracked clay soil is 9 to 10%. This value is similar to that obtained for the drainline trench backfill soil, and is much greater than that estimated from the hydraulic properties of the field or suggested in tabulated values.
Conclusions
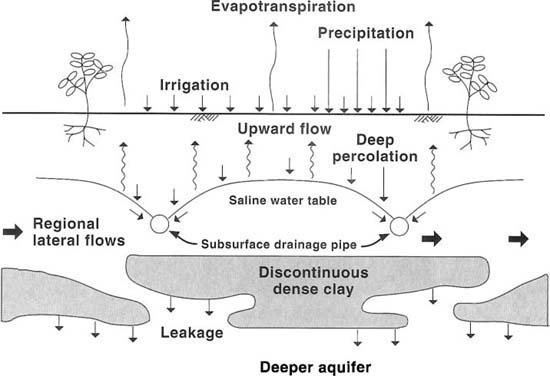
Cracking clay soils pose a unique set of problems related to water management. Surface irrigation of these soils results in rapid recharge to the water table to the extent that cracks penetrate the subsurface. Water flow through cracks in the soil profile results in limited salt leaching and excess deep percolation. The excess deep percolation may be recovered by subsurface drainlines or may contribute to the deeper groundwater system. Unfortunately, continuous contributions to shallow groundwater may exacerbate root-zone waterlogging and salinity, and groundwater degradation.
Usually, clay soil permeability is so small as to suggest that there is little water penetration and negligible drainable pore space. The measurements considered here, however, suggest that cracking clay may have an apparent drainable pore space or specific yield as large as 10%. Much of this pore space originates in the crack volume, and the seeming anomaly of this high value suggests that the cracking itself is a long-term component of the soil profile structure. Such a value of specific yield is useful in designing irrigation and drainage systems for cracking clay soils.
Cracks in irrigated clay soil may allow some drainage

