


All Issues
How asparagus imports affect U.S. prices, grower returns and total acreage
Publication Information
California Agriculture 45(5):24-26.
Published September 01, 1991
PDF | Citation | Permissions
Abstract
U.S. imports of fresh asparagus have increased substantially in recent years. This study shows that although U.S. prices were reduced in the short run, in the long run most imports were offset by nearly equivalent reductions in U.S. production (and shifts to other crops), with prices returning to near pre-import levels.
Full text
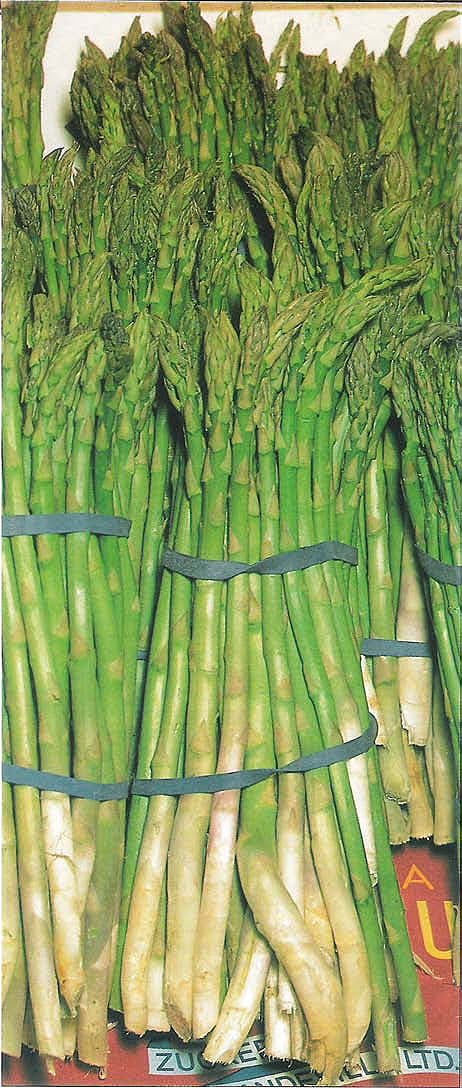
Asparagus display at Summer Harvest Tasting, a trade show for local growers in Sacramento.
Imports of fresh-market asparagus into the United States (primarily from Mexico) increased from roughly 5 to 9 million lb/yr in the decade of the 1970s to over 30 million lb annually in recent years. More importantly, imports during the months of January to June, when 97 to 99% of U.S. shipments reach the market, increased from an average of 5.8 million lb/yr in 1975-79 (about 8% of U.S. January-June consumption) to over 20 million lb/yr (about 15.7% of U.S. January-June consumption) in 1987-89 (table 1).
California growers produce about three-fourths of U.S. fresh asparagus. Continued industry concerns about the effects of asparagus imports on U.S. producers led to investigations by the U.S. International Trade Commission (ITC) in 1972, 1975 and again in 1988. However, the ITC studies did not find that the import quantities were great enough to seriously injure the industry. Hence, no new import restrictions were adopted in excess of the commonly applied 25% ad valorem tariff. It is possible that the tariff would be reduced under a proposed free trade agreement with Mexico, but the specific terms are unknown at this time.
The ITC conclusions were based on economic interpretations of data on prices, shipments, costs and marketing practices. No efforts were made to estimate specific quantitative effects of the imports on U.S. asparagus grower prices, acreage and net returns. This report presents such estimates. The foundation for the analysis is An Econometric Model of the U.S. Asparagus Industry (French, Ben C. and Lois Schertz Willett, Giannini Research Report Number 340, September 1989). The published model has since been modified slightly to incorporate recent data.
Demand relationships
Table 2 summarizes the main results of demand relationship estimates for the three forms in which asparagus is utilized. The values not in parentheses indicate percentage relationships between prices and quantities, with other variables held constant For example, a 10% increase in January-June per capita quantity placed in the fresh market has been associated with about a 3% (2.97) decrease in the grower-level fresh price. With other variables constant, a 10% increase in U.S. per capita disposable income has been associated with a 10.5% increase in the fresh-market price. The latter effect has been offset to some extent by a downward trend in the level of demand of about 1.9% per year.
The values in parentheses are the ratios of the coefficients to their standard errors. The values of 2.0 and above indicate relatively high levels of statistical significance for the estimates of canned and fresh-market price-quantity relationships. The estimated relationship between frozen quantity and frozen price was not significant, primarily because of the poor quality of available data on frozen asparagus prices and quantities. It is likely that the actual percentage relationship is more nearly in line with the values for the canned and fresh components.
Reducing imports: short-run effect
The values in tables 1 and 2 enable us to estimate what might happen to prices in the very short-term (a single season) if restrictions were imposed so that fresh imports were greatly reduced. To be more specific, assume imports from January to June are reduced from 19 million lb, which was the average level of January-June imports from 1986 to 1988, to 0 lb (table 1). This would initially reduce U.S. January-June fresh supply by about 13.6% relative to 1986-88 levels. With other factors constant, the grower fresh-market price would increase by about 4% (0.297 x 13.6). The 19-million-lb reduction in January-June imports would also decrease annual January-December fresh quantity by about 12.7%, which in turn would increase the price of canned asparagus by about 3.3% (0.257 x 12.7) and the frozen price by about 1% (0.075 x 12.7).
Because asparagus is a perennial crop, the short-run estimates reveal only a fraction of the total impact of changes in fresh imports. The higher grower returns associated with the higher prices would most certainly lead to increased plantings and some shift in allocation from processing to fresh utilization. New plantings bear in the second year but are not harvested heavily until the third season. Thereafter, the asparagus beds may remain productive for 7 to 15 yrs. As the new plantings matured, U.S. asparagus production would increase and the initial price increases would be modified. With other factors constant, the system would eventually stabilize at price and output levels rather different than indicated by the estimates of initial short-run response.
Reducing imports: long-run effect
To gain insight into the dynamics of the adjustment process associated with changes in imports, and other factors affecting the asparagus economy, we formulated and estimated an econometric model of the complete system, using annual data for the period 1956 to 1988. In addition to the fresh-market, canned and frozen demand relationships reflected in table 2, the model includes:
The quantity of imports is influenced by U.S. prices and supply-demand conditions in the exporting countries (primarily Mexico). It would be desirable to have an equation that measures this relationship; but we do not have the necessary data. Hence, imports are treated as an “exogenous” variable whose value is determined by forces outside the U.S. industry.
When solved for the simultaneous demand components and arranged in appropriate sequence for computer calculations, the industry model may be used to generate predicted changes in future time paths of prices, acreage and production, given the values of all variables treated as exogenous, such as imports, exports, costs, income, yields and population. The sequence of predictions is started by inserting observed values of prices, acreage, stocks and production variables for an initial period. These values generate predictions 1 yr ahead, which feed back into the system through lagged relationships to generate further price and quantity predictions over future periods.
To evaluate the effects of a change in imports, we first established a “base run” of predictions in which all exogenous variables are held at recent values. We then changed the level of imports, with all other exogenous variables held at base run values. The computer predictions were generated again, and the differences from the base run values, attributable to the change in imports, were computed.
Table 3 presents the results of a simulation experiment in which 1988 is taken as the initial period (year 1). In the base run, fresh imports during the January-June period are set at the 1986-88 mean level of 19 million lb. In the simulation experiment, January-June imports are reduced to zero in year 2, which initially reduces the quantity available for U.S. consumption, excluding July-December imports, by about 13.6%. There is no change in bearing acres and total asparagus production in year 2, but there is a shift of 8.1 million lb from processing to fresh-market utilization. The average grower price for fresh and processing asparagus increases by 3.66¢/lb (1988 dollars), about 5.2%. In year 3, acreage increases by 2,260 but further adjustments in the allocation between fresh and processing use leave the average grower price essentially unchanged.
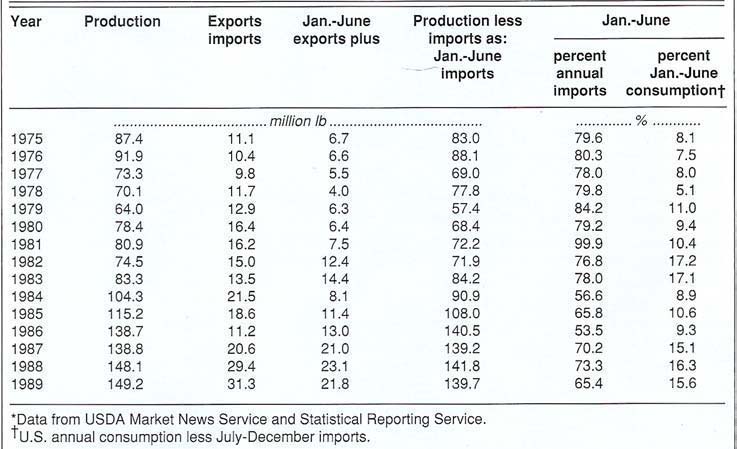
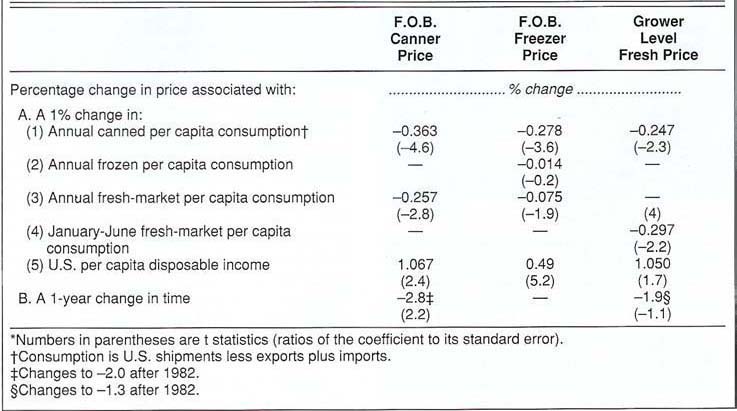
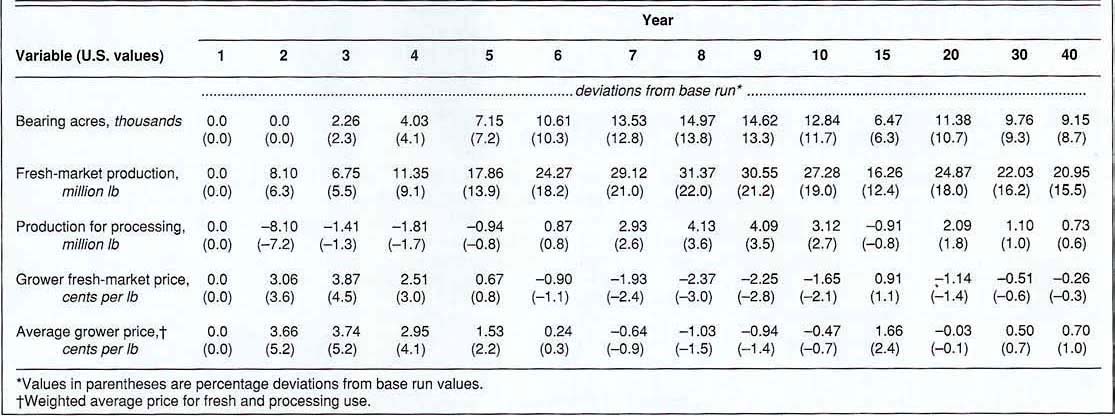
TABLE 3. Predicted long-run effects of reducing annual January-June fresh asparagus imports by 19 million lb
In time, acreage and fresh-market production continue to expand and the average grower price declines until the eighth or ninth year. The model suggests some overshooting in these years so that average prices fall below base run values for a brief period. The overshooting occurs because of the lag between grower response to changing profitability and the observed effects of such response on grower returns. This results in somewhat cyclical adjustment paths.
The long-run supply response is quite elastic. Eventually, the system approaches a new equilibrium in which there are roughly 9,000 more U.S. acres, the eliminated fresh imports are replaced by U.S. production and grower prices return to roughly the same level as before the imports were reduced. The relatively minor effects of the transferred asparagus acres on other crops are not included in the analysis.
If imports were reduced by (say) 10 million lb rather than the 19 million lb assumed in table 3, the magnitudes of price and production adjustments would be correspondingly reduced, but the time paths would be similar. The analysis suggests there would be a period of 5 to 6 yrs in which, with other factors constant, U.S. asparagus growers would receive increased returns, but after that the expanded production would reduce prices to near pre-import-reduction levels.
Effects of increased fresh imports
Under a proposed free trade agreement with Mexico, future fresh imports might exceed recent levels. As noted, we were unable to estimate how the level of imports might be affected by changes in net prices. However, our dynamic econometric model can provide some insights into the effects of possible increases in the level of imports on the U.S. industry. The time path of price and output adjustments will vary with assumptions as to the rate of import expansion and changes in other variables such as growth in U.S. population. For simplicity, assume a one-time sustained increase in January-June imports of 5 million lb (about 3.6% of U.S. January-June consumption), with other variables such as U.S. exports and population constant.
The initial effect would be a reduction in the U.S. grower fresh price of about 1.1%. Although the reduction is not large, it would affect profits and therefore would have a small negative impact on asparagus plantings. The time path of price and production adjustment would be approximately the inverse of the table 3 values — that is, returns would fall below base run values for 5 to 6 yrs, then eventually return to near previous levels. U.S. acreage would finally stabilize at about 2,400 fewer acres, with the added imports approximately replacing 5 million lb of U.S. production. Larger increases in imports would have correspondingly larger effects on prices and acreage, but the time frame of adjustment would be about the same.
Conclusions
January-June imports of fresh asparagus affected U.S. grower return negatively during the periods required for U.S. production to adjust to changing market conditions, with the magnitude and time pattern of adjustment varying with the rate of change in imports. The total cumulative impact of past increases in imports appears to have been equivalent to roughly a 4 to 5% reduction in U.S. prices, limited to and spread in a declining amount over a 5-to 6-yr period. After all adjustments were completed, the January-June fresh asparagus imports reduced U.S. acreage by 9,000 to 10,000 ac and replaced roughly an equivalent quantity of U.S. fresh-market production.
The U.S. long-run supply response for asparagus likely will continue to be quite elastic within the range of recent acreage levels. Because current U.S. and California acreage are both considerably less than in the decades of the 1960s and 1970s, availability of suitable land does not appear to be a significant limiting factor. And because asparagus acreage is small relative to many alternative crops, moderate expansion or contraction seems unlikely to have much effect on unit production costs or on returns to alternative crops. If restrictions were imposed on January-June imports and demand levels remained constant, the short-run effect would be to increase U.S. prices as indicated previously, but in the long-run U.S. acreage and production would expand to replace most of the imports, with only minor effects on the long-run price. Increases in January-June imports would have a similar but inverse effect, as described above.
How asparagus imports affect U.S. prices, grower returns and total acreage

