


All Issues
New index measures returns to risk in crop production
Publication Information
California Agriculture 45(3):36-39.
Published May 01, 1991
PDF | Citation | Permissions
Abstract
Now crop producers have an index that predicts returns from risk in agriculture. Adapted from stock portfolio strategies, the index is one of the first to be applied to farming. Crop diversification will be described as a risk management strategy and evaluated using the index with data from three sample counties.
Full text

Diversification: tomato crop grows next to wheat fields.
Selecting which crops to produce is one of the most important decisions faced by agricultural producers, yet many do not understand the risks associated with that decision. Too often their analysis stops once a market opportunity has been identified. Besides the profit they anticipate, producers need to consider the relative risks associated with each crop to accurately assess market opportunities. The many agricultural crops produced and marketed profitably by California growers are by no means equal in posing risks. For growers to select crops that best suit their needs, they must take account of these differences. Unfortunately, strategies that lower risk usually reduce expected net returns. Growers should consider the risk/return tradeoff when making cropping decisions.
This article provides information about income risks associated with major California crops and how to manage those risks. We have also included an index that decision makers can use to account for the risk/return tradeoff when designing risk management strategies.
First, income risk is described, followed by a brief summary of risk measurements for a sample of crops. Next, diversification into a portfolio of crops is presented as a risk management strategy. As illustrations, we present data reflecting historical income risk levels using measures of returns to risk for crop portfolios in three counties. Finally, some traditional crop rotations from those counties are evaluated, using portfolio methods as an example of how the returns-to-risk index can facilitate cropping decisions.
Income risks faced by crop producers
“Risk” is usually defined as “volatility” or “fluctuation.” Income risk faced by agricultural producers reflects the net effects of risks associated with (1) production and yield and (2) marketing and price.
Such risk can be measured by using the coefficient of variation (CV). A CV is calculated by dividing the standard deviation (σ) of a data series (i.e., crop yields for several years) by its mean and multiplying by 100, thereby expressing the figure as a percentage. Calculation of both the standard deviation (a measure of how widely data vary around a mean) and the CV can be performed using handheld calculators or software spreadsheets.
For the purposes of this discussion, the mean can be expressed either as X or as E(Ri) for expected return from crop i. The CV can therefore be notated two ways: CV = σ/x or CV =σ/E(Ri)
Production risk has many sources, both from within and outside the firm, all of which combine to create variation in yields per acre across time. Yield risk may be measured using the CV for average annual yields (in tons per acre) by crop by county.
Price risk is generated by market forces from outside the producer's firm. Here price risk is measured by the CV of average annual prices per ton by crop by county. To remove the influence of inflation over time, the series is deflated using the index of farm prices received (1986 = 100) from the Economic Report of the President, 1988.
Because income risk incorporates both price and production risk, the CV of income risk is used in the tables accompanying this paper. This coefficient is calculated based on net income per acre, which equals gross revenue (price times yield) minus both fixed and variable costs, as reported in Extension Service county crop budgets. Mean and CV statistics are calculated for crops in three counties: Fresno, Imperial, and Yolo. Net income is calculated by finding the historical mean of real gross revenues per acre and subtracting costs per acre, both in real 1986 dollars. For each crop i, average net returns per acre at time t is:
Rit = [(PY)-C]it [1]where P is price, Y is yield, and C is per acre cost for crop i at time t.
In addition to the CV, another income risk measure—a return-to-risk (RtR) index—is calculated. This measure is the reciprocal of a CV for either a crop or a portfolio, adjusted by the return to a risk-free crop, defined as what the land would return in a cash lease. The RtR measure for crop i is:
RtRi≡(E(Ri)-Rf/σ(Ri)) [2]where Rf is the return to a risk-free investment and σ(Ri) is the standard deviation of historical returns for crop i. This measure gives the reward for bearing risk (the difference between the average return and the risk-free return) per unit of such risk — that is, the reward is divided by the standard deviation of the net returns over the period of analysis for a crop or portfolio. The lower the CV or higher the RtR, the more “risk efficient” is an alternative.
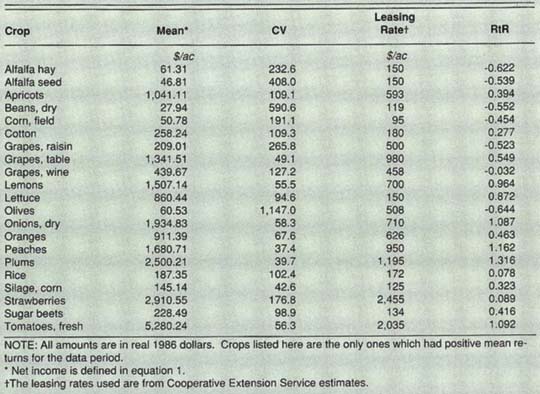
TABLE 1. Net Income mean, coefficient of variation (CV), leasing rate and return-to-risk Index (RtR) for crops grown profitably in Fresno County
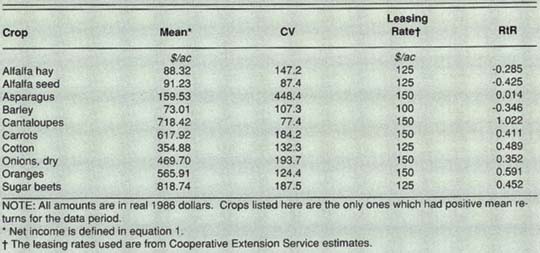
TABLE 2. Net income mean, coefficient of variation (CV), leasing rate and return-to-risk Index (RtR) for crops grown profitably In Imperial County
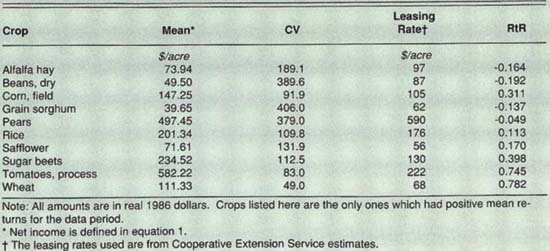
TABLE 3. Net Income mean, coefficient of variation (CV), leasing rate and return-to-risk index (RtR) for crops grown profitably in Yolo County
Returns to risk for crops
Profit measures, rather than gross revenue, should be used when evaluating income risk. As samples, a net income series in real 1986 dollars was calculated for Fresno, Imperial, and Yolo Counties (tables 1 through 3) using annual data from 1958 to 1986. Note that the CVs and RtR measures for these series give somewhat different indications of the level of risk. For example, one-third of the crops listed for Fresno County (table 1) have negative RtR values. This means that although those crops had positive net returns over the data period, on average, the level of profits was not high enough, relative to the risk free return, to show a positive return to risk. This index is a much clearer signal concerning the performance of a crop as an investment than the ambiguous CV. The RtR index has a built-in decision criterion and, therefore, is a superior decision tool.
Methods of reducing risk
These high levels of risk estimates for individual crops imply a need for, and potential gain from, reducing risk. There are three general types of agricultural risk-reducing strategies. The first, forward contracting, is not always available to individual growers and, when available, may be very restrictive. For example, buyers of forward contracts sometimes represent such a thin market that sellers are forced to accept weak offers or not contract at all Also, growers are unable to benefit from potentially advantageous price movements occurring after a contract is signed. The second strategy is hedging using futures and/or options contracts. Although much less restrictive than forward contracts, futures and options markets do not exist for many California crops.
In contrast, the third risk reducing strategy, diversification into a portfolio of products, is available to most crop producers. Diversification does not restrict a grower's ability to negotiate prices or contract, but increases opportunities to spread cash flows across seasons, possibly reducing borrowing requirements.
Any restrictions on growers' use of the portfolio approach to crop selection relate to their knowledge of production techniques, scale economies of production, and financial requirements. Obviously, a successful portfolio would include only crops that a grower is proficient in raising. But costs may increase as diversification limits the scale of production of any one crop. And capital requirements may increase as more crops are added, forcing a grower to restrict the degree of diversification to what can be financed. Of course there are also agronomic limitations on the crops that can enter a portfolio, depending on the resources at the location—specifically, what crops can be grown efficiently there and what crops must be grown to maintain resource productivity. In summary, the portfolio method has fewer limitations in its use than other methods of risk reduction available to growers.


Standard portfolio theory states that adding more crops to a production rotation reduces risk The expected return of a portfolio equals the sum of the expected returns from the crops included in the portfolio, weighted by the proportion of land in the respective crops. The portfolio risk could be measured as the sum of all variances and covariances of crop returns weighted by the proportions invested in each crop.
The primary goal of diversification is risk reduction. However, absolute levels of risk and return are positively related, so diversification tends to reduce returns as well as risk. Therefore, crops included in a portfolio because of their low level of absolute risk must also be evaluated for their effects on relative risk and return levels of the portfolio.
A diversified portfolio is assembled with an eye to correlations among expected returns. Portfolio risk is reduced most by including a product with perfect negative correlation with the portfolio's returns. Therefore, one strategy for portfolio creation is to start with the crop with the highest expected return, and continue to add crops with the greatest degree of negative correlation, or the lowest degree of positive correlation, with that crop and/or with the portfolio.
Sample portfolios are derived and presented below to illustrate the relative levels of risk and return facing producers in selected counties. However, actual portfolio selections made by investors will depend upon their individual attitudes toward risk and return.
Crop portfolio examples
Sample portfolios in this article are based on marketing, not just production considerations. That is, products are added to the portfolio based on their risk-adjusted profitability per acre. This method facilitates assessments of simultaneous production of any number of crops on portions of total farm acreage, without being bound by a particular farm size (assuming that economies of scale in production will not vary significantly over the range of possible acreages allocated to any crop in a portfolio). The list of crops for any county can be divided into annuals and perennials with separate portfolios for each. Individual growers can choose one type or combine the two.
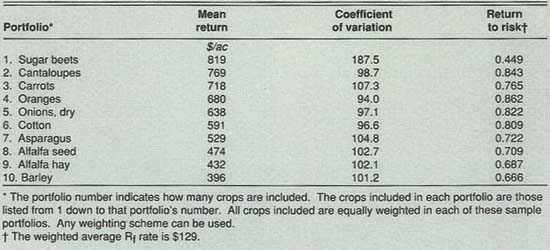
Return/risk tradeoffs in crop portfolios for three sample counties (tables 4 through 6) indicate that increased diversification (1) reduces portfolio returns and (2) tends to lower relative risk levels, but not in all cases. For each county's portfolio, average returns decline as less profitable crops are averaged in with the more profitable. Yet, in some cases, adding crops to the portfolio caused risk to be reduced more than returns, generating a more risk-efficient portfolio, as evidenced by a higher RtR index.
Note that the CV and RtR indexes rank the portfolios differently. For example, in table 4 the most efficient portfolio of tree and vine crops is that including seven products according to the CV and three crops according to the RtR index. The main difference between the indexes is that the return to leasing land (a proxy for a risk-free investment) is used in calculating the RtR index, but not for calculating the CV. If leasing rate data are available, the somewhat more sophisticated RtR measure should be used when making cropping decisions; otherwise, CV can be used. Note that both of these decision aids are only simple proxies for crop selection criteria; more sophisticated mathematical techniques are available if optimal portfolios are sought. However, the RtR approach is more flexible than some sophisticated techniques when evaluating adjustments to existing rotations, and it can give similar answers by using spreadsheet trial-and-error methods that can be performed easily in a short period of time.
Comparing the results for portfolios presented in tables 4 through 6 with those in tables 1 through 3 for single crops shows that portfolios give a better chance of earning positive returns to risk than single crops. Note that the RtR index is positive for all portfolios, whereas about one-third of the single crops have negative returns to risk. It is apparent that diversification improves risk efficiency.
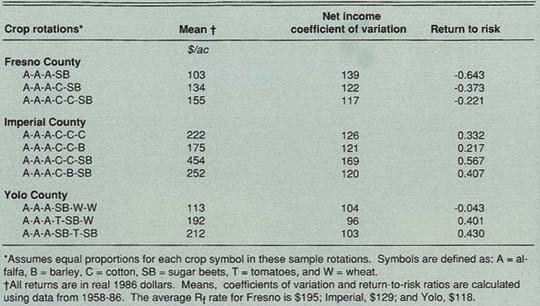
For comparison with these diversified portfolios, table 7 presents some “traditional” crop rotations (identified in a 1960 study by Carter and Dean) for the same three counties. Ignoring alfalfa, which is included for soil conditioning, the crops in traditional rotations are similar to some portfolios listed in tables 4 through 6. Similarities in composition between traditional rotations and the portfolio examples indicate that growers have made good choices in the past. However, care in selection of crops for a portfolio is needed, for within each county the alternate rotations are significantly different in their degree of risk efficiency. For example, the first rotation listed in table 7 for Yolo County has a negative RtR index, but as wheat is dropped and tomatoes added in the second and third rotations, the index becomes increasingly positive.
We conclude that there are “returns to analysis of risk” for growers. Spending time evaluating markets to estimate crop returns and creating portfolios based on correlation among crop returns can significantly improve the risk efficiency of cropping plans.
New index measures returns to risk in crop production

