


All Issues
Water quality and subsurface soil variabilities affect infiItration
Publication Information
California Agriculture 44(3):10-12.
Published May 01, 1990
PDF | Citation | Permissions
Abstract
Variations in the soil's chemical or physical structure may affect its ability to absorb water. By adding sodium to irrigation water, researchers decreased infiltration during subsequent irrigations. In addition, the thickness and character of soil layers may obscure infiltration effects of tillage and water quality.
Full text
Poor water penetration affects crop production on over 2.5 million acres of irrigated land in California. Generally, infiltration rates decrease substantially after a first irrigation. Farmers commonly cultivate after each irrigation to break up the soil, but during the growing season they cannotNdahsuch a practice could destroy the crop. Given that infiltration rates are low, the only way to increase cumulative infiltration is to increase the intake time, thereby letting the water infiltrate longer. For furrow irrigation, the most widely used method in California, longer infiltrations are achieved by increasing the set time. This can lead to the loss of large volumes of water to runoff.
Many studies have shown that growers can improve infiltration rates by incorporating various calcium compounds, such as gypsum, lime, and calcium-nitrates, into the soil surface or into the irrigation water. But other studies looking into beneficial effects on infiltration from specific tillage and crop-rotation practices have been inconclusive.
These practices are expected to change the chemistry or structure of the soil surface. However, differences in soil properties below the surface may obscure differences in infiltration caused by soil surface effects.
The objectives of our study were twofold. First, we investigated whether adding sodium to water in an early irrigation would decrease infiltration during a subsequent irrigation. Second, we considered the possibility that differences in infiltration between treatments could be explained partly by variable soil characteristics.
Field experiment
The field study site was the Campbell Tract, a research facility of the University of California at Davis. The sampling sites were in Yolo loam and Yolo silty clay loam. Infiltration was measured with 4- by 4-foot-square infiltrometers 0.3 m (1 foot) deep.
Infiltration was continuously measured for 8 to 10 hours through registration of the water level in a storage tank by a pen chart recorder. The rate of change of infiltration as recorded on the charts was converted to actual infiltration rates in centimeters per day (1 inch/day is about 2.5 cm/day).
Each infiltration experiment consisted of two wettings. The first was either with high-quality water (electrical conductivity [EC]=0.3 mmho/cm, sodium adsorption ratio [SAR] < 0.1), or with sodium-added water (EC=2.6 mmho/cm, SAR=8.4). Electrical conductivity increases in a linear fashion with an increasing amount of salts, whereas SAR is an index for the amount of sodium ions in the soil water. For both treatments, this first wetting was followed by deionized water applied 4 to 6 weeks later during a second wetting. Each treatment was replicated four times.
The effect of water quality on infiltration was tested at two locations 330 feet apart in the same field (referred to as WEST and EAST). We measured infiltration rate from 16 infiltrometers, 8 at the western and 8 at the eastern location.
Water content changes with depth were monitored with a neutron probe during and after each infiltration test. The water content measurements gave us an independent measure of the total amount of water infiltrated and indicated the position of the wetting front during the infiltration tests. The following soil surface properties were measured before the first wetting: electrical conductivity of saturation paste EC (mmho/cm); pH; percentages of sand, silt, and clay; cation exchange capacity (CEC); and extractable sodium, potassium, magnesium, and calcium (all in meq/100 g dry soil). The EC and extractable cations were also determined after the first and second wettings.
Analysis of tests
Infiltration rates are characterized as a function of time to t=0.35 days for each of the infiltration tests (fig. 1). We measured eight infiltration curves: four replicates for each of the first and second wettings. For some fields, the first wetting was made with low-sodium water (EC 0), whereas for others sodium was added to irrigation water (EC 2).
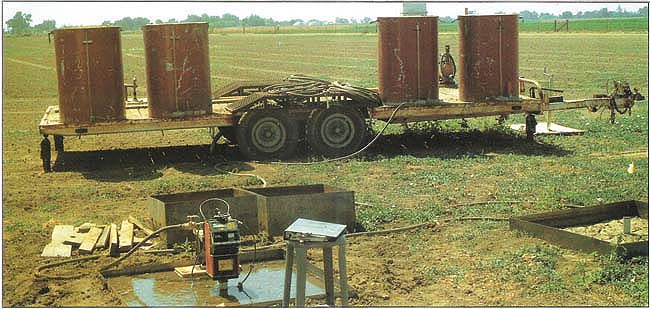
Low-sodium and sodium-added irrigation waters were stored at the test site and applied to small experimental plots. The neutron probe (foreground) measured the presence of water at various depths during first and second wettings for each water type.
Without making any distinction between treatments or locations, a few general observations were immediately apparent. The infiltration rate and final infiltration rate (if) were lower for the second wetting than for the first. In all tests, a consolidated surface layer approximately 0.4 inch thick formed after the first wetting, which after a drying cycle between the first and second wettings decreased infiltration rates. Furthermore, the variation among replicates was greatly reduced in the second wetting, especially when sodium was introduced in the water supply. Apparently, when the soil surface was controlling infiltration, differences between replicates became small.
Differences between final infiltration rates for the first and second irrigation (if1 and if2) and in the ratio of the two final infiltration rates between treatments are shown in table 1. The results in table 1 show that the final infiltration rate for the second wetting is significantly smaller when sodium-added irrigation water (EC 2) is used in the first wetting. As expected, adding sodium to the irrigation water made chemical dispersion of the soil more likely to occur during a subsequent wetting with good-quality water.
Differences in the soil-extractable sodium and the electrical conductivity of the soil saturated pastes between water treatments are demonstrated in table 1 as well, and reflect the composition of the irrigation water used. Largely because of the significant difference in if2, the ratio of final infiltration rates for the second and first wettings is significantly smaller for the EC 2 treatment. Interpretation of the mean final infiltration rates between the EAST and WEST sections is less obvious. For the moment, we conclude that the mean if1 for the eastern section is significantly smaller than for the western section. No significant differences were found for the second wetting.
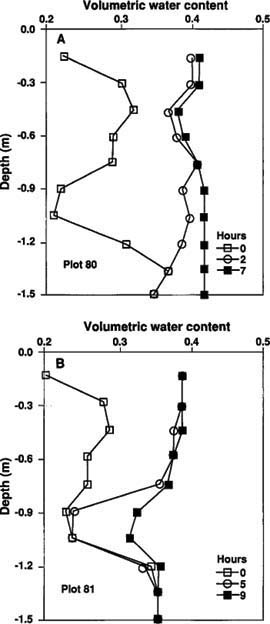
Fig. 1. Water content profiles for first-application flooding of plots 80 (A) and 81 (B) varied over time.

Fig. 2. Soil bulk density (A) and percentage sand (B) profiles, measured for plots 80 and 81 at 4-inch depth intervals.

TABLE 1. Comparison of average final infiltration rates (if1, if 2), sodium (Na) levels and electrical conductivity (EC) at the conclusion of first and second wettings for all treatments (eight observations per treatment)
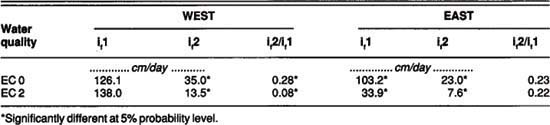
TABLE 2. Comparison of average final infiltration rates (if 1, if2) and ratios of final infiltration rate of second and first wettings for water quality treatments within each measurement location (four observations per treatment)
We also compared the infiltration results of the water-quality treatments within each of the two measurement locations (table 2). The dispersion effect of sodium on the final infiltration rate of the second wetting was significant for both the EAST and WEST sections. No water quality effect on if1 is apparent for the western section. However, if1 in the eastern section is significantly lower when sodium is added (SAR=8.4, EC=2.6) as compared to the high-quality irrigation water (SAR <0.1, EC=0.3). If there were an effect, one would expect the opposite to occur. Clearly, something else is controlling infiltration.
Soil variability
To investigate the location effects on infiltration further, we compared the mean and standard deviation of the textural and chemical properties for the top 1 inch of soil at the western and eastern infiltration test sites before the first water application (table 3). None of the differences between any of the listed properties were significant. Therefore, differences in infiltration characteristics between locations were not caused by differences in soil surface properties.
Water content measurements were taken during each water application for each infiltration test. Figure 1 shows water content as a function of depth at different times after the first wetting of two infiltration tests in the EAST section, plots 80 and 81. Plot 80 represents a high-quality irrigation treatment, whereas plot 81 was a sodium-added treatment. The plots were 10 feet apart.
The two plots differred in how the wetting front moved down the profile. After 2 hours of infiltration, almost the entire profile of plot 80 was at near saturation, whereas the wetting front in plot 81 seemed stagnated by an impeding layer at about the 90 cm depth. Even at the end of the first wetting (9 hours), the wetting front had not reached 1.5 m (5 feet). Based on the infiltration test measurements, cumulative infiltration values in plots 80 and 81 after 8.4 hours of ponded wetting were 63 and 21 cm (25.0 and 8.5 inches), respectively.
Based on these different water content profiles, we decided to sample the soil in both plots at 4-inch depth increments. The samples were used to determine dry bulk density and soil texture. Figure 2a compares dry bulk density with depth for plots 80 and 81. The differences in bulk density are small, and probably do not account for such a large difference in infiltration rate.
We believe that differences in textural stratification contribute significantly to the infiltration rate variation. Figure 2b shows percentage sand as a function of depth for the same two plots. Both soil profiles have a sandier layer beginning at an approximate depth of 90 cm (3 feet). The sandier layer of the slow infiltration profile (plot 81) contains more sand and is thicker. In addition, the sand fraction of this thicker layer consists of much coarser sand particles than the subsoil layer of plot 80. Just as a clayey layer impedes water movement in a coarse-textured soil profile, so can a sandy layer in a fine-textured soil. The soil-sampling results indicate that layering occurs in some of the test plots in the EAST section of the field.

TABLE 3. Differences in soil surface properties between WEST and EAST locations before the first wetting*
Additional evidence that soil layering may account for spatially variable infiltration rates comes from a comparison of cumulative infiltration with increase in water storage. Our studies show that cumulative infiltration strongly overpredicts the water storage increase measured with the neutron probe. That is, the measured amount of water stored in the soil is less than the measured amount of water infiltrated. Most likely, the discrepancy is caused by horizontal flow of water at the sandy layer interface.
Further sampling at all sites within the field to a depth of 1.5 meters (5 feet) has shown that the thickness and texture of the sandier layer vary greatly throughout the field.
Conclusions
The results of the infiltration study show that adding sodium to irrigation water decreases soil infiltration during subsequent irrigations, most likely because of chemical dispersion. We also observed that infiltration decreased during the second wetting for all infiltration tests. Prolonged ponding created a consolidated soil layer at the surface. This layer restricted water infiltration, especially when the soil dried between irrigations.
The significant differences in infiltration characteristics between measurement locations were attributed to soil heterogeneity below the soil surface. Specifically, the presence and thickness of a sandier layer at a depth of 90 cm (3 feet) greatly affects infiltration. Such variations in soil profile characteristics may obscure soil surface effects on infiltration as induced by tillage or water quality treatments.
We therefore suggest that such treatment effects be investigated only after the general soil profile characteristics and their spatial variation within the area of measurement are known. Alternatively, if appropriate, ponding time may be reduced to prevent the wetting front from reaching impeding layers.
Water quality and subsurface soil variabilities affect infiItration

