


All Issues
The cost of the glassy-winged sharpshooter to California grape, citrus and nursery producers
Publication Information
California Agriculture 68(4):161-167. https://doi.org/10.3733/ca.E.v068n04p161
Published online October 01, 2014
NALT Keywords
Abstract
In the late 1990s, widespread outbreaks of Pierce's disease in grapevines were linked to transmission via the glassy-winged sharpshooter (GWSS), threatening California's multibillion-dollar table, raisin and wine grape industries. Government agencies responded to the crisis by implementing two control programs to manage GWSS. We analyzed the long-term economic impact of these two programs on citrus, grape and nursery producers. The net economic effects on all citrus producers and on grape producers in the southern San Joaquin Valley were insignificant, while all grape producers in the Temecula Valley saw an average increase in annual production costs of about $13.04 an acre. Based on our survey of nurseries in Southern California, approximately 11% had an infestation in 2008 and 2009, but only 3.0% in 2010. Average losses to nurseries per GWSS infestation were about $12,238. Nursery producers also undertook a variety of pest control methods to prevent infestations and plant losses, and to meet quarantine regulations. Average annual per-acre costs of these approaches were $2,975 for barrier methods to prevent GWSS from entering a premises, $1,032 in pesticide controls and $1,588 for in-house monitoring.
Full text
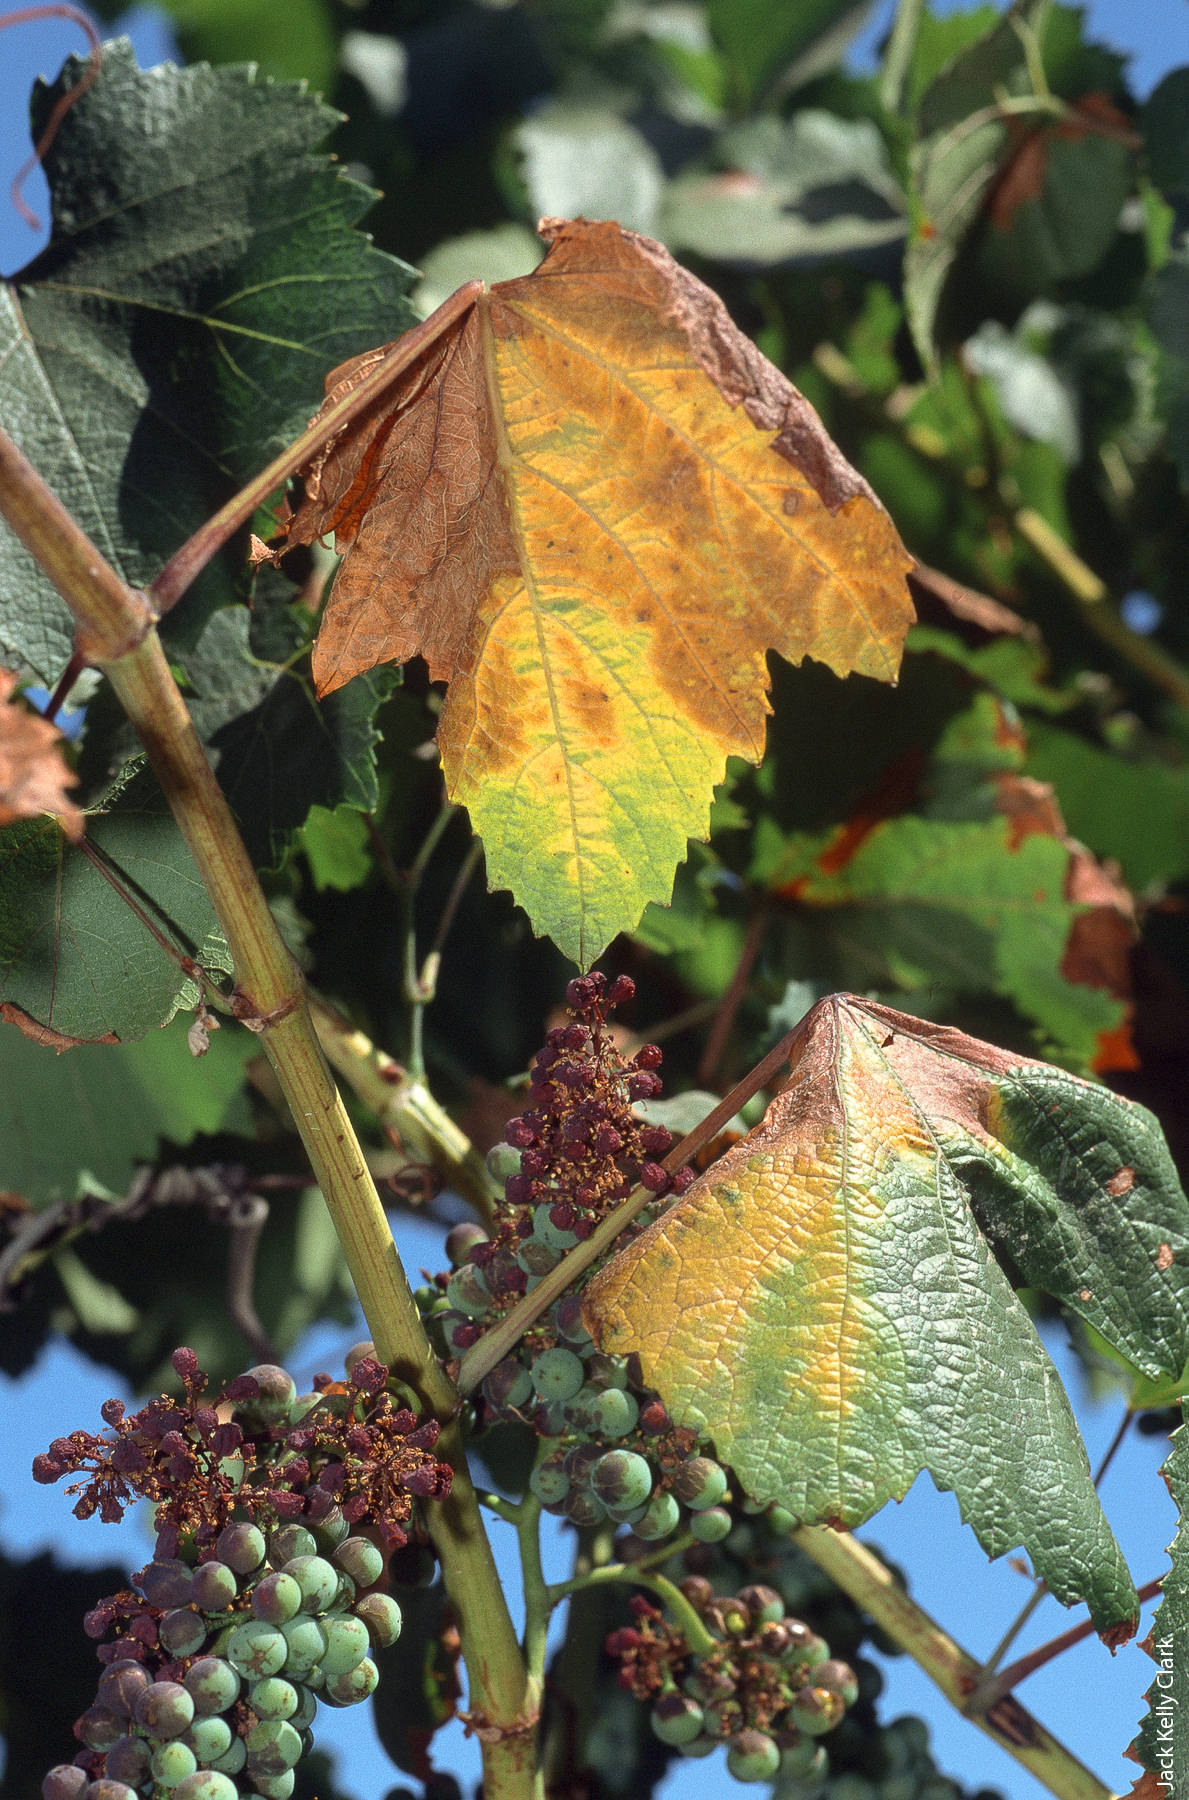
In 1989, a pest new to California, the glassy-winged sharpshooter (GWSS), was collected in Irvine. Since then, it has been identified throughout Southern California and has spread into the southern San Joaquin Valley, including Kern County, parts of Fresno and southern Tulare counties, and to the coastal counties of Ventura, Santa Barbara and San Luis Obispo. The main commercial hosts for GWSS are citrus, grapes, almonds and alfalfa. GWSS overwinters in citrus, avocados, riparian vegetation and on several ornamental plants, such as crape myrtle. As grapevines and almond trees leaf out in the spring and summer, GWSS moves onto those hosts. Feeding by GWSS generally does not result in economic losses, and it was initially treated as a harmless pest. However, in the early 1990s, widespread outbreaks of oleander leaf scorch in Southern California, followed by significant outbreaks of Pierce's disease (PD) in table, raisin and wine grapes in the Temecula Valley in the late 1990s, were linked to transmission of the causal bacterium, Xylella fastidiosa, via GWSS.
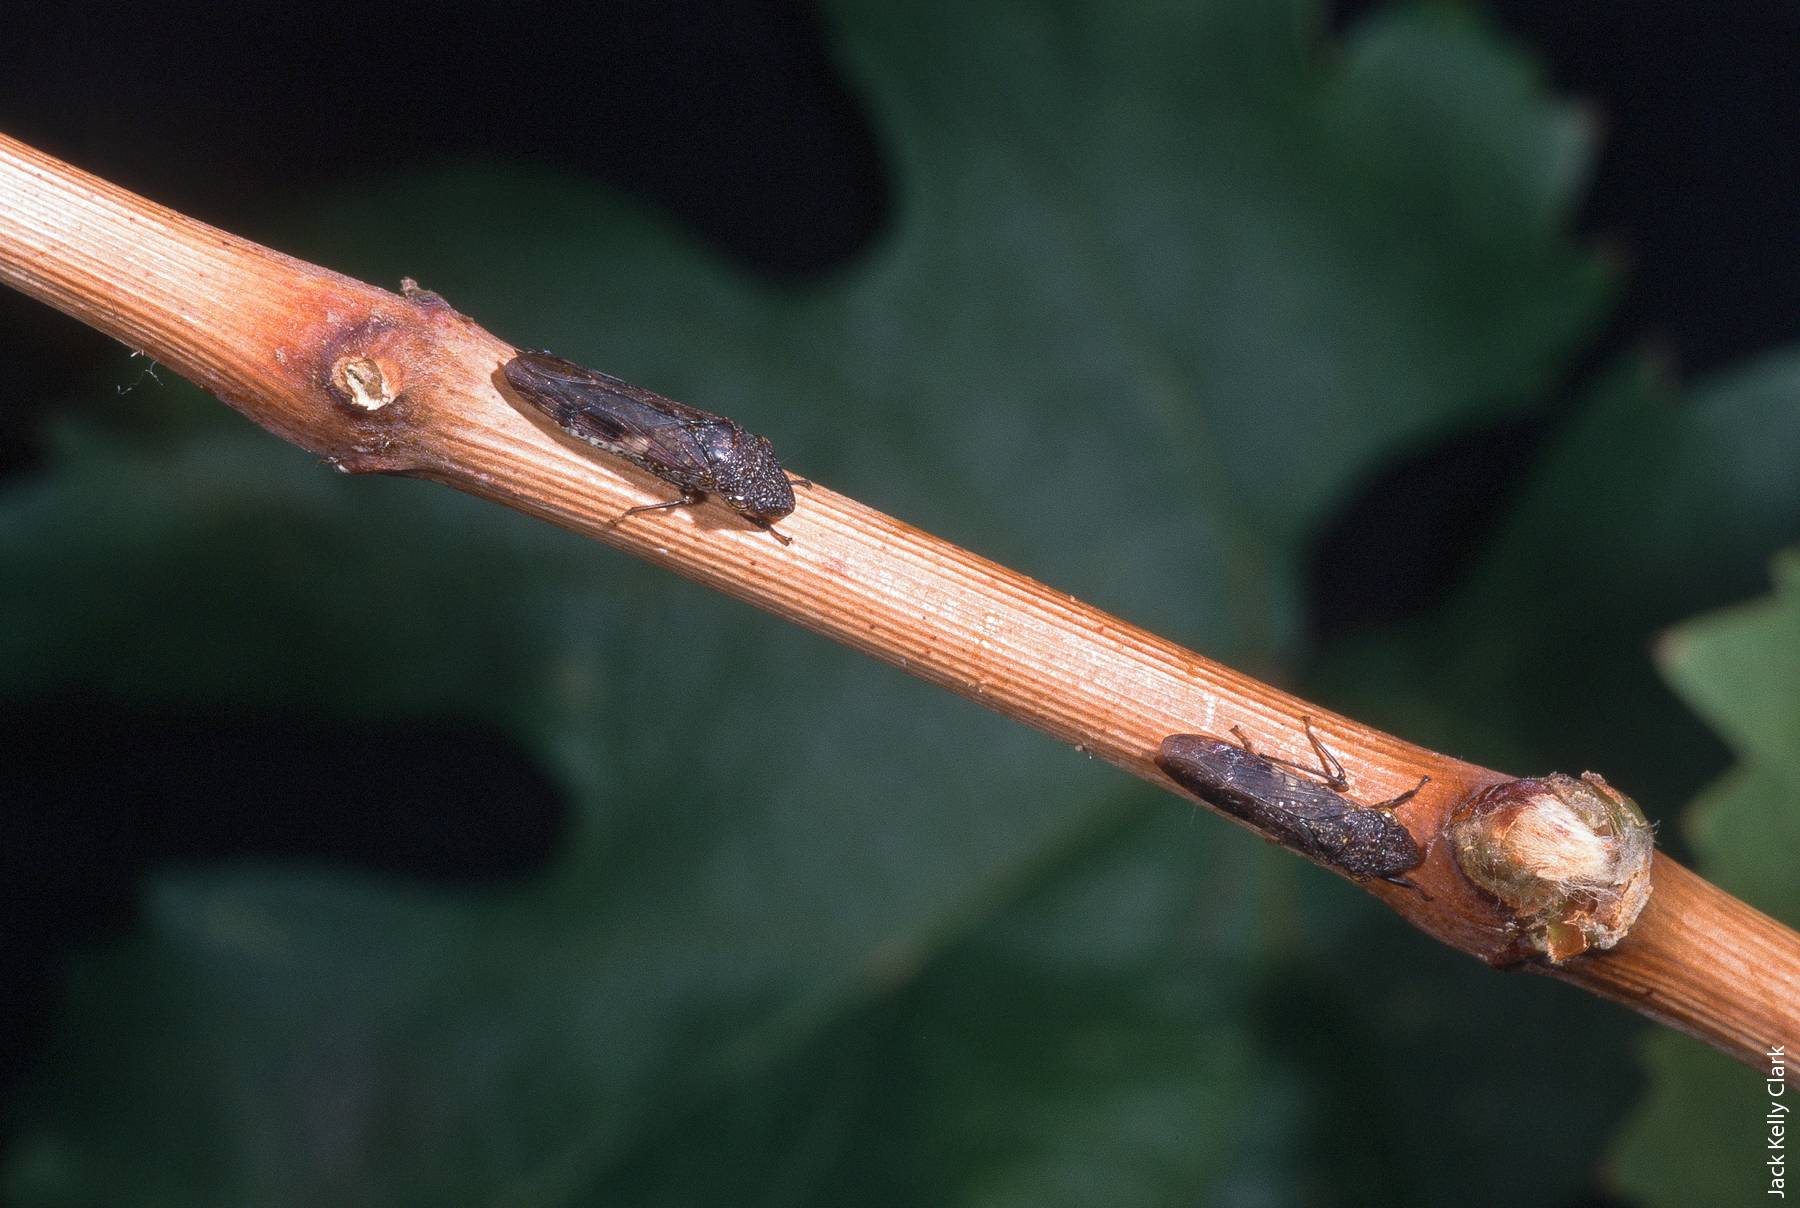
Glassy-winged sharpshooter (Homalodisca vitripennis) caused widespread outbreaks of Pierce's disease in Southern California. Initially, before it was identified as a vector of the disease, it was treated as a harmless pest.
At the height of the outbreak in the Temecula Valley, about 200 acres, or 10% of the total grape acreage in the Temecula Valley, was lost to PD (Siebert 2001). These outbreaks were followed in 2001 by widespread PD outbreaks in grapes in parts of the southern San Joaquin Valley, raising concerns for the health and economic viability of California's nursery industry and multibillion-dollar grape industry (USDA NASS 2011). Shortly thereafter, the California Department of Food and Agriculture (CDFA) changed GWSS's rating from a “C” rated pest (an organism not subject to state-enforced action except to provide for pest cleanliness in nurseries) to a “B” rated pest (an organism of known economic importance subject to eradication, containment, control or other holding action at the discretion of the individual county agricultural commissioner [CAC]).
Federal and state agencies responded to the crisis by implementing control programs to manage and contain GWSS. In 2000, CDFA placed a quarantine on the movement of plant material from GWSS-infested areas to GWSS-free areas within California. Plant material can be fruit, twigs or leaves collected during fruit harvesting, or nursery stock. The quarantine required that all bulk citrus and grapes moved from an infested area to a clean one meet one of the following criteria: surveys show that (1) the grove or vineyard is free of GWSS, (2) fruit harvest was done in compliance with methods that will eliminate vectors or (3) postharvest treatments were completed to remove the vector (CDFA 2013b).
The CDFA quarantine for nurseries required that all plants transported from areas with known GWSS populations to GWSS-free areas of the state be shipped under a Blue Tag protocol (Kabashima et al. 2008). This protocol required that the plant material be visually inspected by the CAC's office prior to shipment and be held for inspection by the destination county's agricultural commissioner's office. Counties enforcing the Blue Tag restriction were Alameda, Contra Costa, Fresno, Lake, Mendocino, Monterey, Napa, San Joaquin, Sonoma and Tulare. Under the Blue Tag protocol, if GWSS were detected in the load at the destination site, at the discretion of the CAC, it could be sprayed, rejected and/or reloaded on the truck to be transported out of the county back to the sender, or to another county not requiring the Blue Tag protocol (but only with the permission of the new destination county), or destroyed. Shippers and receivers who violated the quarantine's nursery stock regulations were also subject to fines. In 2010, 99.99% of the 50,600 shipments of nursery stock shipped under the Blue Tag protocol were free of any viable life stages of GWSS. Only six shipments were intercepted due to egg masses (four), nymphs (one) or adults (one).
In 2001, the U.S. Department of Agriculture Animal and Plant Health Inspection Service (USDA APHIS) implemented an area-wide treatment program that involves the coordinated control of GWSS on citrus in infested areas where citrus is grown in proximity to grapes. In these areas, GWSS are monitored, and when they exceed treatment thresholds, GWSS populations are controlled before they can move into vineyards and transmit the PD bacterium. Any citrus grove located within one-quarter mile of a trapped grapevine (i.e., a trap that has captured a GWSS) is treated. The exception is a grove located along the northern boundaries of GWSS infestation in the San Joaquin Valley and the California coast. In this case, the barrier is one-half mile from a trapped vine. Areas with active area-wide programs include Kern County, the Temecula and Coachella valleys, and parts of Ventura, Fresno, Madera and Tulare counties (CDFA 2013a). While some citrus producers may benefit from the control of GWSS in their groves, it was thought chemical treatments might also disrupt integrated pest management control practices, imposing additional costs on the citrus industry. Currently, CDFA manages the federally funded area-wide program as part of its Pierce's Disease Control Program in coordination with USDA APHIS, infested counties, and treatment coordinators.
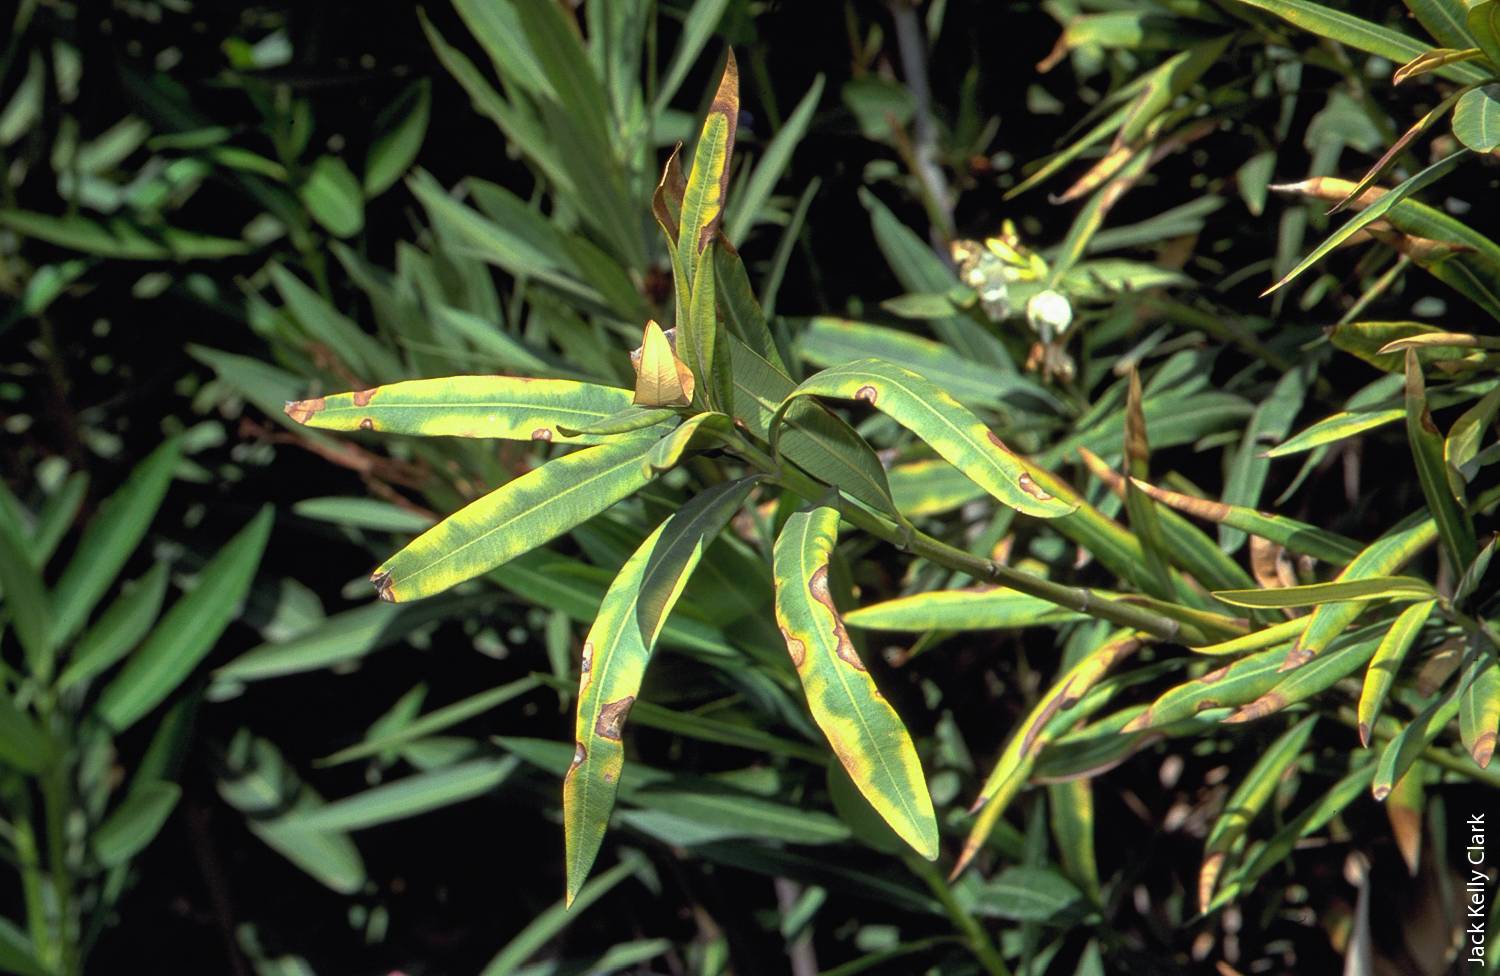
Oleander is a GWSS host. The yellow, brown, dying leaf margins are a symptom of bacterial leaf scorch vectored by GWSS.

A yellow sticky trap monitors the GWSS population in an almond orchard. GWSS overwinters in citrus, avocados and riparian vegetation and moves into almond orchards and grape vineyards as they leaf out in spring.
In addition to the public programs instituted by USDA APHIS and CDFA, the grape producers and nurseries most affected by PD and GWSS quarantine undertook their own private measures to prevent the spread of the disease and vector. In 2001, grape producers assessed themselves a fee of $3 per $1,000 in revenues to fund research and other activities. As part of this effort, in 2002, the PD/GWSS Board funded a nursery treatment reimbursement program in Ventura County; Riverside County was added in 2008. Both counties' programs are currently active, with eight to 12 nurseries in Ventura County and one nursery in Riverside County receiving reimbursements twice a year. To receive reimbursement, the CAC must verify that the nursery is an active in-state shipper, has a GWSS compliance agreement and has a high enough GWSS population to justify treatment. In 2005, CDFA implemented the Nursery Stock Approved Treatment Program (NSATP), a 3-year pilot that evaluated whether nursery stock that was treated just before shipping, with insecticides that provided 100% control in research experiments (carbaryl or fenpropathrin), would provide the same level of efficacy in real-world conditions. The NSATP pilot was 100% effective, with no viable life stages of GWWS detected during the 3 years of the project, which resulted in qualifying nurseries utilizing the NSATP protocol to ship to noninfested areas without an origin inspection.
Even with these control programs, grape producers and nurseries often needed to treat or otherwise manage GWSS, affecting crop production costs. How GWSS control affected private control costs depended on the actual pest treatment costs, plus any changes in cultural practices such as pruning, irrigation or nursery management. The net effect of private control costs, however, depended on how any additional control measures affected the frequency with which they substituted for or reduced current pest control treatments. Finally, private control costs for grape producers may be affected by increases in the rate of PD compared to the pre-infestation levels, even with GWSS control.
Measuring the costs of GWSS control
To estimate the effects of CDFA and USDA APHIS control programs on producer management decisions and costs, data was needed on changes in cultural practices and the costs of those changes, the effect on other pest control decisions, and changes in nursery costs in infested regions. In November and December 2008, we held meetings in the southern San Joaquin Valley and the Temecula Valley with a UC Cooperative Extension farm advisor, six pest control advisers (PCAs) and producers, and two program managers to discuss the area-wide program and how the establishment of GWSS affected pest control materials applied, costs and nontarget pests. We obtained additional information on pest control practices and the current rates of PD in infested areas through phone interviews in 2009 and 2010 of 12 PCAs in Southern California and the southern San Joaquin Valley and UC Cooperative Extension county advisors. The costs estimated from these meetings were compared to UC Cooperative Extension budgets for grapes to determine how pest control treatments changed as a result of the treatments required for GWSS (Hashim-Buckley et al. 2007; Peacock et al. 2007a, 2007b; Vasquez et al. 2006, 2007). Costs and prices used in this analysis reflect those current for 2007–2008.
In 2011, to determine the economic effects of GWSS on the ornamental nursery industry, we sent an online survey to the 114 nursery producers in Southern California who ship under the Blue Tag protocol. The survey included questions on what type of nursery products they produced, whether they had ever had a GWSS outbreak, how outbreaks were treated and what preventative measures they took to prevent GWSS from entering their premises. The survey was pre-tested with select nursery operators in Southern California and final adjustments made. A total of 37 nursery producers responded.
Compared to nurseries that produce for the Southern California market, the nurseries that ship under the Blue Tag protocol need to be large and more diverse in order to supply the mass merchandiser box stores, retail nurseries and landscape installers. Thus, they have outdoor, shade house and greenhouse production at one location. Nurseries that do not ship to counties enforcing the Blue Tag protocol do not face the same regulations; consequently, they do not typically treat for GWSS. By sales, the nurseries that ship under the Blue Tag protocol represent about 40% to 50% of total sales by Southern California nurseries. The producers who responded to our survey have a product mix typical of those nurseries that ship under the Blue Tag protocol.
GWSS control costs for citrus
The first line of defense against the spread of PD by GWSS is the USDA APHIS area-wide control program whereby citrus producers treat orchards during the fall and/or spring to prevent the buildup of GWSS populations. To control for GWSS in citrus, an application of acetamiprid is typically made in late fall, followed by an application of systemic imidacloprid in the spring. Imidacloprid is applied at a rate of 0.5 pounds of active ingredient (AI) per acre through the irrigation system. Treatments and the breadth of the area to be treated are determined based on monitoring and trapping results. Under the public program, citrus producers are reimbursed for the total cost of their GWSS treatments, including all materials, labor and application costs, and participation in the program is voluntary.
Total costs of production for citrus producers under the area-wide program may be affected if treating for GWSS allows producers to forego an existing treatment, as GWSS control may control other citrus pests. Alternatively, treatments for GWSS may cause secondary pest outbreaks of nontargeted pests. In conversations with the authors, local producers, PCAs and managers of the area-wide program reported that there have been neither substantial cost savings nor secondary pest outbreaks. One reason is due to timing: Late fall control of GWSS in citrus typically occurs after beneficial insects have exerted control, and pesticide residues decline to negligible levels by the following year; thus, few secondary pest outbreaks are observed. Those who were interviewed felt that minor additional control of pests by spring treatments was balanced by the negative impacts of these treatments on beneficial species — thus, there was little net impact.
The CDFA quarantine program requires that fruit from infested areas be inspected and treated before leaving a quarantine area to be packed in a GWSS-free county. If GWSS are found in a producer's orange shipments, the producer bears the cost of treating GWSS in his or her grove if the producer did not participate in the area-wide program plus postharvest treatments. This aspect of the public control program is believed to encourage greater participation by citrus producers in helping to control GWSS. At the time of our meetings and interviews with PCAs, no citrus producers were incurring these costs in the San Joaquin and Temecula valleys.
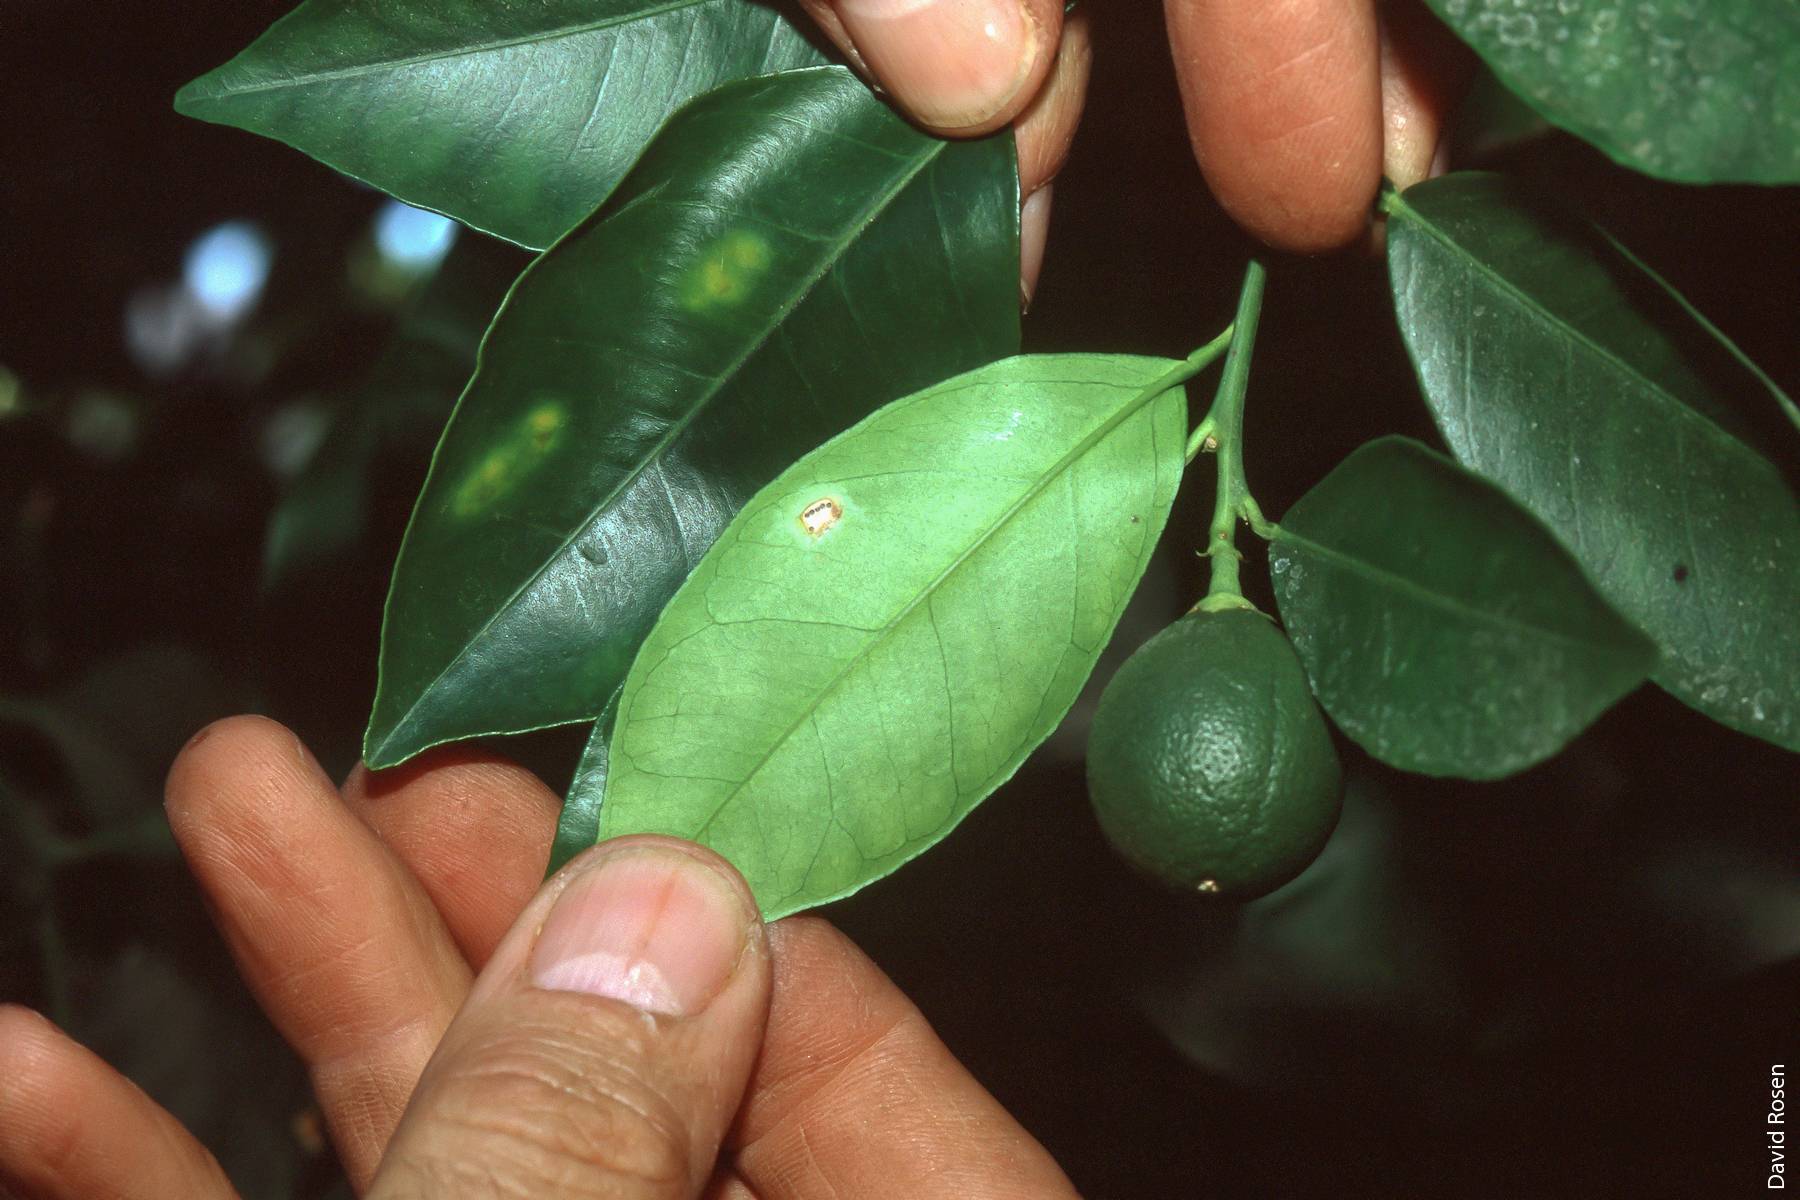
Applications of insecticides in late fall have avoided disrupting biological control and causing secondary pest outbreaks. This GWSS egg mass has been parasitized by a Gonatocerus species parasite.
GWSS control costs for grapes
The southern San Joaquin Valley.
The second line of defense against the spread of PD is for individual grape producers to treat their grapevines for GWSS. Producers typically apply treatments to provide immediate control in case GWSS enters the field, not because it has been identified in their fields. This treatment consists of one application of systemic imidacloprid annually, right before the first leaves appear in the spring. Applications of systemic imidacloprid are typically completed at the maximum rate of 0.5 pounds AI per acre through the irrigation system. The cost of applying imidacloprid was about $50 to $60 an acre in 2007. Since then, the cost of treating with imidacloprid has fallen due to competition from generic products.
Treatments for one pest often influence how another pest is treated. On grapes, GWSS treatments also control the variegated leafhopper and western grapeleaf skeletonizer. Treatments for these two pests were no longer typically needed, as the annual application of imidacloprid reduced these pest populations below economically damaging levels. We estimate that the cost savings by producers was $62 an acre, or about the same amount as the costs to apply imidacloprid in the southern San Joaquin Valley in 2007–2008. Insecticides used to prevent GWSS establishment in vineyards also control the vine mealybug, which was first found in the Coachella Valley in 1994 and has since spread throughout several grape-growing counties in California, including Kern County in the southern San Joaquin Valley.
Grape producers may also suffer losses if the incidence of PD is higher than it was before GWSS became established. According to the PCAs we interviewed during August 2010, the incidence of PD in the southern San Joaquin Valley is at about the same level, or slightly less, than it was before GWSS invaded. As a result, we estimate that producers in southern San Joaquin County had no additional costs due to changes in the incidence of PD in their area.
Finally, grape producers interviewed by the authors reported that they did not incur additional costs due to the quarantine on the movement of grapes. Grapes destined for the fresh market are hand-harvested and field packed, meeting the quarantine regulations that no plant material be transported with the fruit. The movement of bulk grapes did not require postharvest treatments, as bulk grape producers within an infested area can meet quarantine regulations through shipping grapes to processing centers within the infested areas, or by treating vineyards if surveys show the presence of GWSS.
The Temecula Valley.
Private treatment of GWSS in grapes in the Temecula Valley also consists of an annual application of imidacloprid. With the imidacloprid treatments, producers in the Temecula Valley no longer needed to treat for the grape twig borer. As was the case in the San Joaquin Valley, the cost savings for treating secondary pests just about offset the additional costs of imidacloprid.
Because there is greater GWSS pressure in this region, however, some grape producers located near citrus groves in the Temecula Valley treat vineyards with one or two additional sprays of fenpropathrin in about 5% of the grape acreage per year. Fenpropathrin is applied at a rate of 11 ounces per acre, with the cost per ounce equal to $1.62. With two treatments per year, the cost to treat with fenpropathrin was $35.64. Custom application costs were an additional $25 per acre per application. The average costs per acre to apply fenpropathrin, prorated to the 5% of acreage that was treated, were $4.28 (table 1).
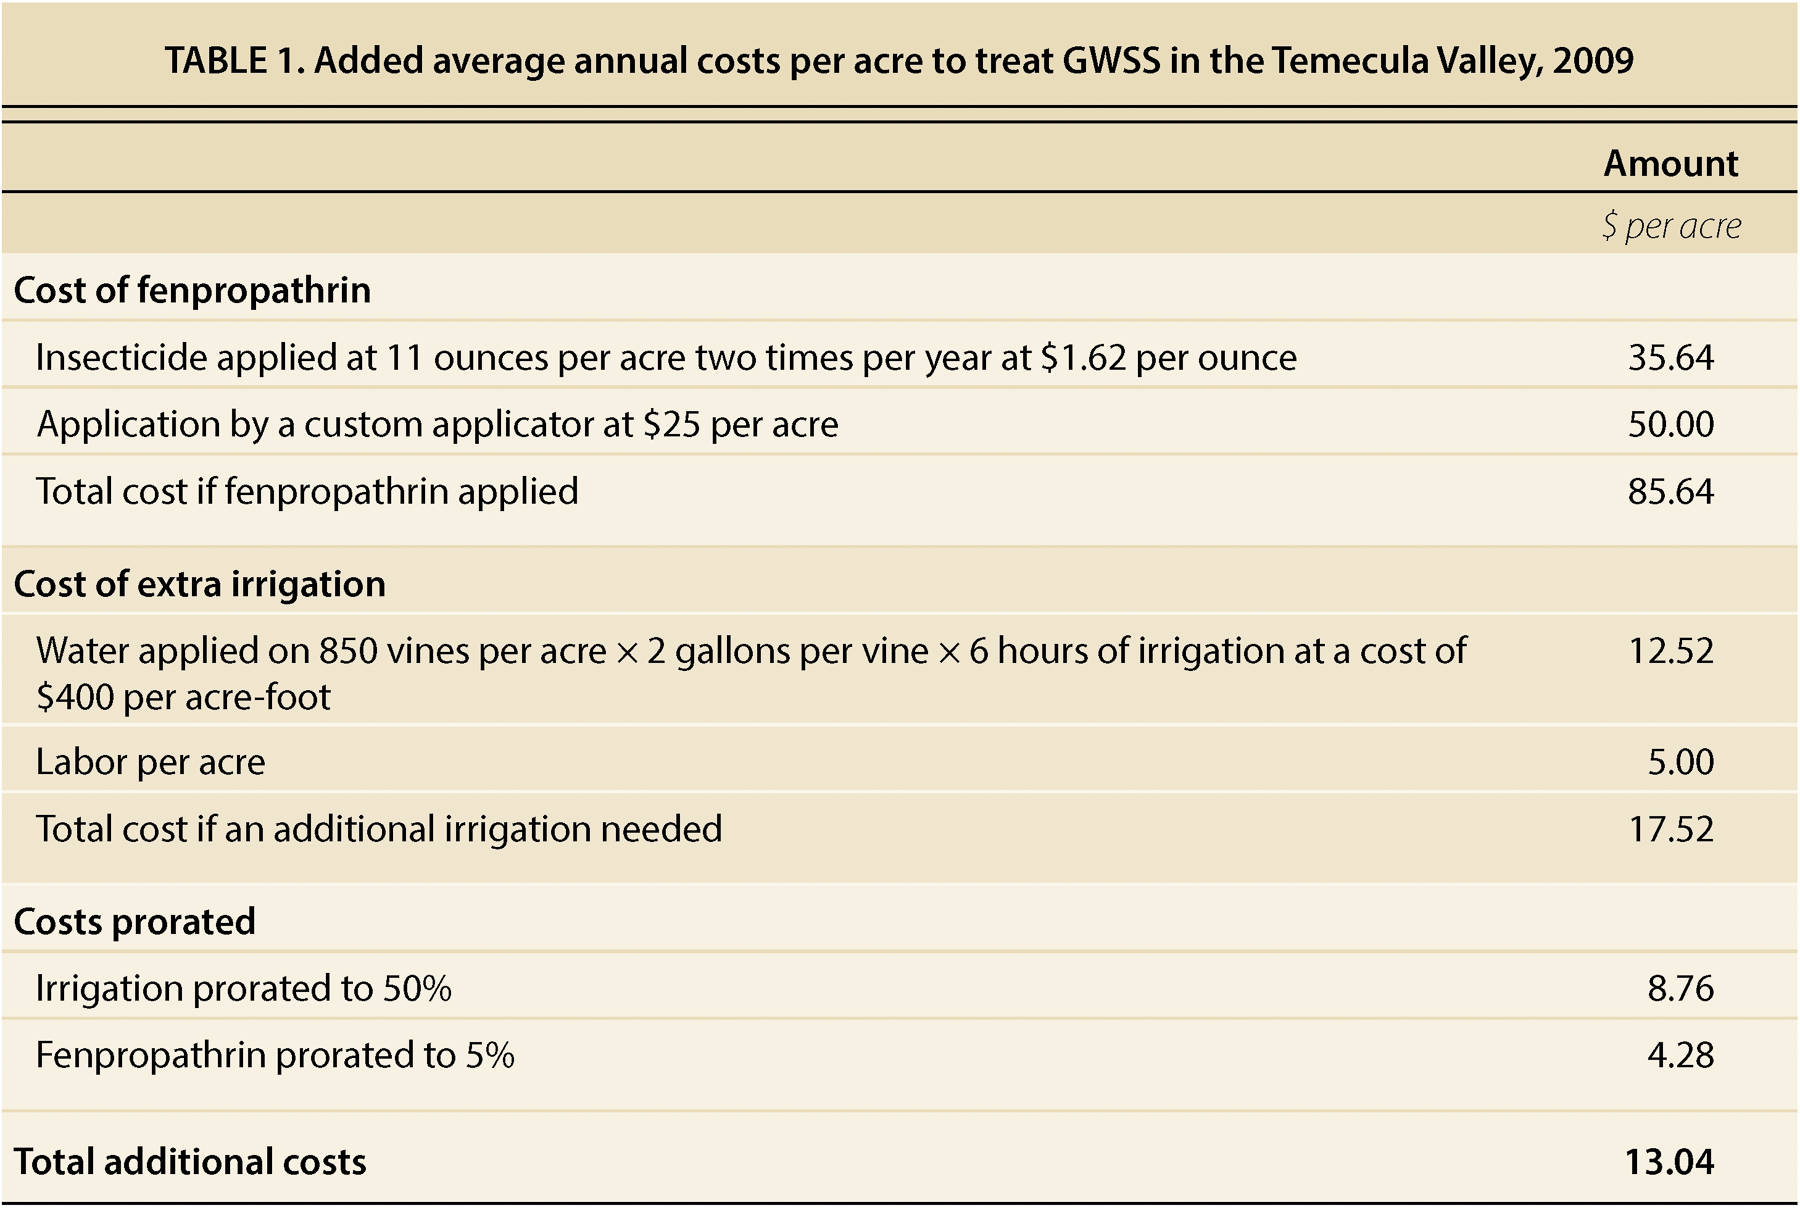
Furthermore, the Temecula Valley has a drier climate than the San Joaquin Valley. In order for producers to apply imidacloprid when it can do the most good, a separate irrigation may be required. We held meetings with farm managers and PCAs, who estimated that half the time they need to complete a separate irrigation in order to apply imidacloprid. The additional irrigation was estimated at 2 gallons of water applied per vine per hour over 6 hours (with an average of 850 vines per acre). At a cost of $400 per acre-foot during the time period covered by this study, the total additional cost to irrigate was estimated to be $17.52 per acre (table 1). Prorated to 50% of the time an additional irrigation was needed, the additional cost was estimated to be $8.76 per acre. We estimated that the total cost of the extra fenpropathrin on 5% of the acreage and extra irrigation on 50% of the acreage was $13.04 per acre per year (table 1).
Grape producers in the Temecula Valley had a slightly higher incidence of PD in 2007, at 2% to 3%, up from about 1% before the establishment of GWSS. While there were a few large plots that were infested, PD in grape vineyards tended to be localized. Producers typically pulled vines and replanted instead of removing a whole plot; based on UC Cooperative Extension wine grape budgets for the San Joaquin Valley, the cost to replant about 2% of vines a year was $65 per acre (Hashim-Buckley et al. 2007; Peacock et al. 2007a, 2007b; Vasquez et al. 2006, 2007). We estimate that the total cost of GWSS and PD management was about $78 an acre per year in the Temecula Valley.
There were no market effects for grape producers and consumers from GWSS establishment in California. The success of the GWSS area-wide control program caused few changes in the costs of production for producers in the southern San Joaquin Valley, where much of California's table grape and raisin production occurs. Additional costs to treat GWSS were offset by cost savings on other pests. Although producers in the Temecula Valley incurred higher costs of production, with about 1,300 acres planted in wine grapes, their share of total grape production in California was less than 3%, a share too small to influence markets significantly. As a result, the higher costs of production were not offset by increases in market prices, and the net change in producer revenues was equal to the changes in the costs of production. Given that only producers in the Temecula Valley incurred higher costs of production, we estimate the total increase in the annual direct costs to the entire grape industry in California to be about $103,000 per year.
To contain the spread of PD, the California Department of Food and Agriculture placed a quarantine on the movement of plant material from GWSS-infested areas to GWSS-free areas within California. Above, discoloration of grape foliage caused by PD and sunburn on fruit in a Sonoma County vineyard.
Additional costs to grape producers.
Grape producers of wine, wine vinegars and juice concentrates pay an assessment to the PD/GWSS board (PD/GWSS Research Board 2013). In 2001, the assessment was $3 per $1,000 in farm revenues. By 2008 and 2009, the rate had fallen to $1 per $1,000 in farm revenues; in 2010, it fell to $0.75. As of 2009, this assessment had raised a total of $34 million (PD/GWSS Research Board 2013). While cumulatively the assessment represents a significant funding source to address the GWSS problem, the assessment rate represents less than 0.5% of revenues, and again there are no market effects to producers and consumers due to the cost of the assessment.
GWSS control costs for nurseries
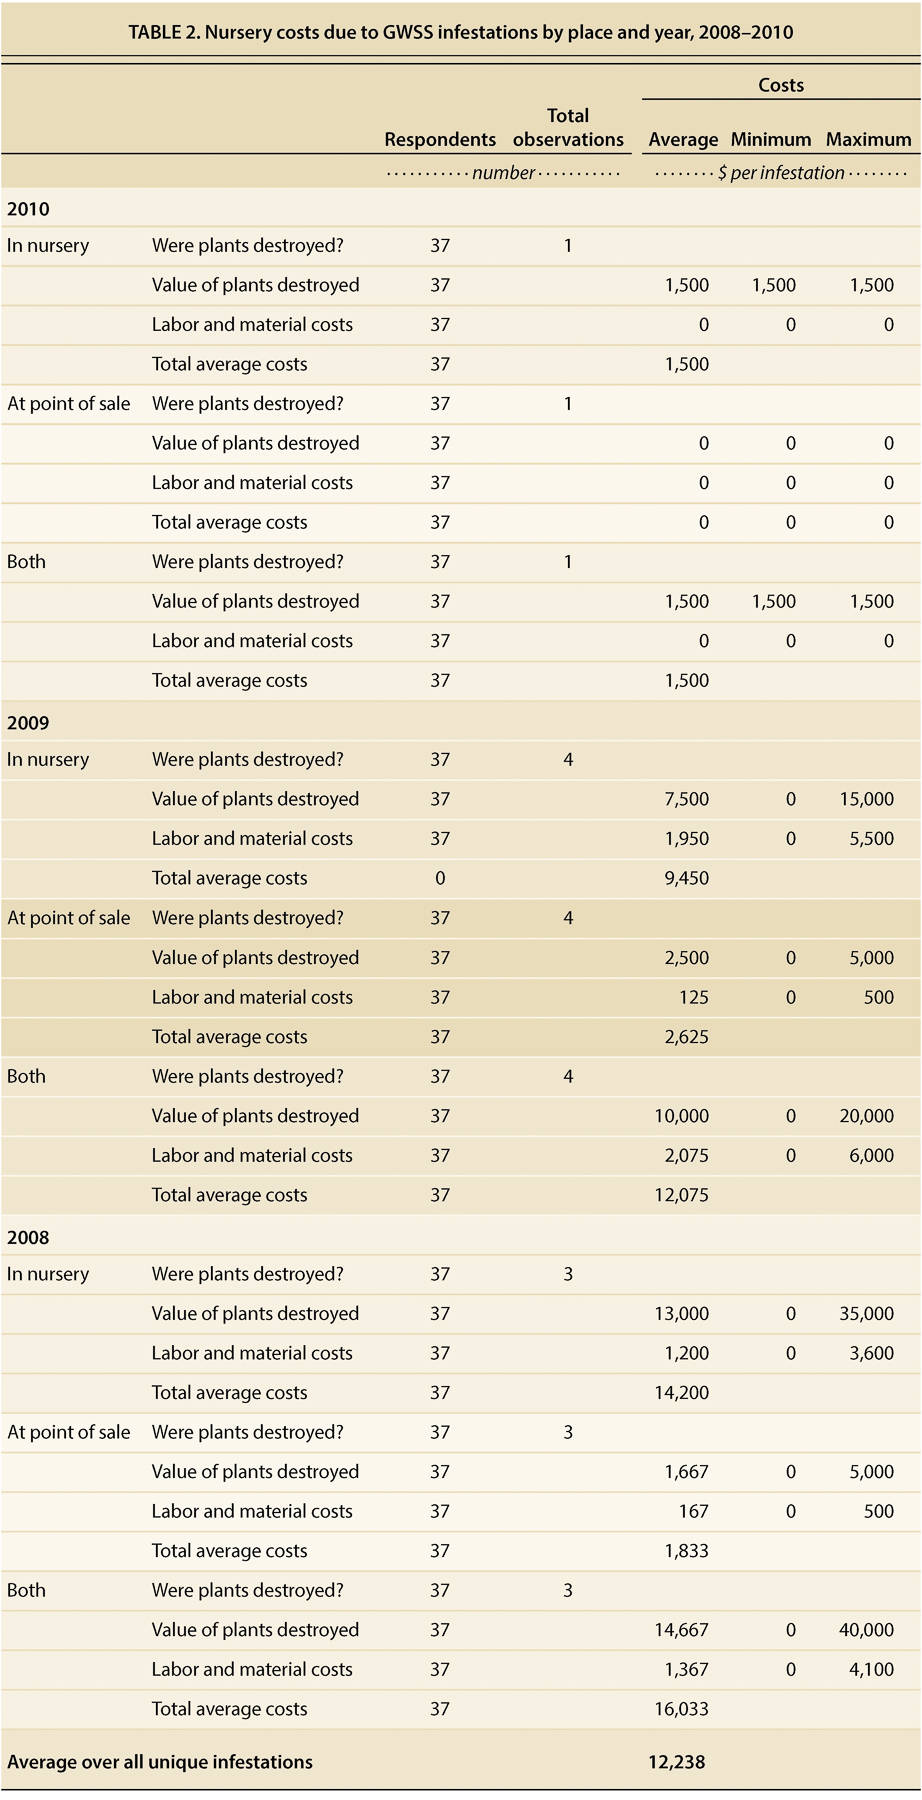
Out of the 37 nursery operators who responded to our survey, eight operations had to destroy plants due to the presence of GWSS in 2008 and 2009 (table 2).
Four nurseries (or 11%) of the respondents destroyed plants in 2009, the year with the greatest number of nurseries that had to destroy plants. In contrast, only one nursery had to destroy plants in 2010. The total cost of the destroyed plants, including wholesale value of lost plants, labor and materials, was $97,899, for an average loss of $12,238 per infested operation (table 2). However, costs varied widely by nursery from a low of $1,500 in 2010 to a high of $35,000 for plants destroyed in 2008 (table 2). The plants that were destroyed included broadleaf evergreens, deciduous flowering trees, deciduous shade trees, perennial herbaceous bedding plants, ornamental shrubs and annual bedding plants. Annual bedding plants were the plants listed most often by the respondents as the type of plant that needed to be destroyed either in the nursery or at the destination.
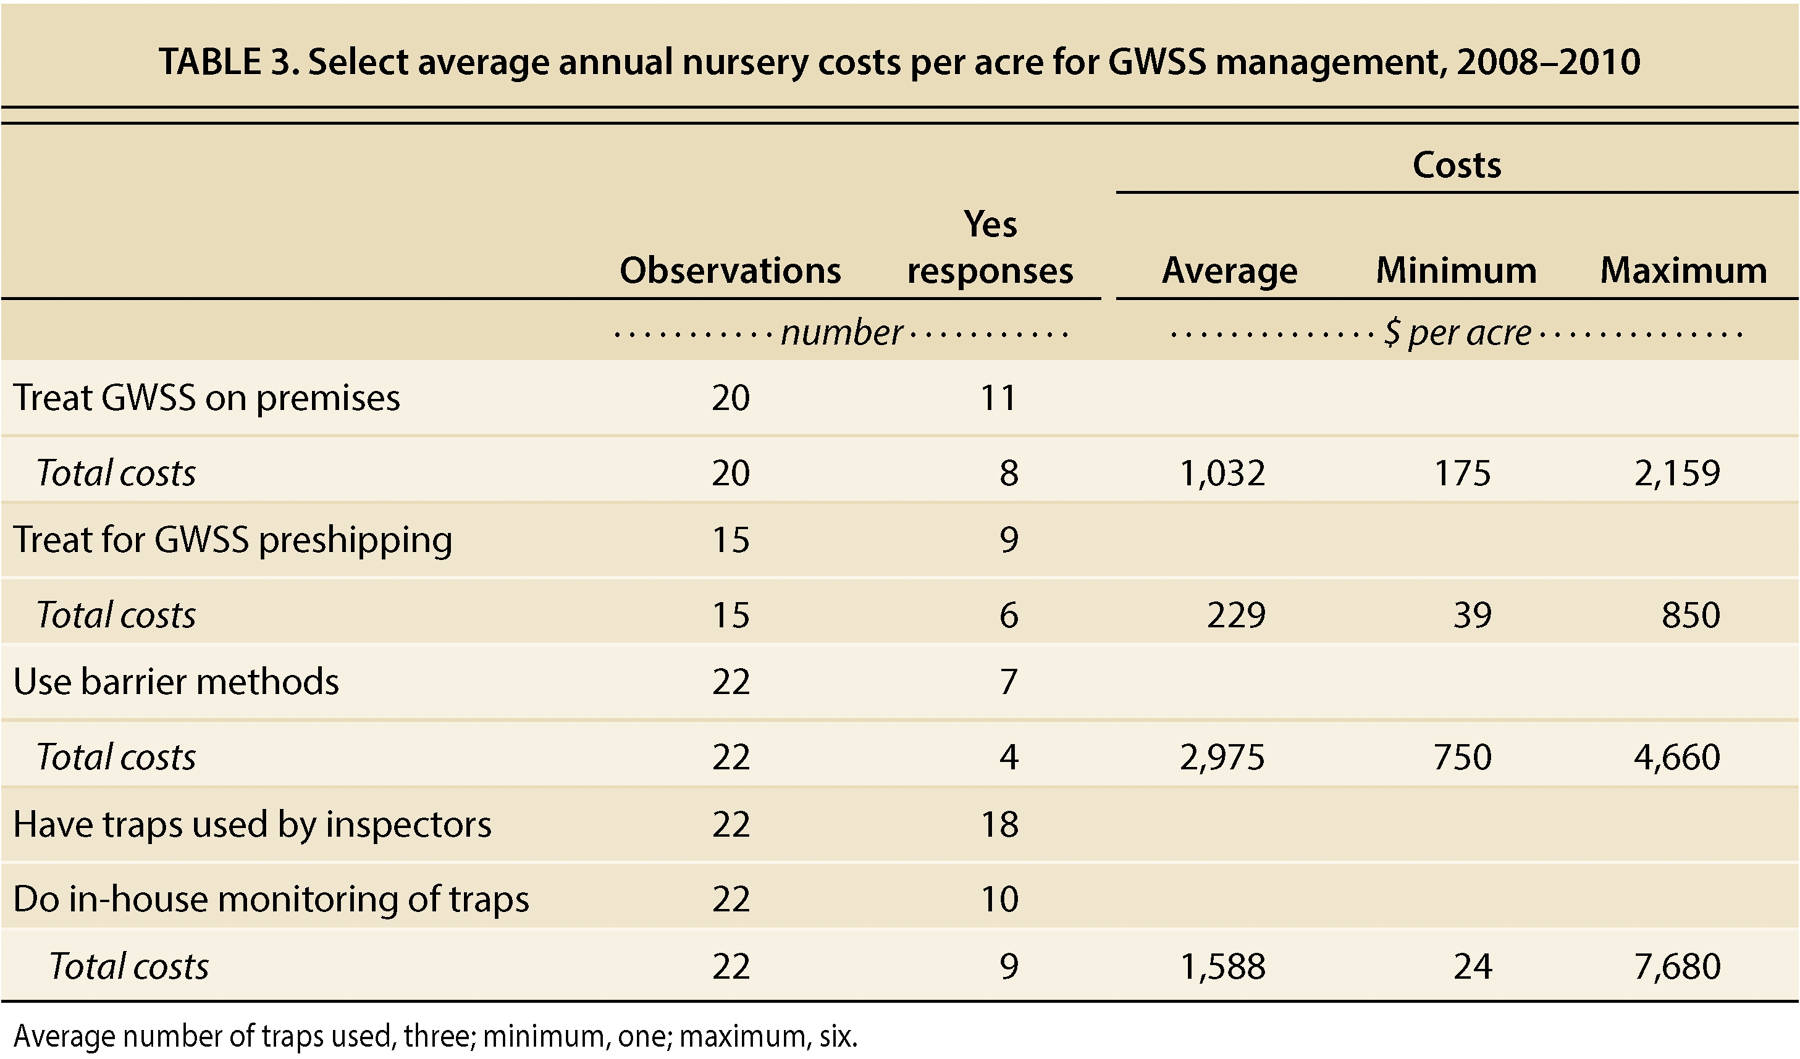
Over 50% of the nursery operators who responded (n = 20) to the question on GWSS management applied pesticides to manage GWSS (table 3). GWSS control occurred both during plant growth and as a preshipment treatment.
For both types of control, nursery producers used a variety of chemical treatments, including fenpropathrin, carbaryl, acetamiprid and abamectin. The average cost to treat nursery stock on the premises was $1,032 an acre. Costs again varied widely with a minimum cost of $175 an acre and a maximum or $2,159. The preshipment treatments were a lower cost per acre. The average cost was $229 per acre, with a minimum cost of $39 per acre and a maximum cost of $850 (table 3).
Our survey also asked questions on other methods used to prevent GWSS infestations and plant loss, including barrier methods to prevent the entry of GWSS (or otherwise manage GWSS) and the inspections of traps installed by CDFA. Almost 30% of the operators who responded to the question about methods (n = 22) used some type of barrier method. The methods used were shade cloths (three), an insect screen (one), sticky traps (one), oleander hedge (one) or a combination of all methods (one). Because oleanders are a GWSS host, it is probable that the nurseries who use oleander hedges are using them as a “trapping” hedge to monitor and treat for GWSS. With a diversity in methods, there was a diversity in costs. Costs ranged from $750 to $4,660 an acre, with an average of $2,975 (table 3). Both the minimum cost and maximum cost for the barrier methods were for shade cloths. Most of the barrier methods used provided additional protection against other pests; for example, insect screens protect against aphids and thrips.
Finally, nursery operators were asked about in-house monitoring of GWSS traps installed by CDFA. About half of the operators who responded to this question (n = 22) did some in-house monitoring. Monitoring varied though, from as frequently as once a week to as little as every other month. The average cost per acre to monitor was $1,588. The minimum cost incurred by a nursery was $24 per acre, and the highest was $7,680 (table 3). Among the nurseries who responded yes to this question, the two with the highest cost per acre to monitor traps also produced the greatest diversity of plants. The number of different plant categories produced by these nurseries was twice that of the nursery with the next highest number of plant categories. The nursery that produced plants from only one category also had the lowest cost per acre to monitor GWSS traps.
Impacts on producers
The establishment of GWSS and spread of PD fundamentally changed commercial agricultural practices for several table, raisin and wine grape producers, as they needed to carefully monitor fields for both the pest and disease to prevent vine death. With low GWSS populations, preventive measures undertaken by producers caused a negligible net change in the profitability of producing grapes.
Nursery producers experienced higher costs in some cases. Recurring costs were incurred for monitoring and preventing the entry of GWSS, and certain nurseries needed to treat when infestations were found. Nursery producers also experienced increased costs due to paperwork and coordination of treatments, inspections and notifications required by the Blue Tag and NSATP protocols (table 4).
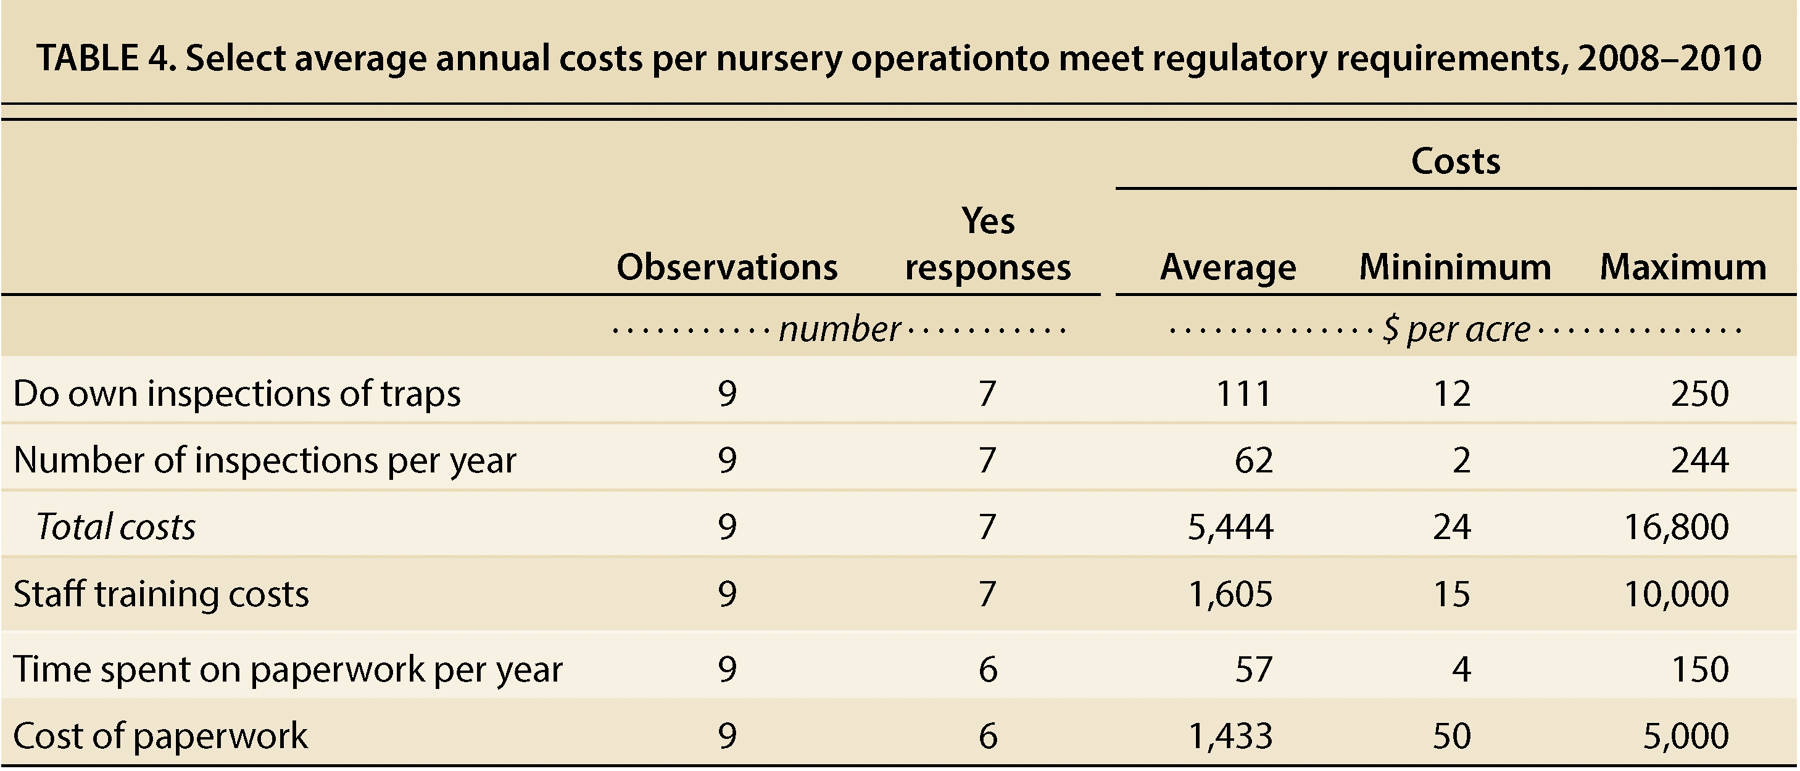
TABLE 4. Select average annual costs per nursery operationto meet regulatory requirements, 2008–2010
The largest impact of GWSS on agricultural producers occurred in relation to the area-wide management programs (San Joaquin Valley, Temecula, Ventura and Coachella). These programs allowed the coordinated treatment of a grape pest by citrus producers in order to prevent the spread of a deadly grape disease. As a result, the net effects in changes in pest treatments by commercial grape producers were negligible.
The area-wide programs have not been cost-free, however. These programs are managed and coordinated by the USDA and CDFA out of public monies. The cost of the GWSS area-wide treatment program was greater than $20 million a year in 2010. In comparison, the average farm-gate value in 2010 of the grape and nursery commodities produced in California was $3.2 billion for all grapes and $1 billion for floriculture production (USDA NASS 2011). While the benefits of the area-wide program are beyond the scope of this analysis, had the program not effectively reduced GWSS populations to current levels, much of the state's multibillion-dollar grape industry would have been at risk for the spread of GWSS and Pierce's disease.
The cost of the glassy-winged sharpshooter to California grape, citrus and nursery producers

