


All Issues
Cow cooling on commercial drylot dairies: A description of 10 farms in California
Publication Information
California Agriculture 71(4):249-255. https://doi.org/10.3733/ca.2017a0042
Published online November 15, 2017
PDF | Citation | Permissions
NALT Keywords
Abstract
California summers are hot, compromising the welfare and productivity of dairy cows. To minimize negative effects, producers use shade, fans and sprayed water. However, little is known about how those heat abatement strategies are provided in commercial conditions, nor their effectiveness. Ten dairies with drylots, a common housing system in California, were assessed for strategies provided, and the cows' responses to heat load were observed for 3 days in the afternoon. Dairies were diverse in all aspects. Shade varied in terms of placement (at corral and feed bunk or at corral only) and amount (28 to 74 square feet, or 2.6 to 6.9 square meters, per cow). The quantity of water used to spray cows ranged from 0 to 6.8 gallons (0 to 25.6 liters) per hour per cow. Across dairies, there was a range in the cows' shade use (47% to 98% of herd) and feeding activity (7% to 33% of herd). Respiration rates ranged from 65 (normal) to 95 breaths per minute (very hot) and were positively related to inactivity. Our results indicate that there are opportunities to improve cooling, and consequently dairy cattle welfare, in drylots.
Full text
Milk is the most valuable agricultural commodity produced in California, the top dairy-producing state in the country (Sumner et al. 2015). In the western United States, 30% of dairy farms keep about 1.8 million lactating cows in drylots (open, dirt-based pens), where sheltered areas may or may not be available (USDA 2016). Drylots are thought to be advantageous, in comparison to other intensive housing systems (e.g., free-stalls, concrete-floored pens where cows have access to lying areas that are sheltered), because of lower disease prevalence (e.g., lameness and mastitis), better reproductive outcomes (USDA 2010) and lower capital costs (Stokes and Gamroth 1999). Despite the benefits, though, drylots are located mostly in arid areas, where heat load can compromise the profitability and the welfare of cows, especially during summer months.
Heat load reduces cows' feed intake and milk production; reduces fertility; and leads to increased culling and mortality rates (St-Pierre et al. 2003; Stull et al. 2008). Together, these factors cost California dairies over $118 million a year (St-Pierre et al. 2003). This cost, moreover, may be underestimated since it does not account for the potential effects of heat load on animal health (e.g., lameness). The cost may be higher on some farms, depending on heat load management strategies adopted and specific environmental conditions (Stull et al. 2008; Urdaz et al. 2006). For example, milk production was reduced when fewer cooling strategies were provided to cows in their home pen (Urdaz et al. 2006).
The negative effects of hot weather can be minimized by providing cows with heat abatement. Shade, fans and sprayed water effectively reduce physiological changes associated with heat load in dairy cows, such as respiration rate and body temperature (Correa-Calderon et al. 2004), and they also cause behavioral changes, such as time spent near water troughs (Schütz et al. 2010).

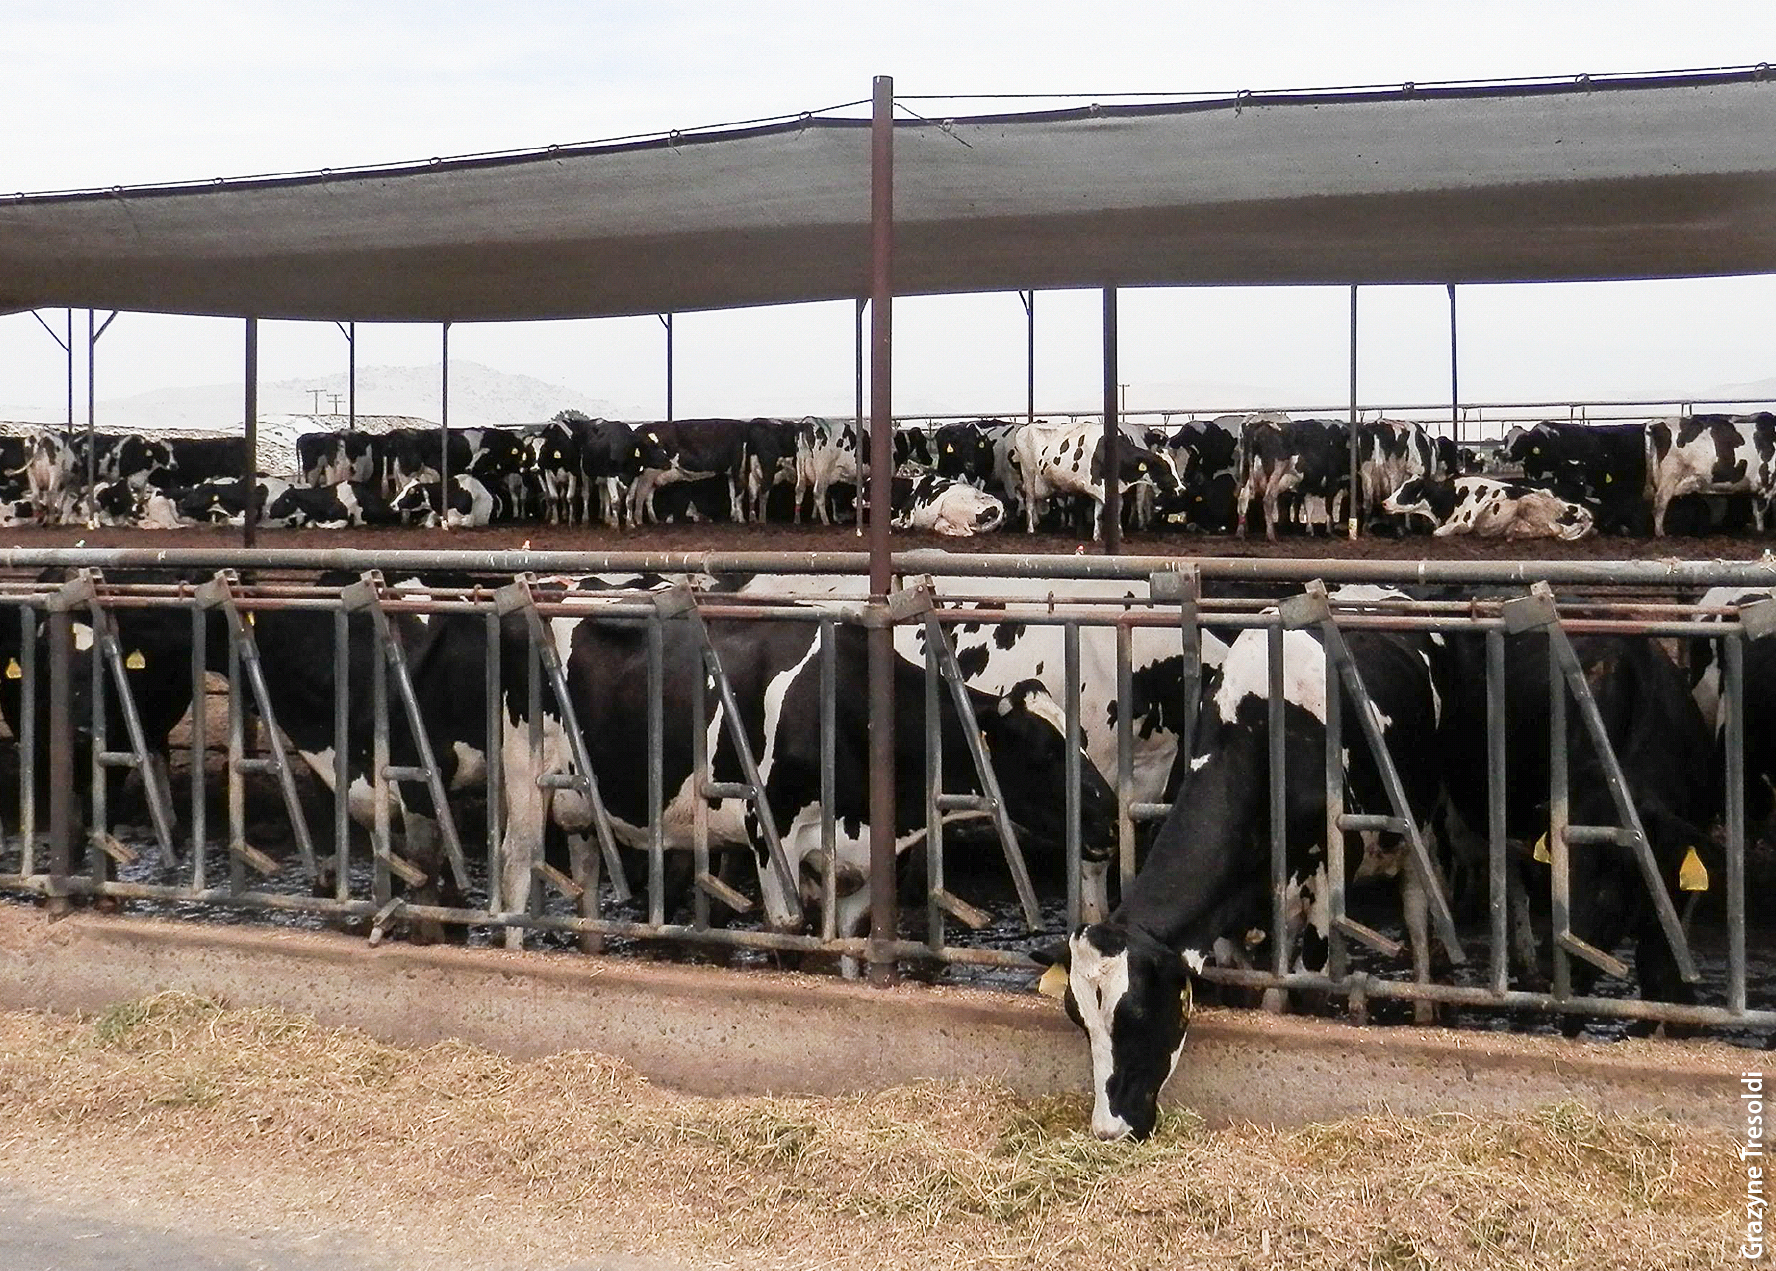
Cows used shade extensively on California drylot dairies. Shade use was more pronounced on dairies that provided this resource at multiple locations, including feed bunks.
Although shade, fans and sprayed water are commonly used on commercial dairies (USDA 2010), little is known about how and in what combination they are provided, nor how well they reduce heat load in commercial dairy situations. In addition, knowing how cows respond to heat load may help us to identify when they are hot, so appropriate action can be taken. Our objectives were to describe the provision of heat abatement strategies and cattle responses during summer on California drylot dairies, and to evaluate the relationship between respiration rate and inactivity in cows.
10 dairy farms
During two summers (2013, 2014), 10 dairy farms were assessed in Fresno, Kings and Tulare counties. Farms averaged (mean ± SD) 1,525 ± 912 cows (range of 570 to 3,594) and produced 74.5 ± 5.5 pounds (33.8 ± 2.5 kilograms) of milk per day. On each farm, a pen with the highest-producing cows was selected for observation, because high-yielding cows have the greatest susceptibility to heat stress (Igono et al. 1988). Pens averaged 170 ± 64 cows (80 to 260), 134 ± 39 days in milk (68 to 189), 2.6 ± 0.5 lactations (2.1 to 3.8) and 84.7 ± 11.0 pounds (68 to 105), or 38.4 ± 4.9 kilograms (30.8 to 47.6), of milk per day.
Facilities, animal responses
Heat abatement resources (shade, fans, sprayed water), space, feed and drinking water provision were recorded in the housing and milking areas.
Behavioral and physiological measures were taken from the entire group of high-producing cows on each farm, and also from randomly chosen focal animals (n = 10 to 15 per dairy) within this group. Observations were conducted by two to five observers, during 3 consecutive days for 5.6 ± 0.5 hours per day (range of 5 to 6 hours), from 10:45 to 19:00 hours, excluding milking time.
Every 30 minutes, we recorded the number of cows in each location within the pen: corral shelter (underneath the roof, or its shadow, in the middle of the pen), feed bunk shelter (underneath the roof placed over the concrete apron in front of feed), water trough (within two cow body-lengths of the water source) and open area (any other area that was unsheltered). A cow was recorded as using a location when she had one hoof within it, except for open-dirt areas, where she had to have all four hooves in it.
Each high-producing group was monitored twice hourly to determine the number of animals feeding (food visible in the mouth, either chewing or gathering with lips or tongue). Every 10 minutes, focal animals were scanned for activity: feeding, ruminating (chewing without visible feed in the mouth or regurgitating), drinking (touching water in the trough with their tongue or muzzle), walking (traveling on foot), idling (not engaged in any apparent behavior) or other behaviors (e.g., grooming, social interaction).

As often as every 10 minutes in the warmest part of each day, observers recorded behavioral and physiological signs of heat load in dairy cows.
Data loggers (Hobo Pendant G, Onset Computer Corp., Bourne, MA) were attached to the hind leg of each focal animal to determine lying and standing behaviors at 1-minute intervals (Ito et al. 2009).
Twice hourly, 10 breaths were timed by complete flank movements, then converted into breaths per minute. At the same time, the panting score of each focal cow was recorded on a scale from 0 to 4.5, as defined by Gaughan et al. (2008). Each score was then converted to one-zero sampling for presence and absence of drooling, open mouth and protruding tongue, because a more recent study has shown that some of those scores may not adequately reflect differences in respiration rate (Tresoldi et al. 2016).
To facilitate comparison among dairies, animal responses were calculated as percentage of the group, or percentage of observation times, and averaged by dairy. All analyses were done in SAS (SAS Institute 2009) using PROC MEANS, except for the comparison between respiration rate and time idle, which was estimated using PROC REG.
Weather measures
A portable weather station (WS-16, Novalynx Corp., Auburn, CA) was placed near the highest-producing pen to record every 5 minutes these factors: air and black globe temperatures (°F), wind speed (mph, measured 8 feet, 2.4 meters, above the ground), relative humidity (%), solar radiation (W per square meter) and precipitation (inches). Temperature-humidity index (Kelly and Bond 1971) and heat load index (Gaughan et al. 2008) were also calculated. In addition, black globe temperature was recorded under the corral shelter at 10-minute intervals (HOBO U23 Pro v2 External Temperature, Onset Computer Corp., Bourne, MA).
During the observation period at seven of the 10 dairies, ground temperature in the most similar adjacent pen (chosen to avoid disturbing the behavior of the observed cows) was recorded at 30-minute intervals at the corral shade, feed bunk and open areas using an infrared thermometer (Autopro ST25, Raytek Corp., Santa Cruz, CA) held 2 feet, 0.6 meter, above the ground.
Heat abatement strategies provided
All dairies provided shade in the corral area; half of them provided shade also at the feed bunk area. The total shade provided ranged from 28 to 74 square feet (2.6 to 6.9 square meters) per cow (table 1). The quantity of shade provided has been shown to affect cows' use of shade and their physiological responses to heat load (Schütz et al. 2010; Schütz et al. 2014; Sullivan et al. 2011), but our sample size was not large enough to compare the effects of shade on cow cooling. In our study, the amount provided was within a narrower range than in the only other comparable work with dairy cows, a study of New Zealand pasture-based farms (Schütz et al. 2014), where a range of 0 to 178 square feet (0 to 15.6 square meters) was examined.
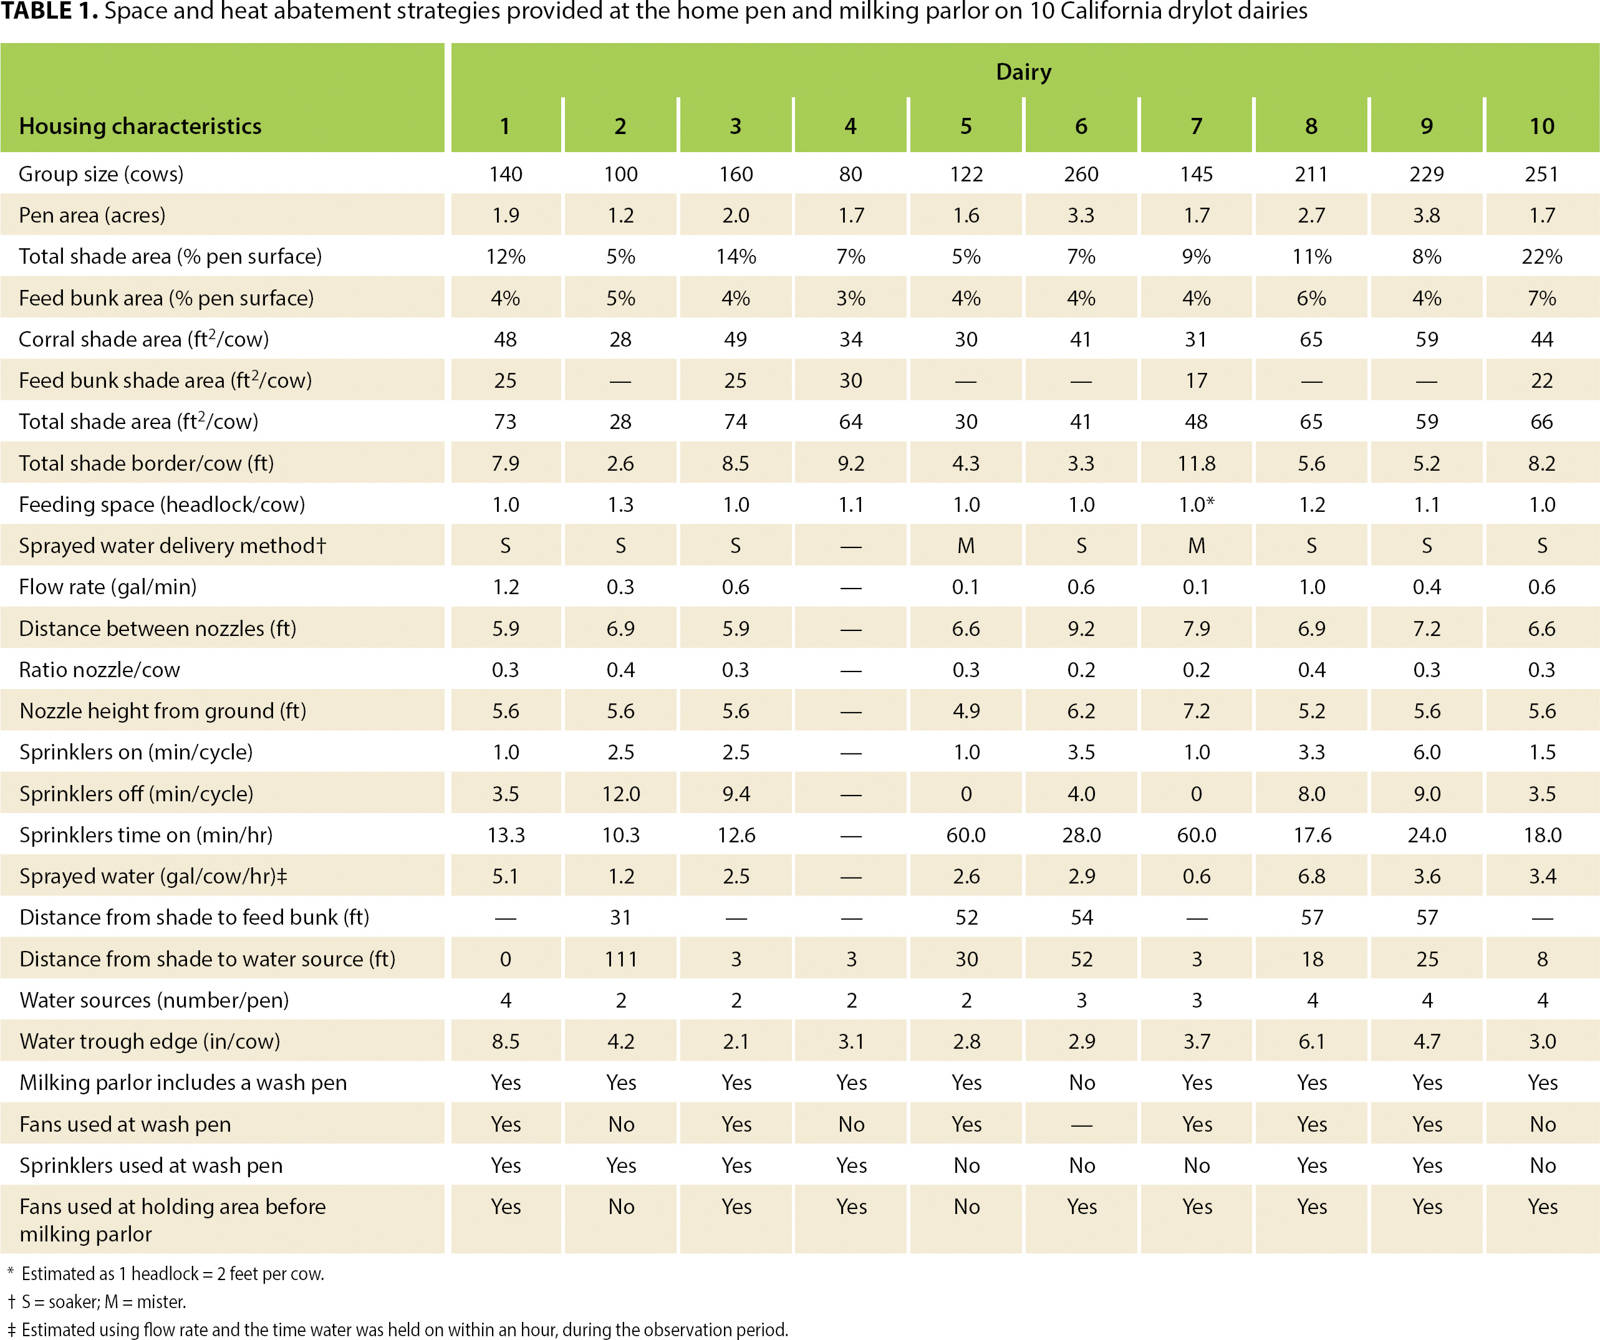
TABLE 1. Space and heat abatement strategies provided at the home pen and milking parlor on 10 California drylot dairies
All dairies except one sprayed water at the feed line. Spray strategies (i.e., flow rate, number of spray cycles, etc.) were diverse and influenced the volume of potable water used by each dairy (table 1). There was an 11-fold range among the dairies in this study in estimated water sprayed per cow. Considering that these farms sprayed water for at least 6 hours a day, an average California dairy (1,000 lactating cows) may use up to 40,418 gallons (153,000 liters) of water a day to cool cattle during summer. Although the upper range of sprayed water may raise concerns about the use of potable water to cool cows, especially during drought conditions, this resource effectively reduces heat load in dairy cows (Chen et al. 2013, 2016).
No dairies offered fans in the housing area. The heat abatement strategies provided at the milking parlor varied among dairies (table 1). To our knowledge, this is the first study to describe the unique combinations of cooling strategies used on dairy farms.
Microclimates
Weather conditions for 24-hour and observation periods are summarized in table 2. There was no rainfall recorded at the dairies during the study period. Air temperature during the observation period averaged 93.5°F (34.2°C).

TABLE 2. Averages of mean or maximum weather conditions during 24 hours and the observation period (5 to 6 hours, 10:45 to 19:00) on 10 California drylot dairies
Use of the home pen
Pen use by farm is shown in figure 1. On average, during the afternoon, 81% ± 17% (mean ± SD) of the high-producing group on each dairy used shade, which was at least twice as much as found in a New Zealand study conducted when air temperature averaged 73°F (23°C) (Schütz et al. 2014). This and the following results support other literature that demonstrated cows are highly motivated to use shade, especially when it is hot and sunny (Schütz et al. 2008; Schütz et al. 2010).
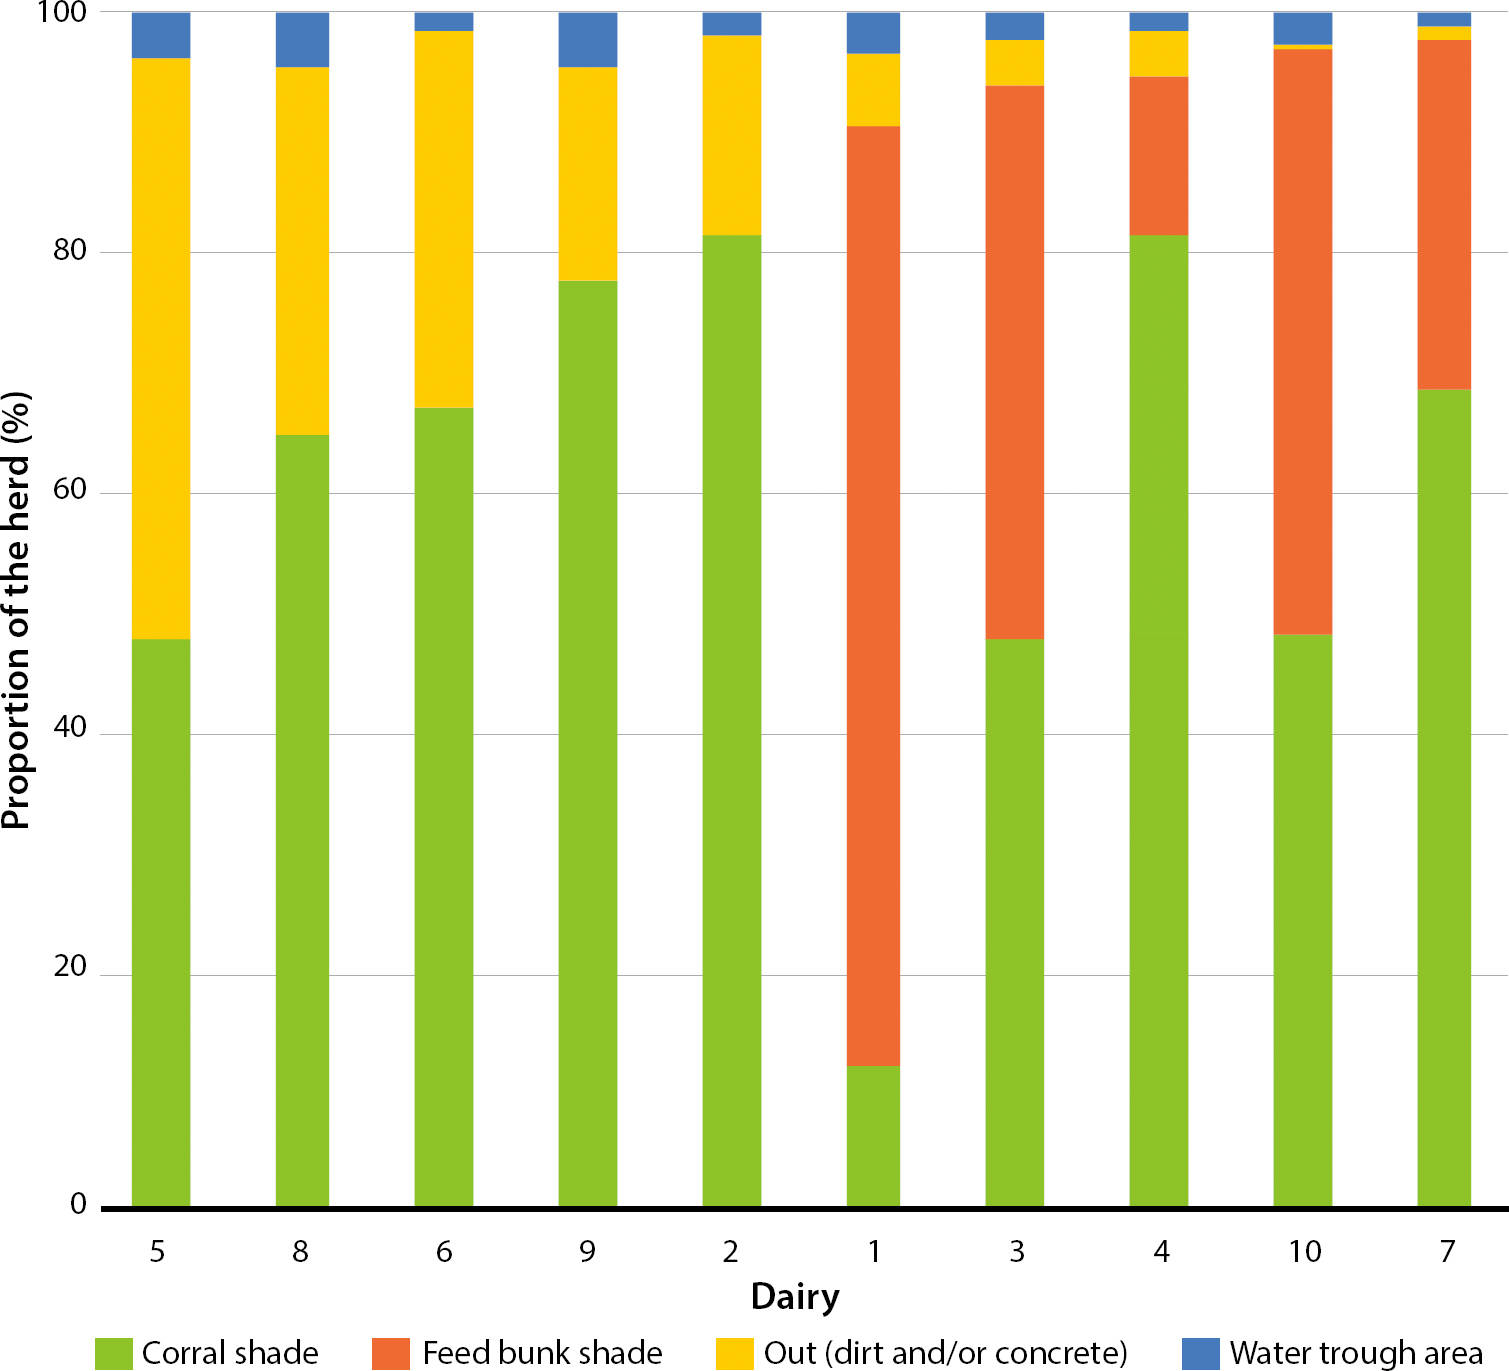
Fig. 1. Proportion of the group using pen locations (average over 3 days of observation). The 10 California drylot dairies are ranked by overall shade use.
On dairies where shade was provided in multiple locations, cows extensively used this resource. Cows on these dairies avoided open areas throughout the day (fig. 2), with only 3% ± 2% of the high-producing group in areas with no cooling. In contrast, on dairies where the feed bunk was unshaded, the use of this and other unsheltered areas of the pen increased over time from 15% to 51% of the high-producing group between 13:00 and 17:00 hours (fig. 2).

Fig. 2. Proportion (average over 3 days of observation) of the group by pen location and time of day, segregated by heat abatement resources provided at the feed bunk on 10 California drylot dairies.
These results suggest that there was more variable use of space on farms where shade was available only at the corral, and that cows rely on other factors besides weather and shade (e.g., feeding, sprayed water) to make decisions about which location to use. Regarding the use of the area surrounding the water source, only 3% ± 1% of the group was observed at this location during the observation period, which was similar to findings in New Zealand herds (Schütz et al. 2014). The use of this area seems to be affected by weather (Schütz et al. 2010), an idea supported by more cow visits to this area being recorded toward the end of the day.
Surface temperature
During the observation period, dirt temperature in open areas averaged 138°F ± 9°F (59°C ± 5°C); in the corral shade it was 91°F ± 7°F (33°C ± 4°C). At the feed bunk, the temperature of the concrete floor averaged 75°F ± 5°F (24°C ± 3°C) on dairies that provided shade plus sprayed water, and 86°F ± 0°F (30°C ± 0°C) on those that only sprayed water at this area. Similar dirt temperatures were described previously by Sullivan et al. (2011) in both shaded and open areas, and Marcillac-Embertson et al. (2009) at unshaded wet surfaces.
As we expected, blocking solar radiation influenced ground temperatures in both dirt and concrete areas. Ground temperatures fluctuated throughout the day more markedly in open, dirt areas than on other surfaces (fig. 3), and hourly variation in ground temperature was similar (18°F [10°C] on dry dirt) to that described by Mader et al. (2007). Other studies have shown that cows seek areas with cooler ground temperatures during the warmest part of the day (Mader et al. 2007).
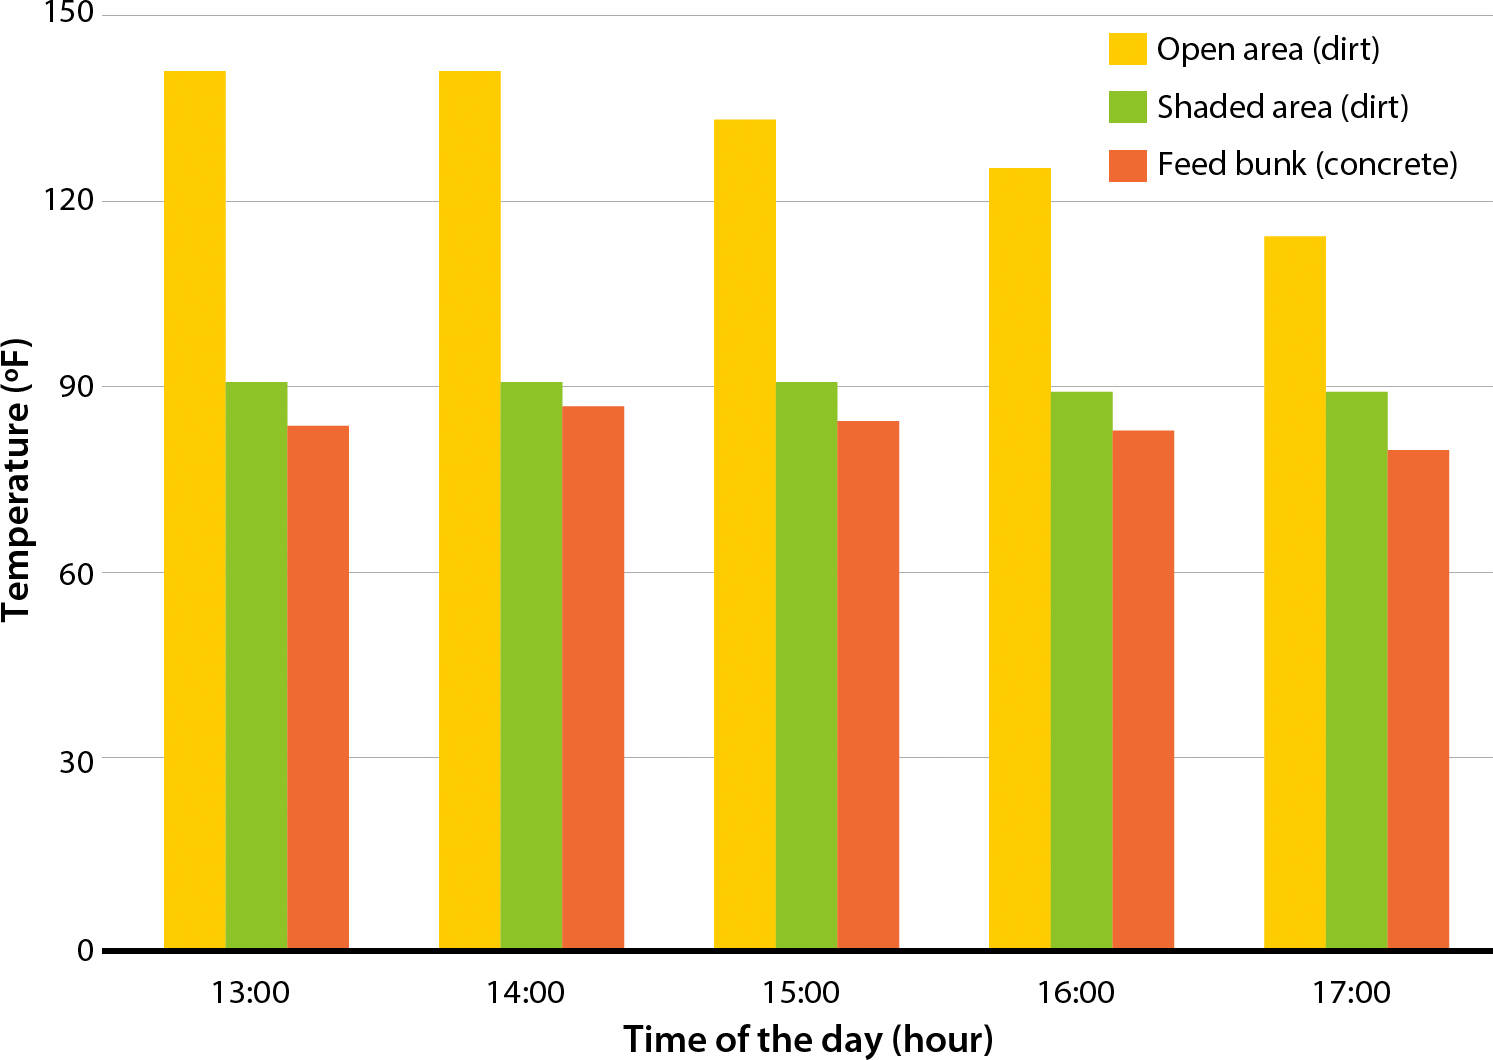
Fig. 3. Ground temperature at pen locations throughout the day (n = 7 drylot dairies, average over 3 days of observation).
Activity
On average, 17% ± 7% of the high-producing group fed (range of 7% to 33%) during the afternoon. A similar average and hourly pattern (data not shown) was observed in a study conducted in a drylot in Texas, where cows had shade at the corral only (Carter et al. 2011). Provision of heat abatement resources, weather (Chen et al. 2013), feeding and milking schedule (DeVries et al. 2003) can all affect feeding behavior and bunk attendance. On dairies that provided shade plus sprayed water at the feed bunk, only 34% of the cows in this area were feeding. This result suggests that cows were using the feed bunk area for cooling, as found previously by Chen et al. (2013).
Focal cows spent most of the observation period (47% ± 9%, on average) not engaged in any specific activity (i.e., idling). The remaining time they spent ruminating (25% ± 6%), feeding (20% ± 8%), drinking, walking, interacting with pen mates or grooming (8% ± 2%). In comparison to cows in a study conducted during winter in Canada, California cows spent slightly less time engaged in feeding and rumination during the afternoon, 25% and 33% of the time, respectively (Schirmann et al. 2012), which can be partially explained by warmer weather in our study.
Cows spent most of the afternoon being inactive (i.e., not engaged in any activity) in California drylot dairies. On average, less than 20% of the herd was observed feeding during this period.
Cows spend less time feeding when they are hot (Chen et al. 2013). In our study, hot weather may also explain why cows spent a great part of their time inactive, as this response was also positively related with higher respiration rate (R2 = 0.75, P < 0.01; fig. 4). When facing high heat load, cows may avoid engaging in activities that increase heat production, or they may simply be unable to engage in other activities due to high respiration rate.
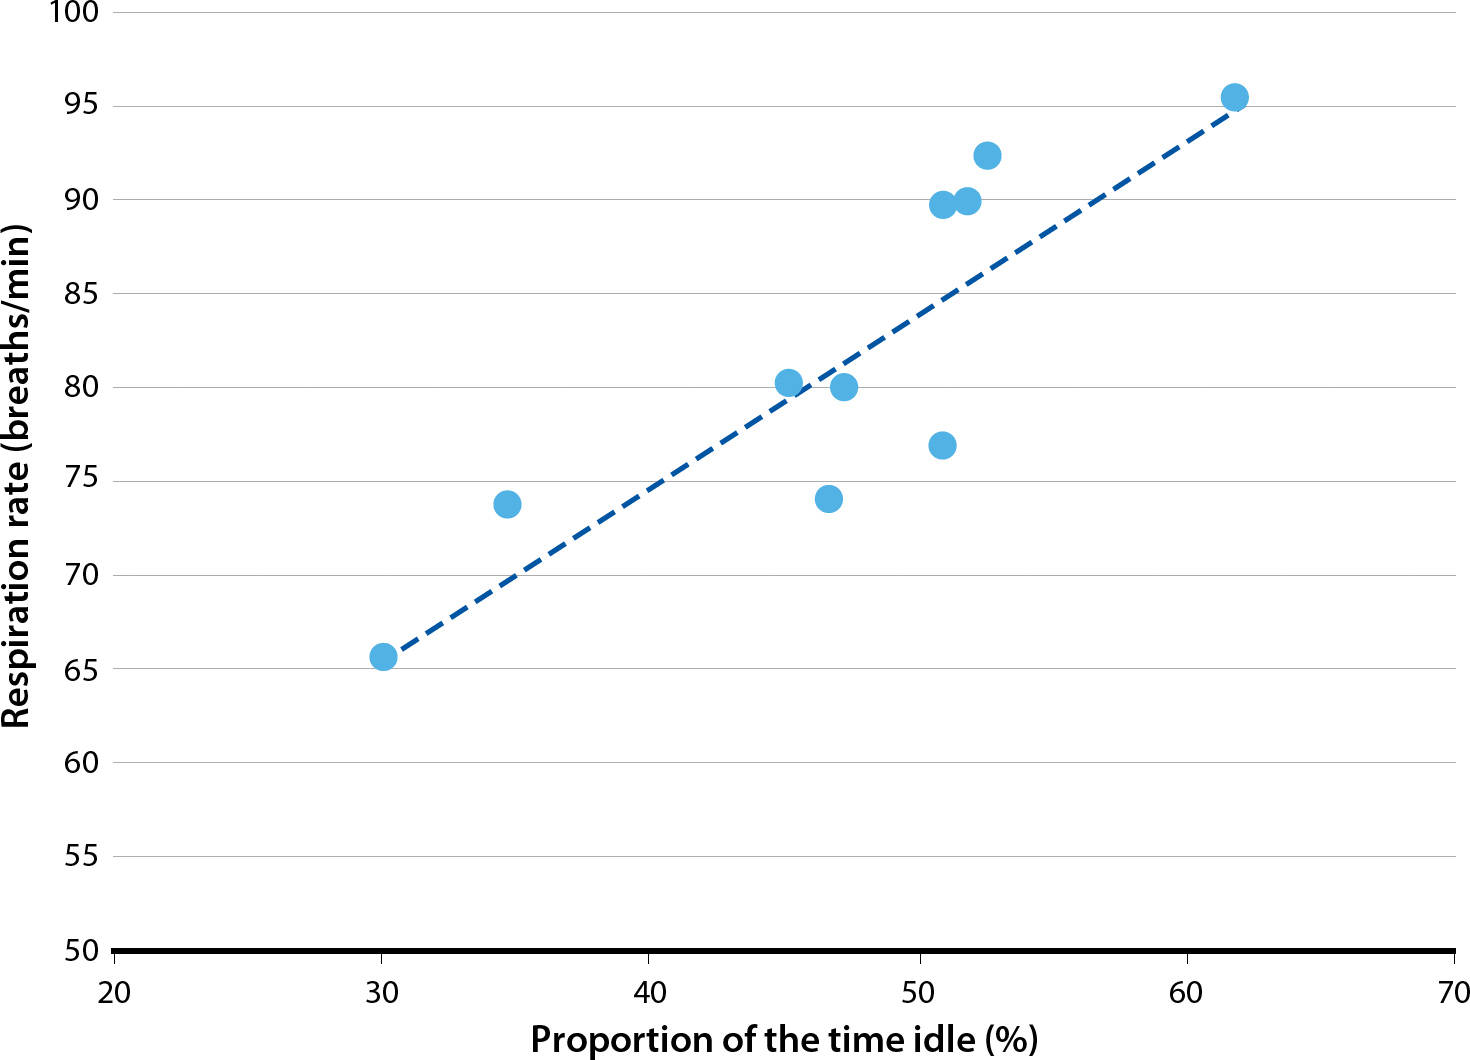
Fig. 4. Relationship between respiration rates and proportion of the time focal cows were idling (i.e., not engaged in any activity) on 10 California drylot dairies (average over 3 days of observation). R2 = 0.75; P < 0.01.
Posture
Cows spent 9 ± 1 hours a day lying down, on average (range of 7.4 to 10.6 hours). Daily averages ranged from 3.9 to 13.2 hours per day for individual cows. In our study, cows spent 1 hour less lying than those housed in similar conditions in Texas and New Mexico assessed during cooler conditions (10.2 hours per day; Barrientos et al. 2012). Weather may explain, in part, lower lying times on California dairies because cows spend less time lying in warm weather (Schütz et al. 2010). Individual variation among cows was within the range described by others (Barrientos et al. 2012).
Respiration rate and panting
Farm average respiration rates ranged from 65 to 95 breaths per minute (fig. 5); respiration rates of individual cows ranged from 25 to 147 breaths per minute. These values are within the range described in other studies in drylots during summer (Avendano-Reyes et al. 2012; Correa-Calderon et al. 2004; Tresoldi et al. 2016); however, most of them are much higher than the < 60 breaths per minute obtained in a study designed to maximize cooling in cows (G. Tresoldi, unpublished data).
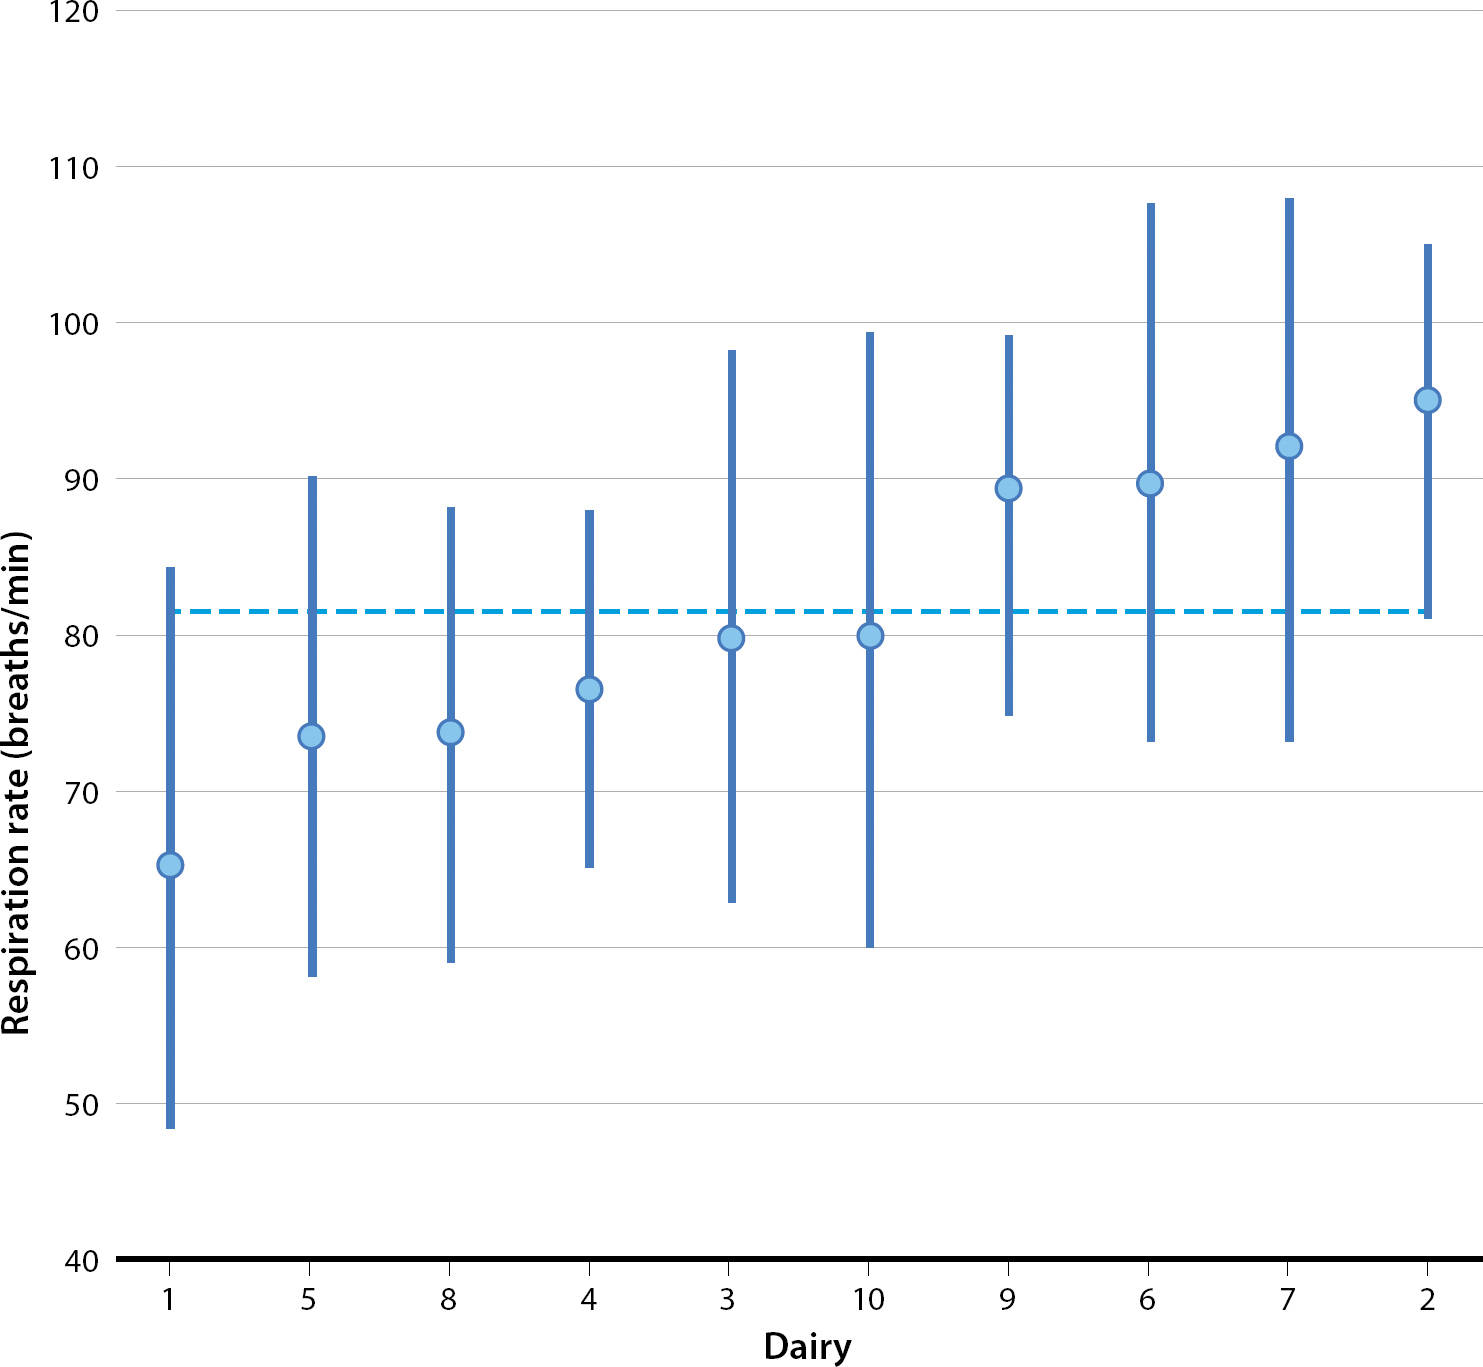
Fig. 5. Mean respiration rates (± SD) ranked for 10 California drylot dairies (average over 3 days of observation). The dotted line represents the overall mean.
Higher respiration rates have been associated with panting in dairy cows (Gaughan and Mader 2014; Tresoldi et al. 2016). Differences across farms may be due to the heat abatement resources provided (Correa-Calderon et al. 2004; Avendano-Reyes et al. 2012), while individual variation in respiration rate may be partially explained by use of (or lack of) cooling resources at the dairies (Parola et al. 2012).
Focal cows exhibited drooling (36% ± 13% of observations) more frequently than open mouth (4% ± 3% of observations) and protruding tongue (1% ± 1% of observations). Drooling frequency was similar to values reported previously in cows in California drylots (Tresoldi et al. 2016) and in Australian feedlots (Gaughan and Mader 2014) during summer. However, open-mouth and protruding tongue panting frequencies were lower than reported in those studies. Our results, however, may be underestimated since, in retrospect, we now know we needed to sample every 5 minutes (Tresoldi et al. 2016).
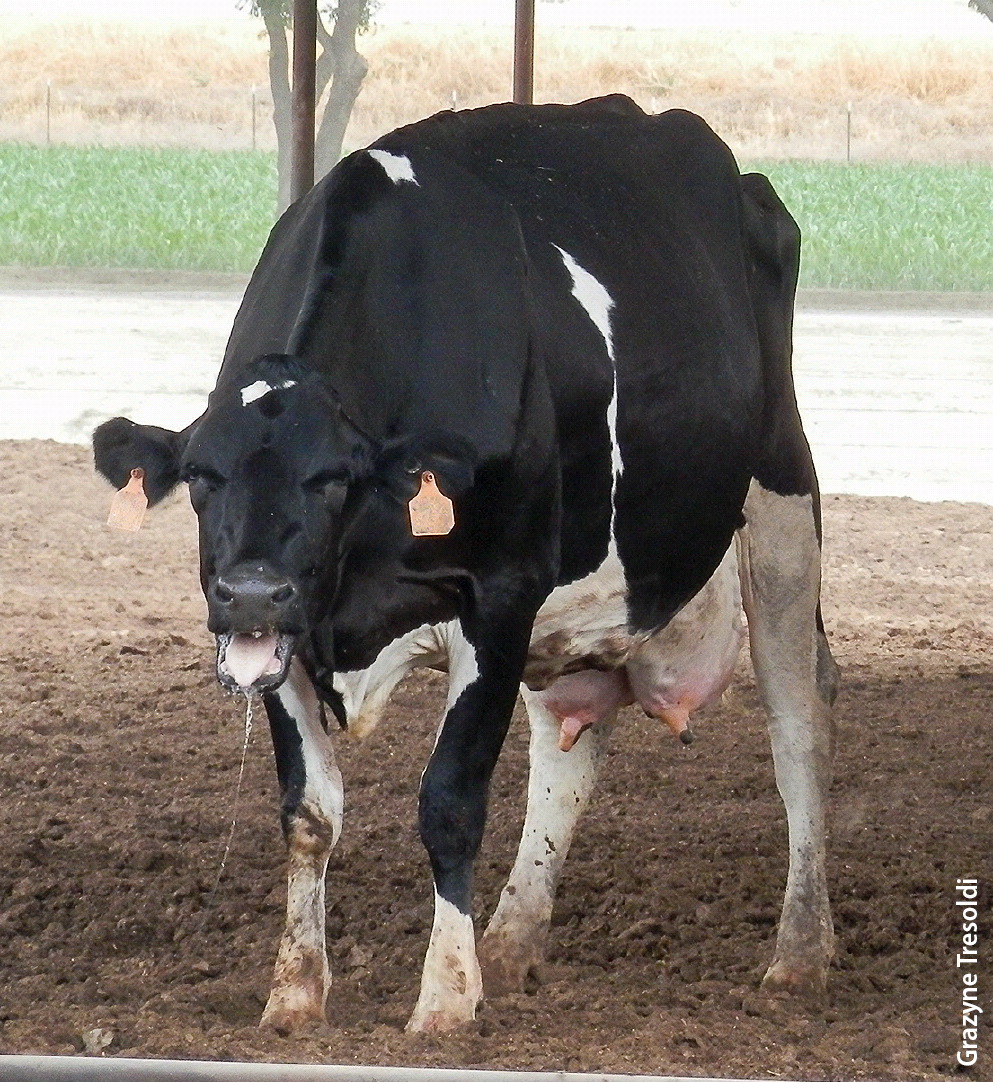
Open-mouth panting was usually rare (< 5% of the observations, on average) but indicates that cows were hot. Panting is associated with higher respiration rates.
Opportunities to improve cooling and resource use
This is the first study to describe heat abatement strategies and cattle responses to heat load in commercial drylots in California. Given that some dairies achieved better animal responses (e.g., lower respiration rates) than others, our results indicate that there are opportunities to improve cooling and, consequently, aspects of cow welfare in California drylots. However, in this study, we could not determine what strategies were associated with better cooling because our sample size was small. Taken together with existing literature, we infer that cooling can be enhanced by adding shade at the feed bunk in complement to spray systems, for example. In addition, the lack of standardization regarding the provision of sprayed water suggests that there is further opportunity to optimize the use of this resource in California dairies. Others have found that increasing the quantity of water sprayed did not necessarily enhance cow cooling in a linear fashion. Our team is now exploring how to better understand how to both optimize cow cooling and the efficiency of water use.
Cow cooling on commercial drylot dairies: A description of 10 farms in California

