


All Issues
Inconsistent food safety pressures complicate environmental conservation for California produce growers
Publication Information
California Agriculture 70(3):142-151. https://doi.org/10.3733/ca.2016a0006
Published online August 01, 2016
NALT Keywords
Abstract
Controlling human pathogens on fresh vegetables, fruits and nuts is imperative for California growers. A range of rules and guidelines have been developed since 2006, when a widespread outbreak of E. coli O157:H7 was linked to bagged spinach grown in California. Growers face pressure from industry and government sources to adopt specific control measures on their farms, resulting in a complex, shifting set of demands, some of which conflict with environmental stewardship. We surveyed 588 California produce growers about on-farm practices related to food safety and conservation. Nearly all respondents considered both food safety and environmental protection to be important responsibilities for their farms. Responses indicate that clearing vegetation to create buffers around cropped fields, removing vegetation from ditches and ponds, and using poison bait and wildlife fences are commonly used practices intended to reduce wildlife movements onto farm fields. The survey also revealed that on-farm practices vary substantially even among farms with similar characteristics. This variability suggests inconsistencies in food safety requirements, auditors’ interpretations or growers’ perception of the demands of their buyers. Although site-specific considerations are important and practices should be tailored to local conditions, our findings suggest growers, natural resources and food safety would benefit from clearer, more consistent requirements.
Full text
California leads the nation in production of vegetables, fruits and nuts (CDFA 2014) and its fresh produce industry is composed of an exceptional diversity of crops and farm types. Beginning in the late 1990s and accelerating after prominent incidents such as the 2006 outbreak of E. coli O157:H7 linked to bagged spinach, new rules and best practice guidelines to mitigate food-borne pathogen contamination propagated rapidly through the fresh produce industry (Stuart 2010). The multiple layers of rules and guidance developed over the past decade present growers with a complex landscape of pressures to adopt and intensify on-farm practices intended to improve food safety, some of which may conflict with efforts to conserve natural resources.
Alongside continually developing expectations for food safety, growers are also expected to conserve water and soil and are legally obligated to protect water quality as well as wildlife and its habitat. Many of the state's major agricultural regions, such as the San Joaquin, Sacramento, Santa Clara and Salinas River valleys are located in or near ecologically sensitive river corridors and floodplains. These ecosystems host fertile soils, are sources of fresh water, and also provide habitat for many species of birds, amphibians and other wildlife. On-farm practices, including those related to food safety, can have direct and indirect consequences to the benefits provided from these ecosystems (Karp et al. 2015; Karp et al. 2016; Karp, Baur et al. 2015; Letourneau et al. 2015).
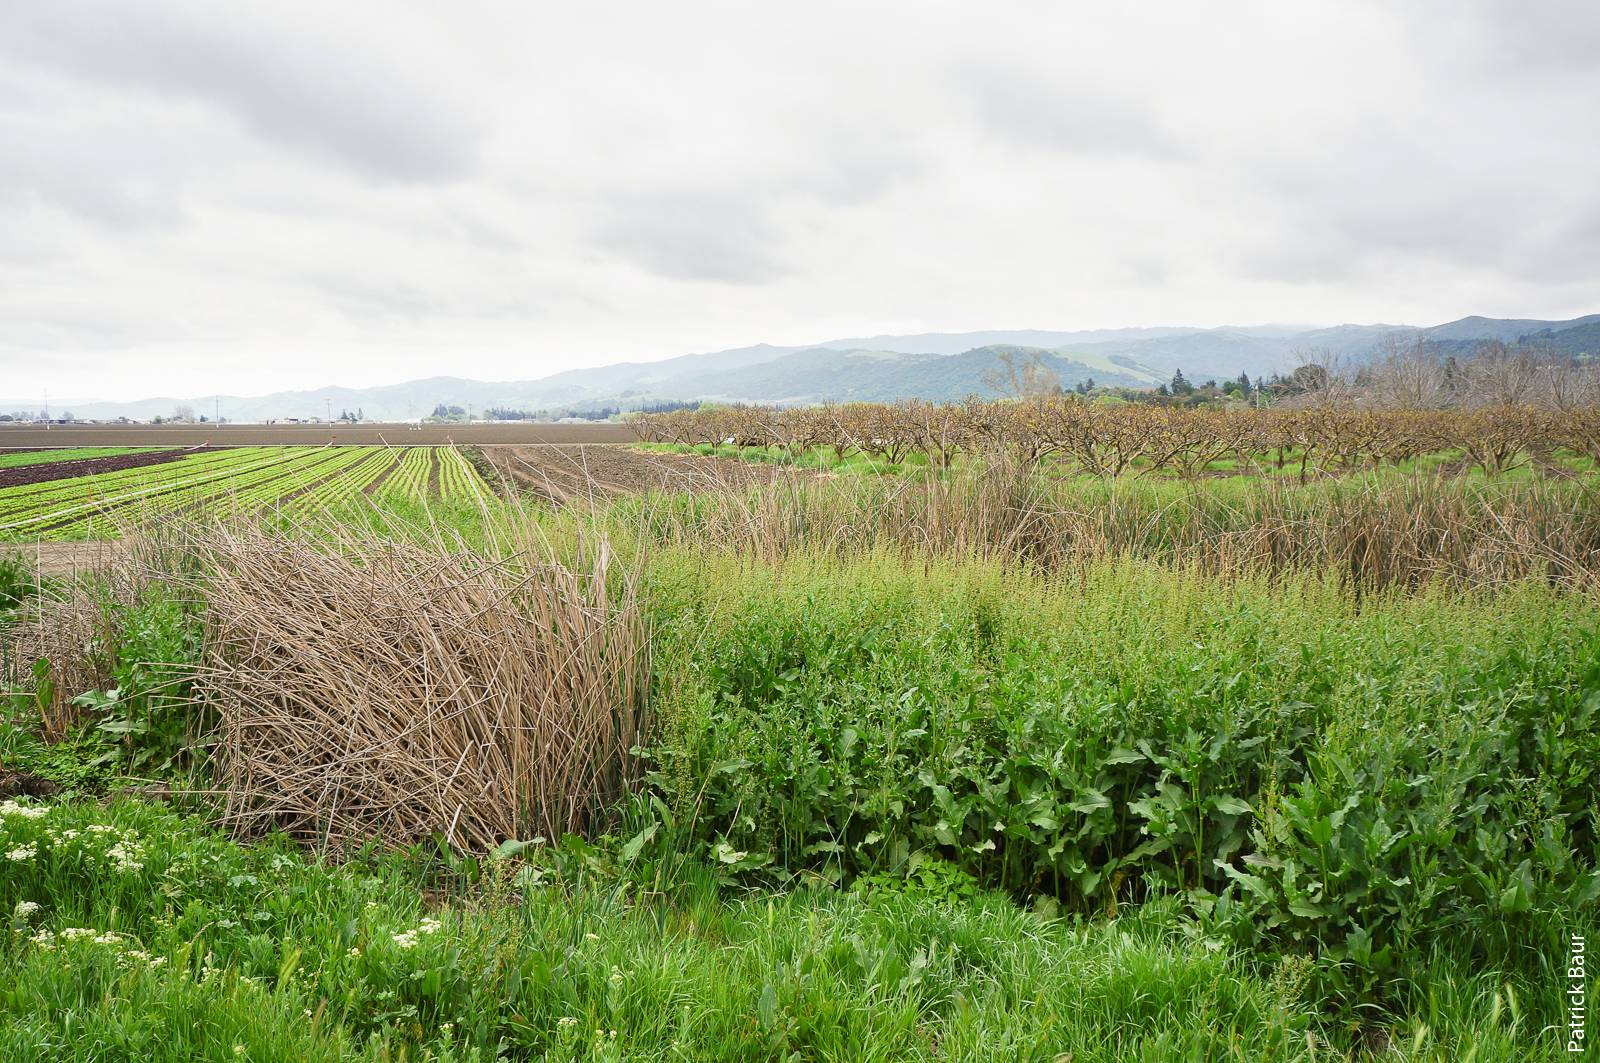
A survey of California produce growers suggests that food safety measures and use of conservation practices such as this tailwater recovery system (foreground) in the Salinas Valley vary widely across the state.
Food safety measures and impacts
Early evidence suggested that pressures to improve food safety after 2006 led growers to adopt on-farm practices with substantial economic and environmental costs (Lowell 2010). Surveys and interviews of Central Coast growers conducted in 2007 (Beretti and Stuart 2008) and 2009 (Beretti 2009; Lowell et al. 2010) revealed that “as a condition to sell their produce, growers report yielding to tremendous pressure exerted by auditors, inspectors, and other food safety professionals to take measures that are potentially damaging to the environment” (Lowell et al. 2010). Such measures included clearing vegetation (including removing existing vegetated conservation practices), removing ponds or water bodies, setting poison bait traps for wild animals and installing extensive wildlife exclusion fences. In a separate study of land use change using aerial imagery, Gennet et al. (2013) confirmed that approximately 13% of the remaining riparian habitat in the Salinas Valley was removed between 2005 and 2009.
There is no clear evidence that on-farm practices to reduce animal intrusions are effective at enhancing food safety (Langholz and Jay-Russell 2013). Further, emerging evidence suggests that removal of non-crop vegetation fails to reduce, and may even increase, pathogen prevalence on leafy-green vegetable farms in the California Central Coast (Karp et al. 2015), while degrading important ecosystem benefits such as natural pest control services (Letourneau et al. 2015, Karp et al. 2016). Removing vegetation is expensive and at times conflicts with landowners’ acknowledged environmental stewardship responsibilities (Crohn and Bianchi 2008; Gennet et al. 2013; Hardesty and Kusunose 2009; Stuart 2009). Furthermore, such approaches may conflict with California's regulatory targets for surface water quality. They may also conflict with standards for USDA's Natural Resources Conservation Service conservation practices, limiting growers’ access to Farm Bill or other federal sources of funding. In addition, activities specifically adopted to remove or deter wildlife from entering fields — such as poison bait, trapping and extensive wildlife exclusion fences — may expose growers to criticism from wildlife conservation interests and public expectations of farmers to protect native plants, animals and environmental quality.

Traps and wildlife exclusion fences are commonly used measures intended to reduce animal intrusions onto fields.
Many layers of pressure
The pressures on growers to improve food safety originate from government regulators such as the Food and Drug Administration (FDA), from private third-party auditors and certifiers, and from retail and foodservice companies that purchase produce. The cumulative effect of these multiple layers of pressure on growers and the food safety measures they feel obligated to implement has not been assessed industry-wide.
Food safety regulation at the farm level is a recent development. Before FDA finalized its Produce Safety Rule (80 Fed. Reg. 74353) in 2015 pursuant to the Food Safety Modernization Act of 2011, there was no direct federal oversight. The rule was written in general terms to provide growers with the flexibility to adopt the food safety measures that they deem most appropriate for their farm. For example, with respect to how growers should manage animal intrusion, the rule only requires that growers visually monitor the growing area prior to harvest and take “measures reasonably necessary” in case an animal does find its way into the field. It leaves precise interpretation of what those measures should entail open to the discretion of growers, inspectors, auditors and produce buyers. The rule sets more specific standards for detectable amounts of bacteria in biological soil amendments and agricultural water. But while it does detail approved composting and pathogen testing methodologies, the rule gives growers latitude to choose their own irrigation and soil amendment practices and technologies. FDA, USDA and various partner organizations are actively developing additional guidance and training resources to assist growers in interpreting and implementing the rule, but it will take years to reach everyone. In the meantime, it is unclear precisely how growers will respond.
That said, while much attention has been given to the minimum legal requirements set by government regulators, it is critical to understand that government oversight will not account for all, or even necessarily the primary, pressure on growers to improve food safety on their farms. Because food safety rules as written are frequently open-ended and regulators have very limited resources to monitor or enforce compliance, many produce buyers seek additional assurance by requiring their growers to receive certification to one or more private standards. Maintained by third-party certifiers, these private standards add an additional burden of compliance to government regulation (Bain et al. 2013; Henson and Humphrey 2009).
Regulations and private standards are generally publicly available, but there are two further layers of more opaque pressure. First, government inspectors and third-party auditors decide whether or not the on-farm practices used by a given grower comply with regulations or private standards, respectively. Inspectors and auditors thus shape the ways in which growers put rules and standards into practice, yet it is very difficult to gauge their consistency and level of influence. Second, produce buyers may impose additional, case-specific production specifications on their suppliers through purchasing contracts or even verbal communication.
From pressure to practice
Little scholarship has examined how these varied and dynamic pressures have played out on California farms since 2009 or assessed whether and to what extent pressures and practices vary by crop type and farm size. Several developments in the past 7 years lend urgency to the need for updated and expanded data in these areas. First, in response to the reported tension between managing for food safety and managing for environmental quality (Crohn and Bianchi 2008; Stuart 2009), UC Cooperative Extension in collaboration with USDA's Natural Resource Conservation Service and others has developed guidance for and sought to raise awareness of co-management, an adaptive strategy that seeks to reduce food safety risks without impairing environmental goals (ANR 2015; FFSCN 2015). Second, the aforementioned Produce Safety Rule now requires growers to meet national standards for agricultural water, soil amendments (specifically compost) and preventive programs to mitigate contamination risk from wildlife and livestock. Third, the ongoing drought in California and heightened water quality control regulations for agriculture — such as the Central Coast Water Quality Control Board's Conditional Waiver of Waste Discharge Requirements (Agricultural Order No. R3-2012-0011) under California's 1969 Porter-Cologne Act, the first order that does not allow waivers for agricultural contamination to waterways — may give new impetus for growers to preserve riparian and wetland vegetation that helps reduce nutrient contamination and implement other water conservation practices. Lastly, public health officials and media continue to draw attention to the persistent risk of foodborne illness associated with fresh produce (Bakalar 2015; FDA 2014; Painter et al. 2013).
As these ongoing developments intensify scrutiny of field-level production, there is a pressing need to assess the current state of on-farm practices and grower perspectives for food safety and conservation. To help address the need for such data, we collaborated with the California Farm Bureau Federation (CFBF) in 2014 to survey growers across the state.
Survey design and implementation
The survey ( ucanr.edu/u.cfm?id=141 ) was designed to produce baseline information about ongoing food-safety practices for industry, policymakers, regulators, the Cooperative Extension community, conservation interests and academic researchers. In developing the survey instrument, we examined the questions asked in the 2007 and 2009 surveys and gathered suggestions on further questions to include from stakeholders at the CFBF and the Farm Food Safety and Conservation Network. We aimed to assess (1) the current prevalence of various on-farm practices for food safety and conservation in California; (2) the effect of farm size and organic status on whether growers use a certain practice; (3) where and how growers access information about food safety and conservation; and (4) growers’ broader perspectives on food safety and environmental management.
The first draft of the survey instrument was shared with a focus group of five CFBF members for comment. Based on feedback from the focus group, the instrument was revised and piloted with 28 members of the CFBF's Specialty Crop Commodity Advisory Committee. After a final round of revisions, CFBF staff delivered the survey instrument electronically to the CFBF email listserv. Responses were collected during the month of October 2014, and one reminder email was sent two weeks after the initial recruitment email.
Survey limitations
To preserve privacy and with the understanding that on-farm practices can be a sensitive subject for growers, responses to this survey were collected anonymously. In addition, the identity and job title or operational role of specific respondents were not controlled or recorded. As with all surveys, responses reflect the personal interpretations and attitudes of respondents. There is thus a possibility of false or incorrect answers. Respondents were allowed to skip individual questions, opening the possibility for underreporting on sensitive topics. For example, some growers may have chosen not to disclose whether they currently use poison bait or copper sulfate, or whether they clear vegetation in or near riparian areas, as these management practices may exist in a legal gray area depending on the area of production. That said, we did not observe the response rates for these practices to be markedly lower than for the less sensitive practices queried.
Survey respondents
The survey yielded responses from 588 produce growers who reported more than $25,000 annual sales for their operation. Of these respondents, 536 reported growing fruits and nuts and 118 reported growing vegetables and melons (66 respondents reported growing at least one crop in each category). About one-fifth (21%) of respondents reported growing at least some certified organic produce, with 7% reporting growing exclusively certified organic produce.
To estimate our survey response rate, we compared our respondents to the subpopulation of CFBF members growing fruits and nuts or vegetables and melons, who have operations with annual sales above $25,000. When the survey was sent in 2014, CFBF had 29,519 agricultural members, 10,905 of whom were on the organization's email listerv. Fruit and nut growers represented 41% of CFBF members on the listserv, while vegetable and melon growers represented 15%. We therefore estimate the survey instrument was emailed to 4,471 fruit and nut growers and 1,636 vegetable and melon growers.
CFBF does not track its members’ annual sales. Additionally, the survey did not indicate the percentage of sales by commodity for each respondent. However, we estimate response rates by assuming that the distribution of operations by annual sales is similar between CFBF members and the full population of California growers as reported in the 2012 census of agriculture (USDA 2014). This would mean the survey was distributed to approximately 2,618 fruit and nut growers and 684 vegetable and melon growers with annual sales above $25,000, yielding estimated response rates of 20% for fruit and nut growers and 17% for vegetable and melon growers.
The CFBF membership is not necessarily representative of all California growers, and as such our respondents should be conservatively interpreted as a convenience sample. To assess the potential selection bias resulting from this non-probabilistic sample, we compared the proportion of respondents by crop type and annual sales to the statewide proportions reported in the 2012 census of agriculture (USDA 2014). Statewide, the ratio of fruit and nut operations to vegetable and melon operations with more than $25,000 in annual sales is approximately 9:1. The statewide ratio of produce operations (fruit, nut, vegetable and melon) with annual sales between $25,000 and $500,000 to those with annual sales greater than $500,000 is about 3:1. Among our respondents, the ratios are about 4:1 and 1:1, respectively, meaning that our sample over-represents both vegetable and melon growers and farm operations with more than $500,000 in annual sales.
Farm categories
In our analysis, we compare respondents by the annual sales reported for their farms. Based on FDA's definitions of farm size used in the Produce Safety Rule (21 CFR §112.3), we define “large” farms as respondents who reported annual sales of $500,000 or more per year and “small” farms as those who reported annual sales between $25,000 and $500,000 per year; we excluded respondents reporting sales under $25,000 per year. Different market channels represent different clusters of consumer demand, and thus may be associated with different types and intensities of food safety pressure.
In our sample, respondents reporting annual sales of at least $500,000 per year also reported selling primarily to broker, wholesaler, packer/shipper and processor market channels, while respondents reporting annuals sales under $500,000 per year were more likely to report selling primarily to farmers market and community supported agriculture (CSA) channels.
In addition to annual sales, different crops are associated with different agronomic practices and present different food safety risk profiles. In recognition of these differences, we analyze respondents who reported growing vegetable and melon crops separately from those who reported growing fruit and nut crops (including strawberries).
On-farm practices
The survey asked respondents to indicate when, if ever, they had used any of a list of 11 on-farm practices specifically because of a food safety concern. Respondents were also asked to indicate use of a list of 22 conservation practices on land they farm. We implemented generalized linear mixed models (GLMMs) to assess whether and to what extent farm size and organic status affect the likelihood that a grower uses on-farm practices for food safety (fig. 1) or conservation (fig. 2).

Fig. 1. On-farm practices for food safety among California produce growers. Points are mean model-predicted probabilities that a respondent reported using the on-farm practice for food safety. The left panel reports probabilities for fruit and nut growers (n = 282 to 306), while the right reports probabilities for vegetable and melon growers (n = 74 to 79). For each type of grower, the second column compares organic versus conventional producers and the second column compares large farms versus small farms. Lines are confidence intervals, asterisks (*) denote significance under likelihood ratio tests after multiple test correction, and plus signs (+) denote significance without multiple test correction. Too few vegetable and melon growers reported using copper sulfate to model the effect of organic status or farm size. Model parameters, practice-specific n-values, and P-values are presented in table S1 ( ucanr.edu/u.cfm?id=142 ).
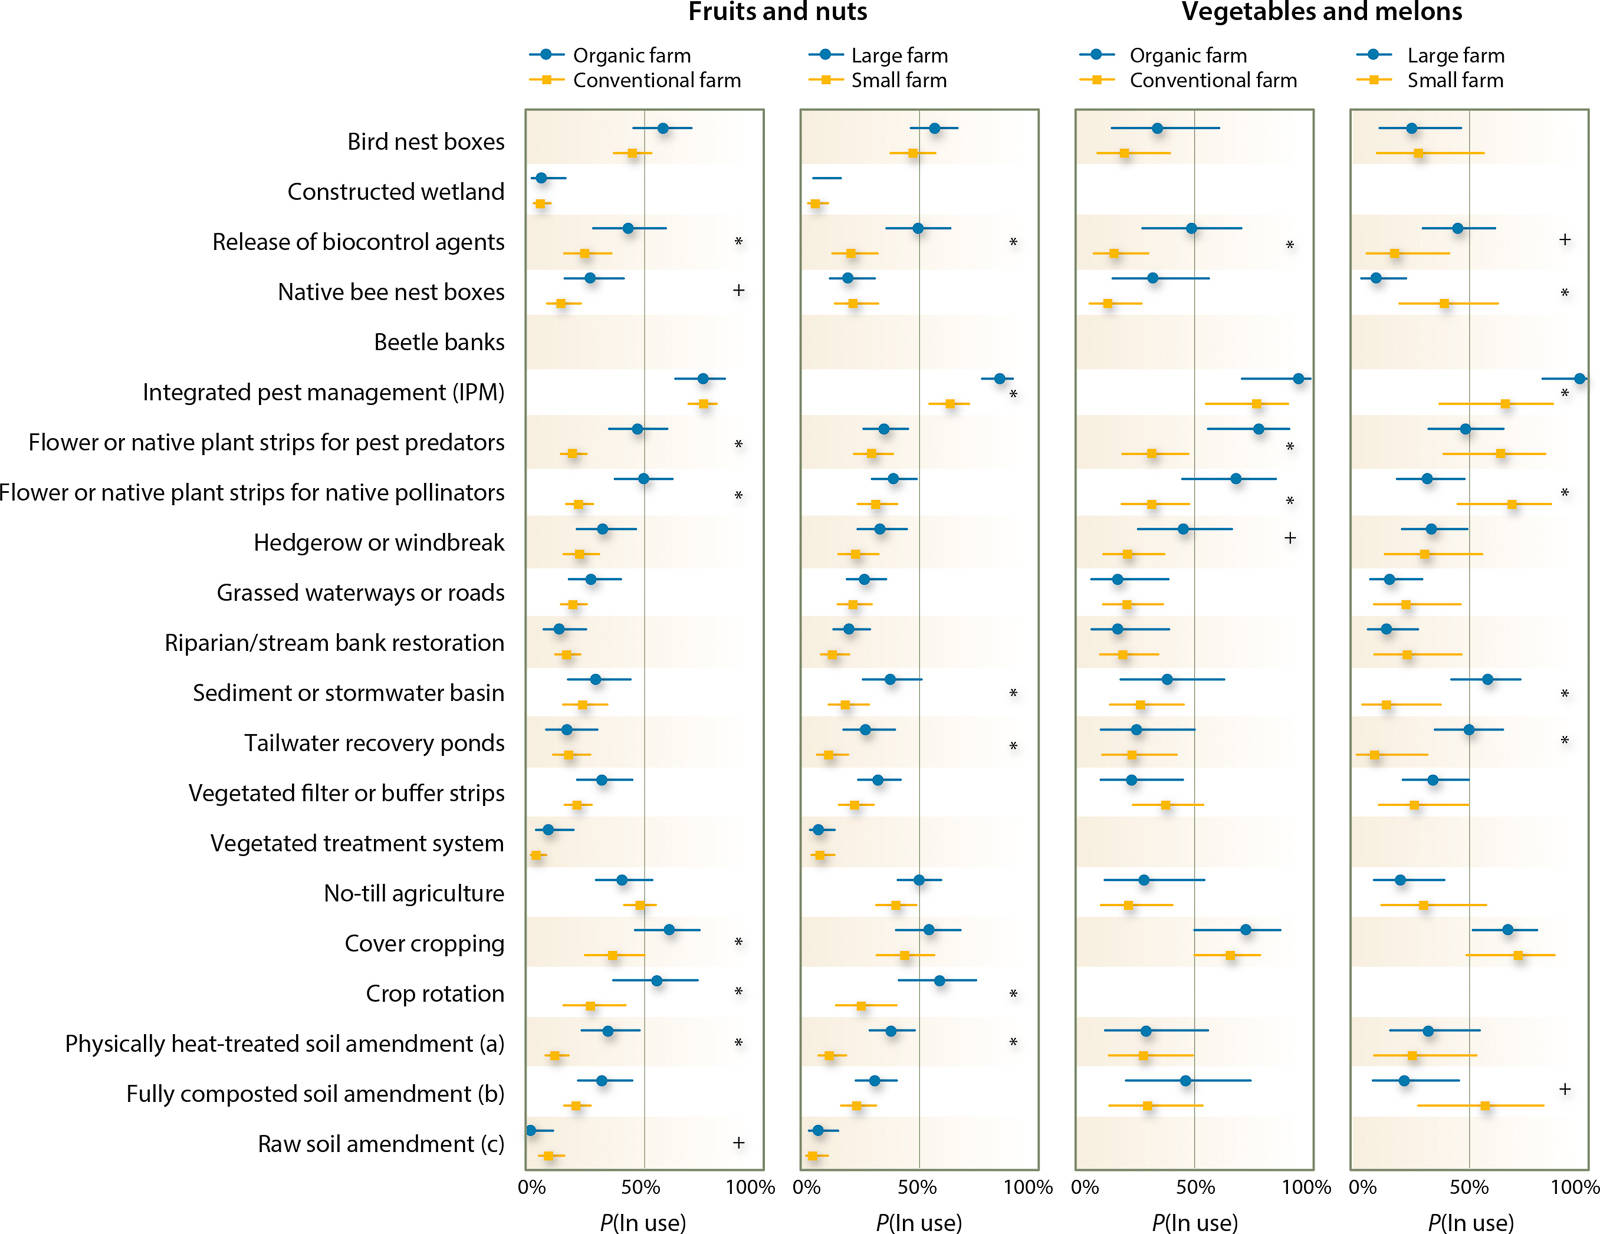
Fig. 2. On-farm conservation practices among California produce growers. Points are mean model-predicted probabilities that a respondent reported using the conservation practice. The left panel reports probabilities for fruit and nut growers (n = 280 to 305), while the right reports probabilities for vegetable and melon growers (n = 72 to 80). For each type of grower, the first column compares organic versus conventional producers and the second column compares large farms versus small farms. Lines are confidence intervals, asterisks (*) denote significance under likelihood ratio tests after multiple test correction, and plus signs (+) denote significance without multiple test correction. For rows in which model parameters are not reported, either too few growers reported using the practice (e.g., beetle banks), or too few reported not using the practice (e.g., crop rotation), to model the effect of organic status or farm size; see table 2. Model parameters, practice-specific n-values and P-values are presented in table S2 ( ucanr.edu/u.cfm?id=143 ).
Fruit and nut growers were analyzed separately from vegetable and melon growers. Predictor variables (fixed effects) included whether growers operated a large versus small farm, and whether they grew organically versus conventionally. The primary market channel for each grower was accounted for as a random effect. We first built separate models with binomial errors and logit links for each on-farm practice. We then used likelihood ratio tests to assess the significance of predictor variables, comparing nested models with and without each predictor variable (Zuur et al. 2009). Because each on-farm practice was modeled individually, we used false discovery rates to account for multiple tests.
Practices for food safety
Most respondents (88%, n = 314) reported using at least one of the 11 on-farm practices for food safety queried in the survey, with about half (48%) reporting using at least four such practices (data not shown). Among fruit and nut growers (n = 282 to 306, see tables 1 and S1 [ ucanr.edu/u.cfm?id=142 ] for detailed results), 53% reported using nonpoison traps and 52% reported using poison bait because of a food safety concern. Rates were similar across organic/conventional status and farm size, although our models show that large farms growing fruits and nuts were more likely than small farms to use poison bait (60% vs. 45%).
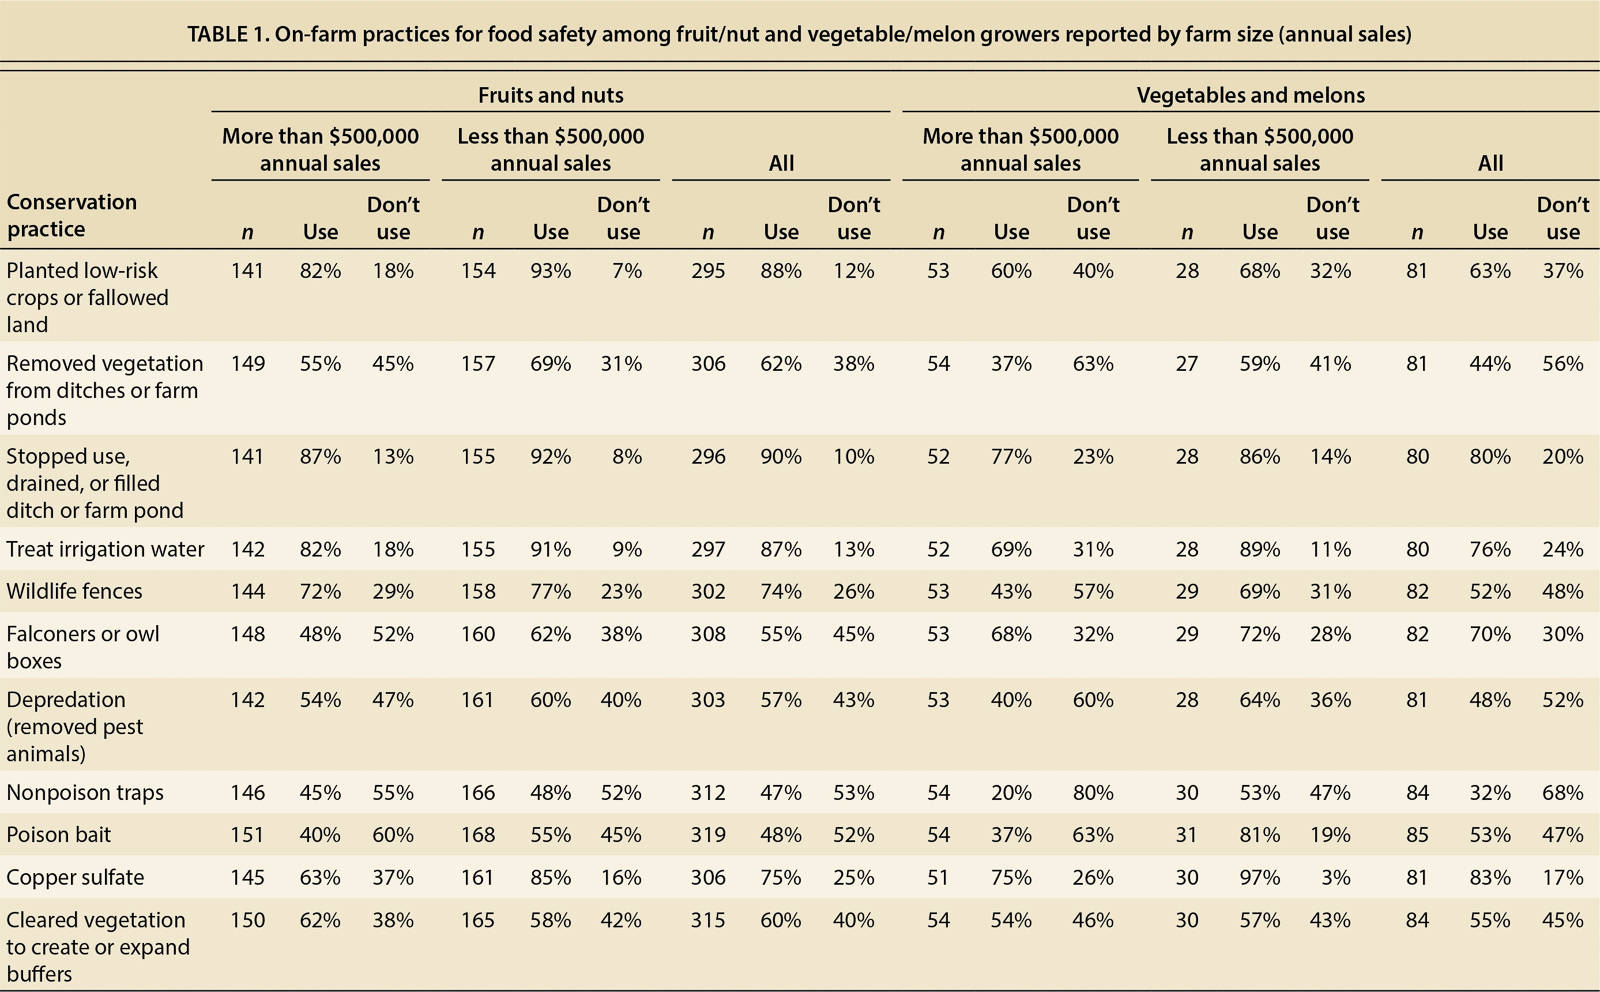
TABLE 1. On-farm practices for food safety among fruit/nut and vegetable/melon growers reported by farm size (annual sales)
A higher proportion of vegetable and melon growers reported using nonpoison traps (68%), but fewer overall reported using poison bait (47%). However, among vegetable and melon growers (n = 74 to 79), our models show that large farms were significantly more likely than small farms to report using nonpoison traps (80% vs. 47%) and poison bait (63% vs. 18%).
Reported use of wildlife fences was relatively low among fruit and nut growers (26%), but 48% of vegetable and melon growers reported using wildlife fences. No significant difference was detected across organic status or farm size for either group.
Similarly, less than half of fruit and nut growers (38%) reported removing vegetation from ditches or farm ponds; large farms were slightly more likely to report removing vegetation than were small farms. The majority of vegetable and melon growers (56%) reported removing vegetation from ditches or farm ponds; no significant difference was detected across organic status or farm size.
A total of 40% of fruit and nut growers and 45% of vegetable and melon growers reported clearing vegetation to create buffers; no significant differences were found across organic status or farm size. Very few respondents (<20%) in either produce category reported stopping use of, draining, or filling ditches or farm ponds because of a food safety concern. One in four fruit and nut growers and 17% of vegetable and melon growers reported using copper sulfate due to a food safety concern; large fruit and nut farms were significantly more likely to report use of copper sulfate than were small farms (37% vs. 16%).
Conservation practices
Most respondents (91%, n = 292) reported using at least one of the 20 conservation practices queried in the survey and about half (54%) reported using at least 5 such practices (data not shown). However, very few of the 20 conservation practices, when considered individually, were reported to be in widespread use (see tables 2 and S2 [ ucanr.edu/u.cfm?id=143 ] for detailed results). Less than a quarter of growers reported currently using constructed wetlands, vegetated water treatment systems, raw soil amendment (e.g., manure), grassed waterways and roads, riparian restoration, bee nest boxes, or beetle banks. In addition, among just fruit and nut growers, less than a quarter reported currently using a fully composted soil amendment (i.e., compost), heat-treated soil amendments (e.g., chicken manure pellets), or tailwater recovery ponds.
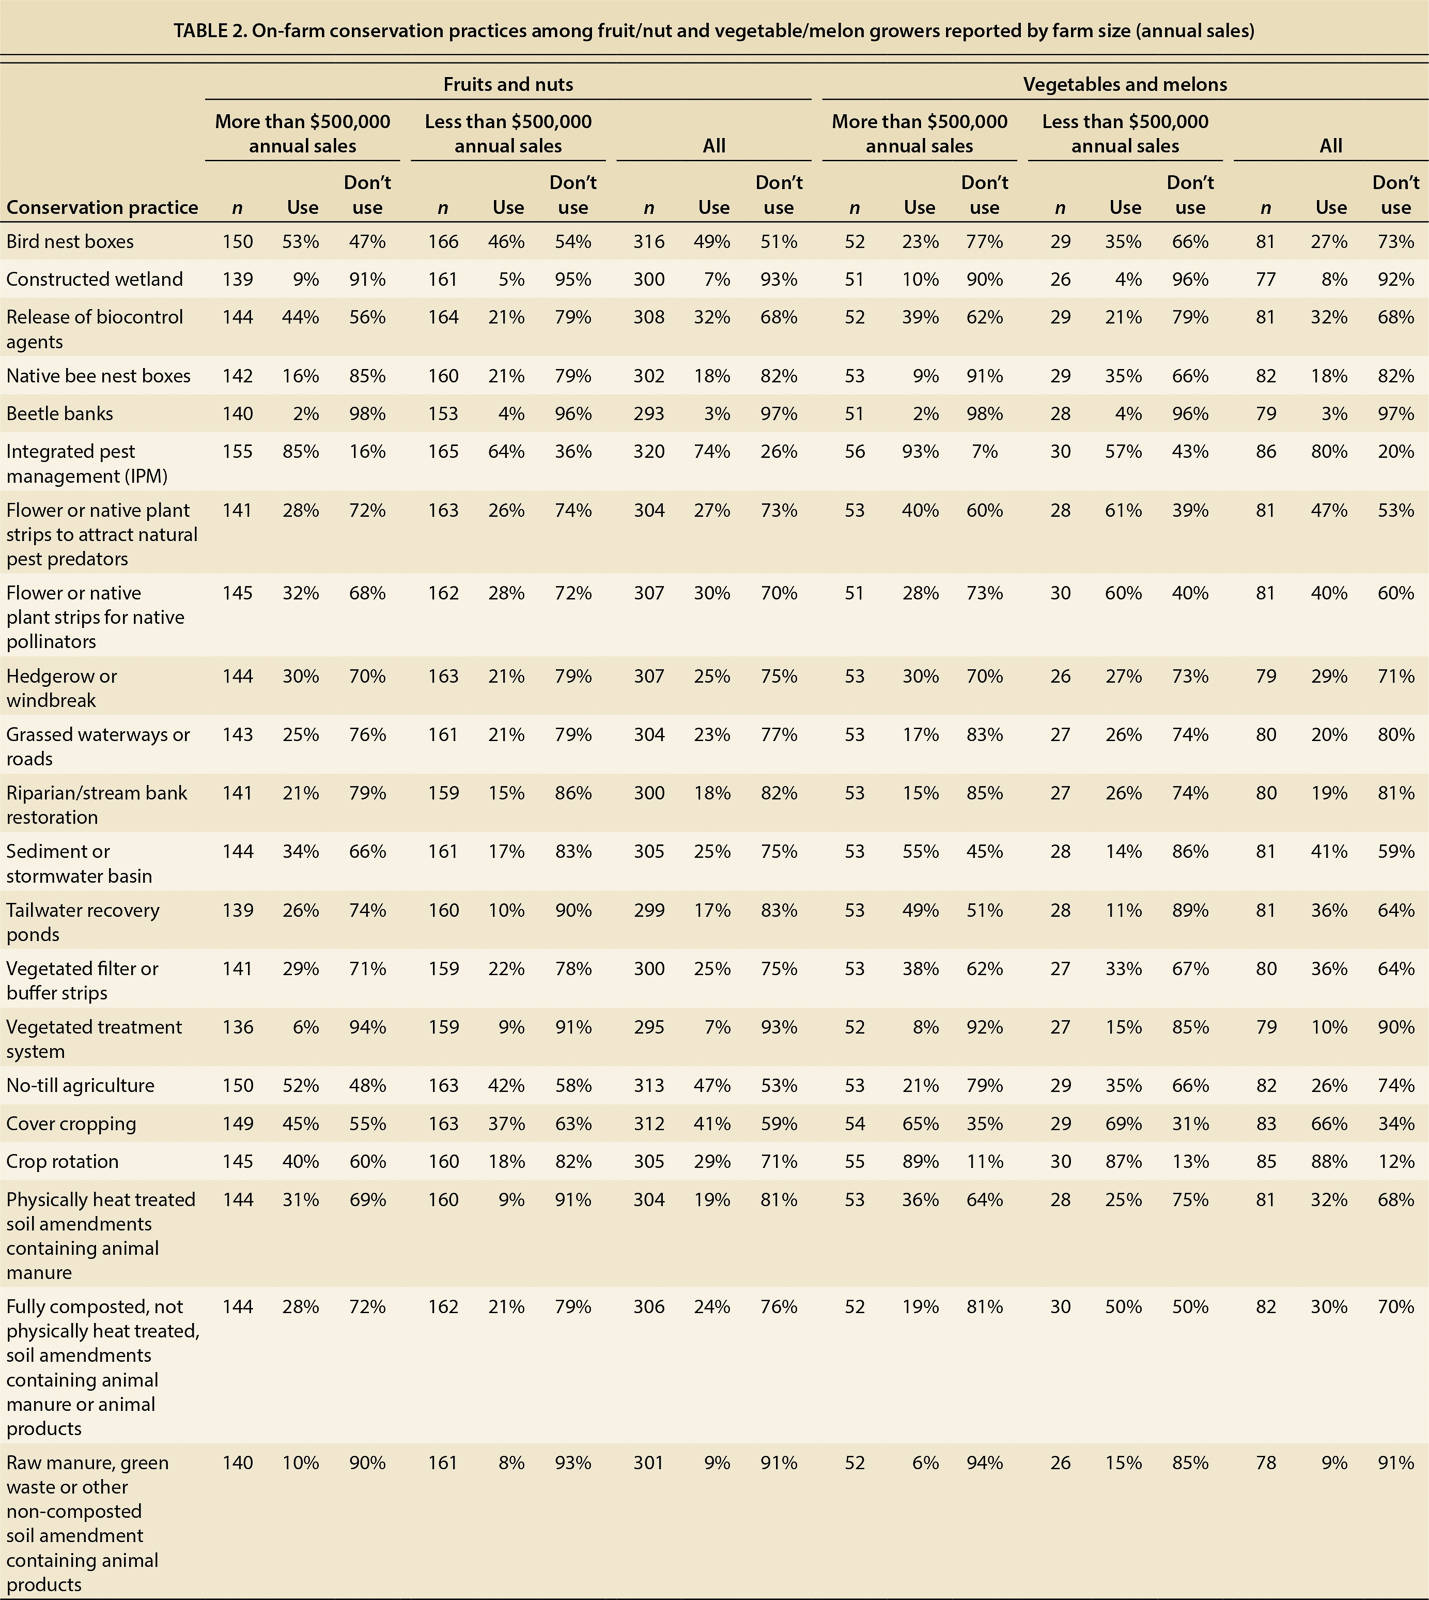
TABLE 2. On-farm conservation practices among fruit/nut and vegetable/melon growers reported by farm size (annual sales)
The most commonly reported conservation practice in both groups was integrated pest management (IPM), with 74% of fruit and nut growers and 80% of vegetable and melon growers reporting currently using IPM. Our models show that large farms in both groups were significantly more likely to use IPM than were small farms. Most vegetable and melon growers also reported using cover crops (66%) and crop rotation (88%).
Despite low overall use, significant differences in reported use between small and large farms were found for many conservation practices. Among fruit and nut growers (n = 280 to 305), our models show that large farms were significantly more likely than small farms to use biocontrol agents (44% vs. 21%), sediment or stormwater basins (34% vs. 17%), tailwater recovery ponds (26% vs. 10%), crop rotation (40% vs. 18%), and physically heat-treated soil amendments (31% vs. 9%).
Among vegetable and melon growers, large farms were significantly more likely than small farms to use sediment or stormwater basins (55% vs. 14%) and tailwater recovery ponds (49% vs. 11%). However, among these growers (n = 72 to 80), small farms were significantly more likely than large farms to use native bee nest boxes (35% vs. 9%), vegetated strips for native pollinators (60% vs. 28%), and fully composted soil amendments (50% vs. 19%). Not surprisingly, organic growers in both categories were more likely than conventional growers to report using biocontrol agents and vegetated strips for native pollinators and pest predators. Organic fruit and nut growers were also more likely than their conventional counterparts to use cover crops, crop rotation and physically heat-treated organic soil amendments.
Access to information
The survey asked respondents to indicate from whom they get information about best practices for food safety and for conservation. We summarize the responses (n = 336, undifferentiated by size or crop) in figure 3. It should be noted that these questions were asked at the end of the survey, and the response rate is lower most likely due to survey fatigue. It is possible that respondents might not have answered these questions because they felt uncomfortable with the topic, but no concerns were raised on these questions during either phase of piloting.
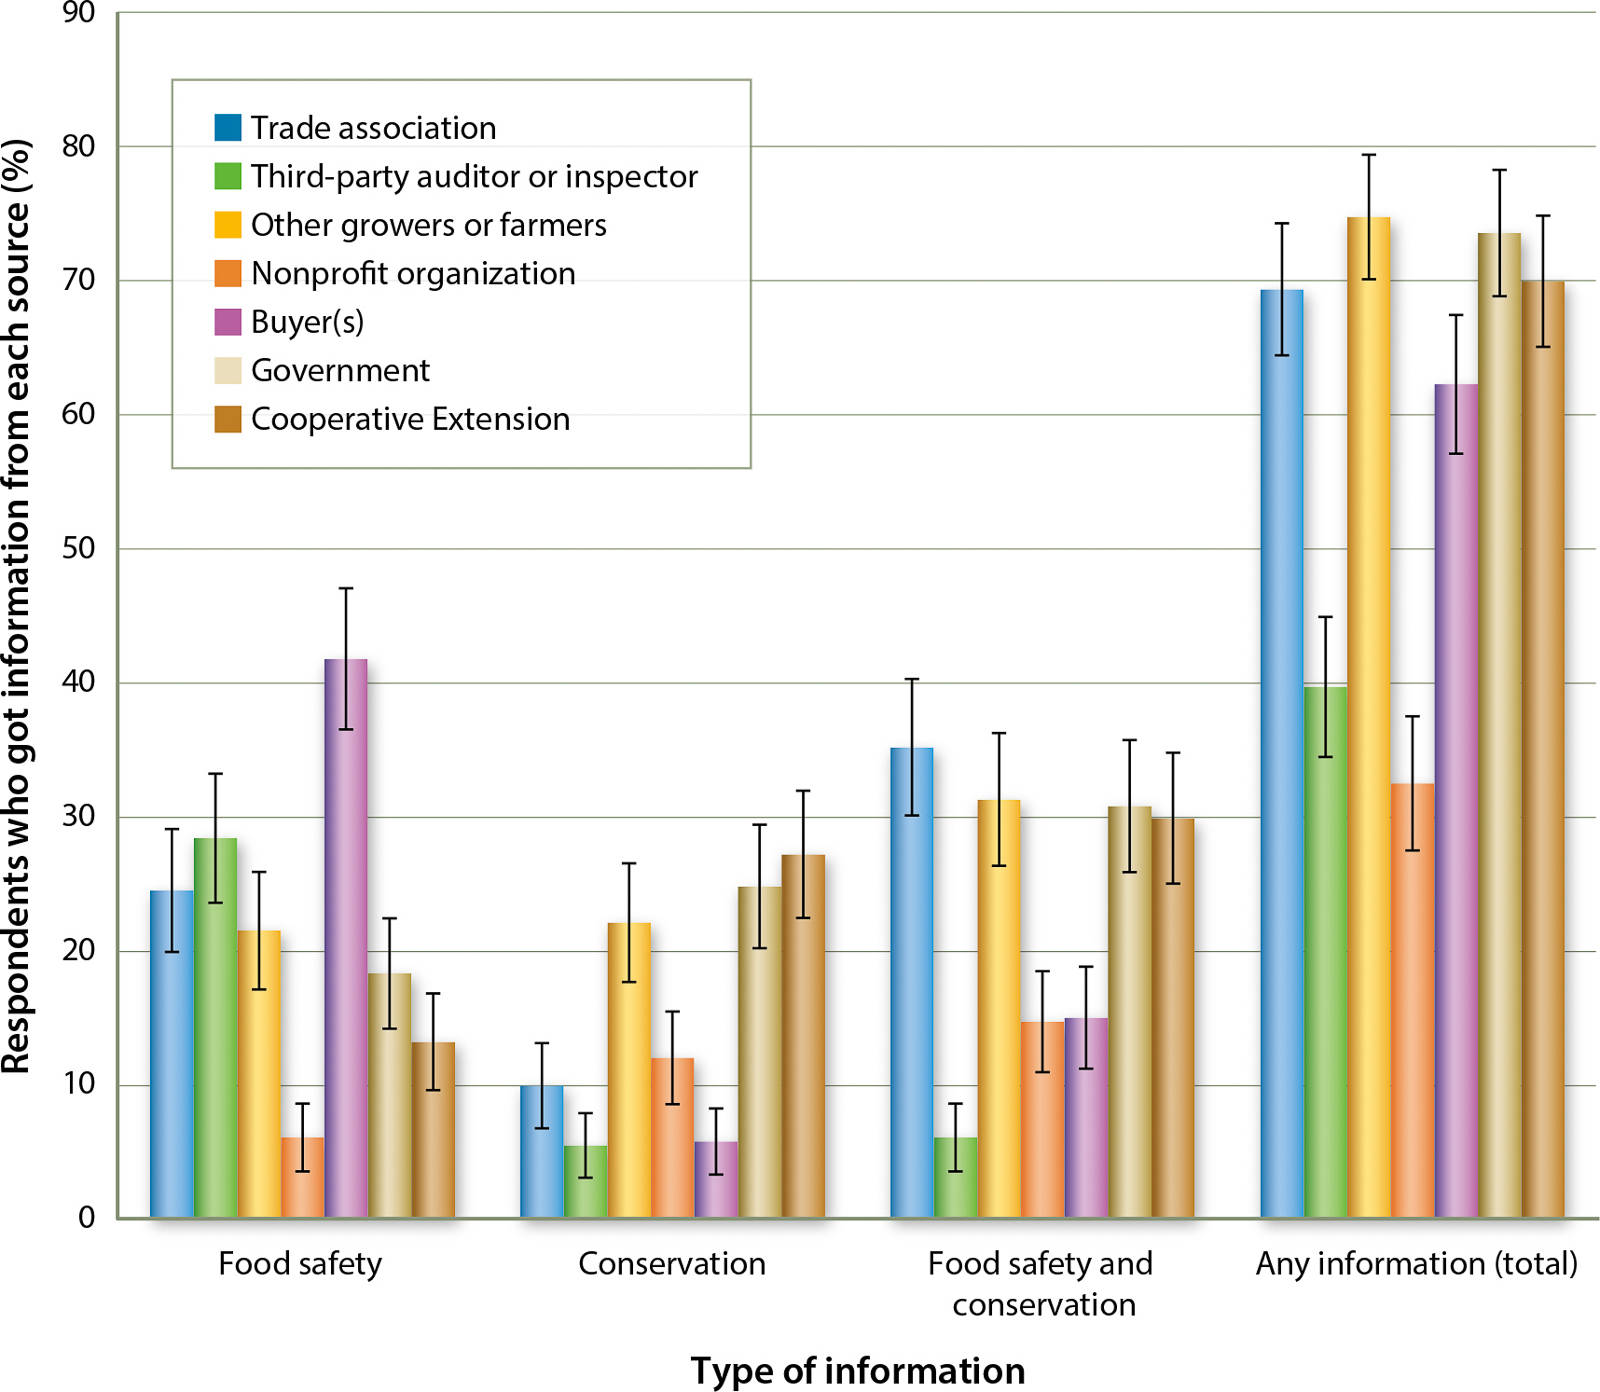
Fig. 3. Sources of food safety and conservation information for California produce growers (n = 336). Lines denote 95% confidence intervals.
Respondents reported receiving information on food safety and conservation (“any information” category in fig. 3) primarily from other growers (75% of respondents), government agencies (74%), Cooperative Extension advisors (70%) and trade associations (69%). For information exclusively about food safety, however, more respondents rely on their buyers (42%), third-party auditors/inspectors (28%) and trade associations (24%) than on government agencies (18%) or Cooperative Extension advisors (13%). Furthermore, respondents with large farms were significantly more likely (P < 0.01 using a Z-test to compare proportions) than respondents with small farms to rely on third-party auditors/inspectors (46% vs. 11%) and their buyers (50% vs. 34%) exclusively for food safety information (data not shown). For information about conservation, conversely, Cooperative Extension and government stand out, with 57% and 55% of all respondents seeking some form of conservation information from them, respectively (“Only conservation” category in fig. 3). There was no statistically significant difference between large and small farms for information only about conservation (data not shown).
The survey also asked growers to rank the factors of importance in resolving their buyers’ food safety concerns. Respondents with large farms were much more likely to rank certification more important and to rank the length of the relationship with their buyer and buyer site visits less important than were growers with small farms (fig. 4).
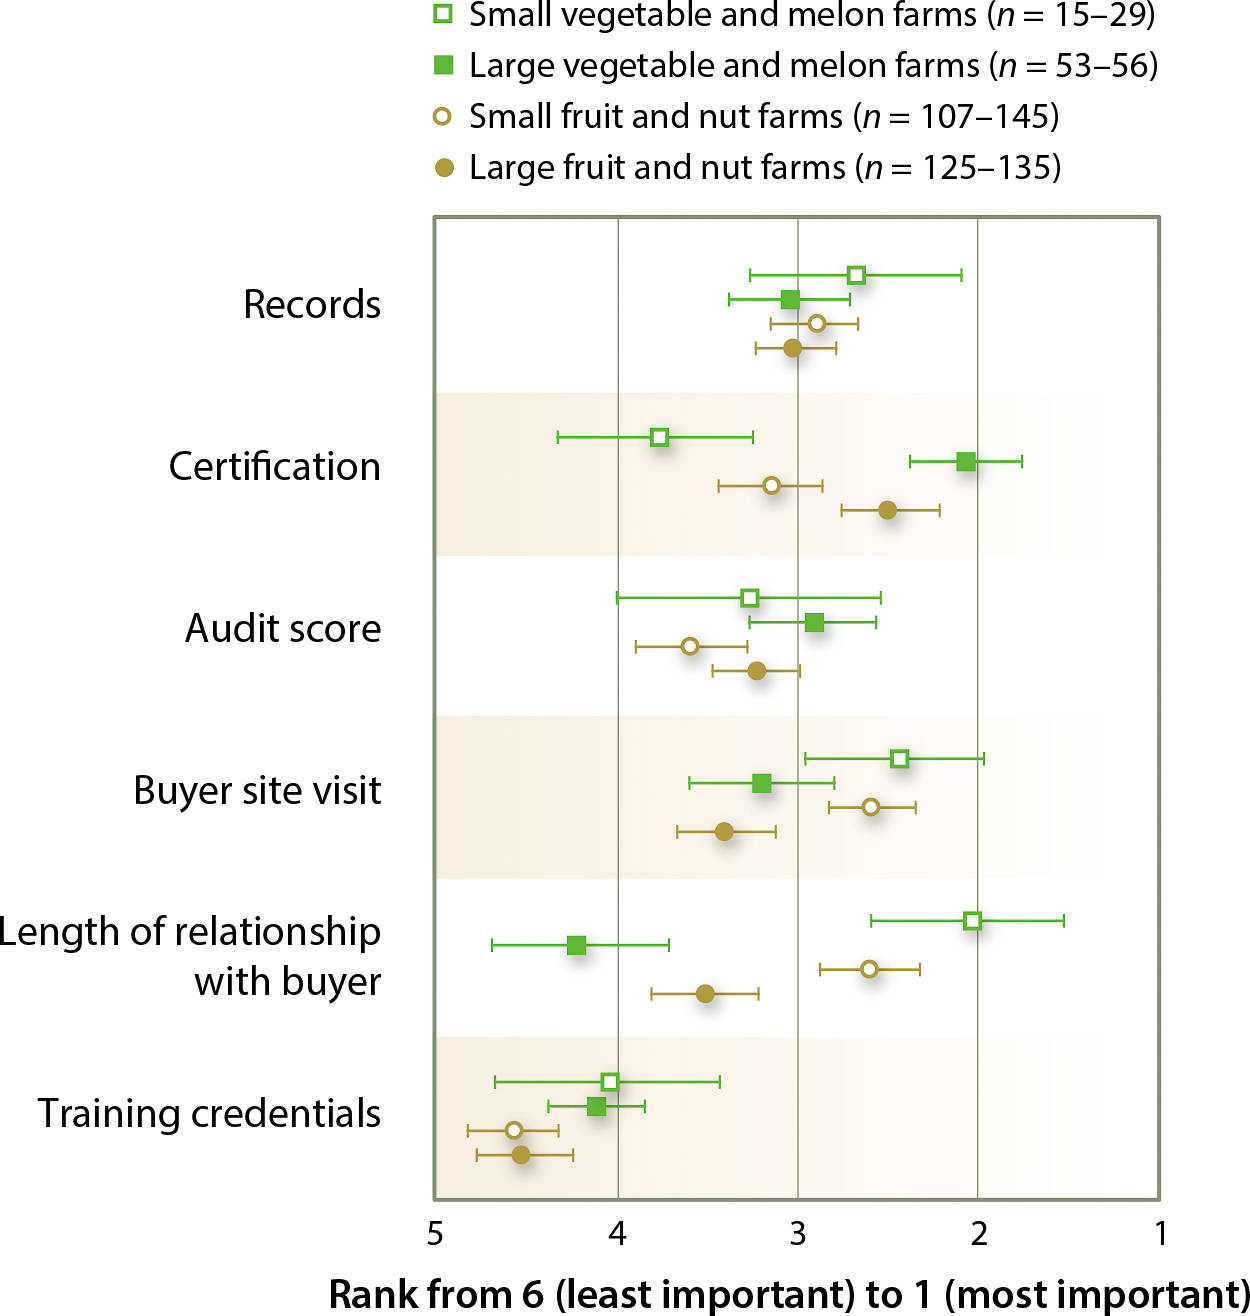
Fig. 4. Factors of importance in resolving buyer food safety concerns. The vertical axis measures the average rank for each factor by grower group. n values vary as not all respondents chose to rank all six factors, see legend. Error bars represent 95% confidence intervals, estimated using a bootstrap method with case resampling.
Respondents were also asked how they prefer to get information and what topics are of most use to them. On a scale of 1 (most) to 6 (least) useful, respondents ranked in-person workshops (2.6) and written guidance available either online (2.7) or in paper format (2.8) significantly more highly than online webinars/trainings (3.9) or videos (4.1). Using a bootstrap method with case resampling to estimate 95% confidence intervals for the rankings, no significant differences were observed across crop type or farm size (data not shown).
Most respondents (n = 374, undifferentiated by size or crop) wanted information on regulatory requirements (82%), detailed best practice guidance (72%), what technologies and tools are available (69%), implementation costs (63%), and evidence of the effectiveness of tools and practices for managing food safety hazards (62%). Around half of respondents felt that information about how to co-manage food safety and agricultural conservation (59%), how to prepare for a food safety audit (52%), and guidance/tools for developing good agricultural practices (GAPs) (52%) would be useful. Only 39% felt that information about available consulting services would be of use. No significant differences were observed across crop type or farm size.
Grower perceptions, opinions
The survey asked respondents whether they agreed or disagreed with a set of statements about food safety and conservation. Again, response rates for these questions are lower (data not shown), most likely due to survey fatigue.
Past surveys have indicated that many on-farm practices for food safety are both costly (Hardesty and Kusunose 2009) and pose an ethical dilemma for growers (Stuart 2009). Among our respondents, however, most fruit and nut growers (78%, n = 279) and vegetable and melon growers (71%, n = 77) believed that their on-farm practices for food safety are compatible with their environmental stewardship goals; only 8% and 16%, respectively, perceived a conflict.
Most respondents were confident that they had or could easily get information on food safety; only 17% of fruit and nut growers (n = 273) and 16% of vegetable and melon growers (n = 77) responded that they could not.
Furthermore, the overwhelming majority of fruit and nut growers and vegetable and melon growers agreed or strongly agreed that it is their responsibility to protect food safety (92%, n = 305, and 96%, n = 82, respectively) and water quality and the environment (93%, n = 309, and 95%, n = 81, respectively) on their farm.
That said, many respondents perceived problems with the auditing process. Only 42% of fruit and nut growers (n = 187) and 50% of vegetable and melon growers (n = 62) reported that they agree with government or third-party auditors when those auditors identify potential food safety risks. Moreover, just 16% of fruit and nut growers (n = 191) and 18% of vegetable and melon growers (n = 62) agreed that auditors are consistent.
When asked if they agreed that their products are safer following food safety certification, 39% of fruit and nut growers (n = 170) and 39% of vegetable and melon growers (n = 61) disagreed or strongly disagreed. The response rate for questions asking about auditors and certification was markedly lower; we presume this is because many respondents do not maintain third-party certification and so skipped these questions as not applicable to their operations. A majority of respondents agreed that buyers cooperate with them to address food safety concerns (71% of fruit and nut growers, n = 237, and 69% of vegetable and melon growers, n = 67), and that they can adequately address their buyers’ food safety concerns (76%, n = 246, and 80%, n = 69, respectively).
Tension and inconsistency persist
The results of our survey suggest that on-farm practices for food safety that target wildlife and potentially impact natural communities and ecosystem services via vegetation and habitat removal are still used in produce agriculture in California. Past surveys of on-farm practices used by leafy greens growers in the Central Coast found that the most common practices were buffers around cropped fields and poison bait (>50% respondents), followed by wildlife trapping and wildlife exclusion fencing (∼40%) (Beretti and Stuart 2008; Lowell et al 2010). Respondents to our survey reported similar if not higher rates of use for these same practices, suggesting that practices have remained constant within the leafy greens sector over the past 6 years and that, possibly due to expanding food safety regulations, food safety pressures and practices now reach into other sectors of the produce industry, as well.
As discussed above, many of these legacy practices have not been shown to reduce food safety risk, and growing evidence points to their impacts on ecosystem services and other public goods and benefits (Karp et al. 2015; Karp et al. 2016; Karp, Baur et al. 2015; Letourneau et al. 2015). Nevertheless, we found that many growers still use these and similar practices, suggesting that the on-farm practices which growers perceive to be required of them do not yet reflect available scientific information.
The impact of requiring on-farm practices for food safety depends upon how and by whom rules are written and enforced, and the scale of the farm. Future field-based research should address whether this difference is due to the greater resources available to large farms or to different levels of risk and oversight associated with different market channels and supply chains.
Our survey suggests that food safety and conservation are practiced and interpreted differently by growers of different size and crop type. Farms in our sample with annual sales over $500,000, for example, were more likely than farms with annual sales under $500,000 to report practicing some form of animal intrusion prevention, such as fencing or trapping. However, even among farms of similar size growing similar crops, we found a wide range of variation. Rather than converging as scientific evidence and experience grow, on-farm practices for food safety are highly heterogeneous across produce agriculture in California, suggesting that either requirements, or grower interpretations of those requirements, are inconsistent.
Inconsistency in real or perceived food safety pressures raises several concerns. Our results show that many growers rely on each other for both food safety and conservation information, but perceptions of practices for food safety and knowledge of regulations varied greatly among growers. Mixed messages from their peers could lead to uncertainty over legal requirements and the potential consequences of noncompliance. In the face of uncertainty, growers may take what seems to be a conservative approach by adopting wildlife deterrence and vegetated habitat removal practices that have not been scientifically shown to reduce risk. While open-ended or flexible regulation may aim to give farmers more freedom, inconsistencies in food safety pressures can also make it more difficult to provide guidance on strategies to co-manage food safety and sustainability goals.
In addition, the majority of our survey respondents reported that auditors are inconsistent in their assessments. A high degree of inconsistency may make food safety requirements appear arbitrary to growers, especially if evidence is not provided along with the justification for decisions or recommendations. A significant proportion of our respondents also did not believe that food safety certification has made their products safer, despite the high importance of certification in securing access to larger buyers. Lastly, the higher the degree of inconsistency in interpreting and responding to food safety pressures, the higher the degree of difficulty for regulators — and the consuming public — to know whether the produce industry has effectively made food safer.
Finding the right balance
Taken together, our findings highlight that discrepancies remain among California produce growers with respect to their access to current, relevant food safety science and other information; their perceptions of what environmental factors pose food safety risks; and how decisions are made about which practices best suit their farming context. At the very least, there is a need for greater support for outreach programs on food safety for buyers, auditors and trade associations as well as growers, particularly further guidance as to which suite of food safety practices are most effective and compatible with protection of natural resources and ecosystem services in a variety of farm settings. However, the desire for consistency must be balanced against the need for flexibility. Farms are complex and variable environments, and interpretation of food safety risks and appropriate preventive actions depends upon the particular context of a given operation. As discussed above, the FDA Produce Safety Rule acknowledges this need by providing a degree of flexibility to growing operations, but it is necessary to evaluate the extent to which that flexibility will lead to on-farm practices that actually improve safety while minimizing environmental and economic costs.
Our results suggest that in some cases pressures from third-party auditors and produce buyers may lead to inconsistency in the interpretation and implementation of food safety regulations and guidance, but our survey was conducted prior to the finalization of the Produce Safety Rule. In light of this significant regulatory development since the survey was administered, additional survey and interview-based research is needed to determine the extent to which growers adopt practices based on their own goals or perceived pressures from their buyers, third-party certifiers/auditors or government regulators. Future research should investigate who has the power to decide what practices are best for food safety, and whether and in what ways the distribution of decision-making authority affects the balance between consistency and flexibility.
Greater alignment and collaboration between environmental and food safety science is needed to establish a more comprehensive catalogue of practices that can help growers mitigate pathogen risks while also protecting the environment and ecosystem services. A call for consistent rules and enforcement must allow a responsive flexibility in implementing food safety guidelines. A balance is necessary. While we cannot say what that balance should be, it is apparent from our survey that any discussion of balance can only improve with better understanding of extant food safety pressures and the ways in which they are perceived and put into practice by growers. More transparent information on what practices growers adopt in the name of food safety, and why growers adopt those practices, is urgently needed. It would improve consistency and help promote food safety efficiently and without unnecessary impacts on the environment. That would benefit both farmers and consumers.
Citations
Inconsistent food safety pressures complicate environmental conservation for California produce growers

