


All Issues
Carbon calculator tracks the climate benefits of managed private forests
Publication Information
California Agriculture 69(1):21-26. https://doi.org/10.3733/ca.v069n01p21
Published online January 01, 2015
NALT Keywords
Abstract
As part of California's strategy to reduce greenhouse gas emissions, private forest landowners are now required to address carbon sequestration as a management goal when submitting timber harvest plans. Using public data on forests and forest products, we developed a calculator that tracks the carbon sequestration benefits related to live trees, wood used for bioenergy and wood going into products. The calculator is adapted for different forest types, forest management techniques and time frames. Based on current best practices used in California, we estimate that harvested and regenerated forests will provide approximately 30% more total carbon sequestration benefits than forests left to grow for an equal time. More than half of the total benefits relate to harvested wood substituting for fossil fuels and fossil fuel–intensive materials such as cement and steel. With relatively efficient management practices, harvesting a ton of wood provides more sequestration benefits than leaving that ton growing in the forest.
Full text
It is well documented that very limited progress has been made at the global level to reduce greenhouse gas emissions and that geoengineering technologies will be insufficient to reverse the trend of rising emissions (Nordhaus 2013). However, there is progress at the state level. As it implements the California Global Warming Solutions Act of 2006 (AB 32), California is taking the lead in this country in promoting innovative approaches to emission reductions and mitigation measures. One potentially cost-effective mitigation measure is the maintenance and enhancement of carbon sequestration in forests and forest products (Joyce et al. 2014; Smith et al. 2009).
How to compare the climate benefits of joint use and no-harvest forest management approaches is being debated. Some researchers suggest that the “joint use of carbon sequestration and the provision of forest-derived products (e.g., timber and biomass for energy) will optimize the contribution of forestry in climate mitigation” (Canadell and Raupach 2008). Researchers who ignore the climate benefits related to forest products often conclude that a no-harvest approach is preferable.
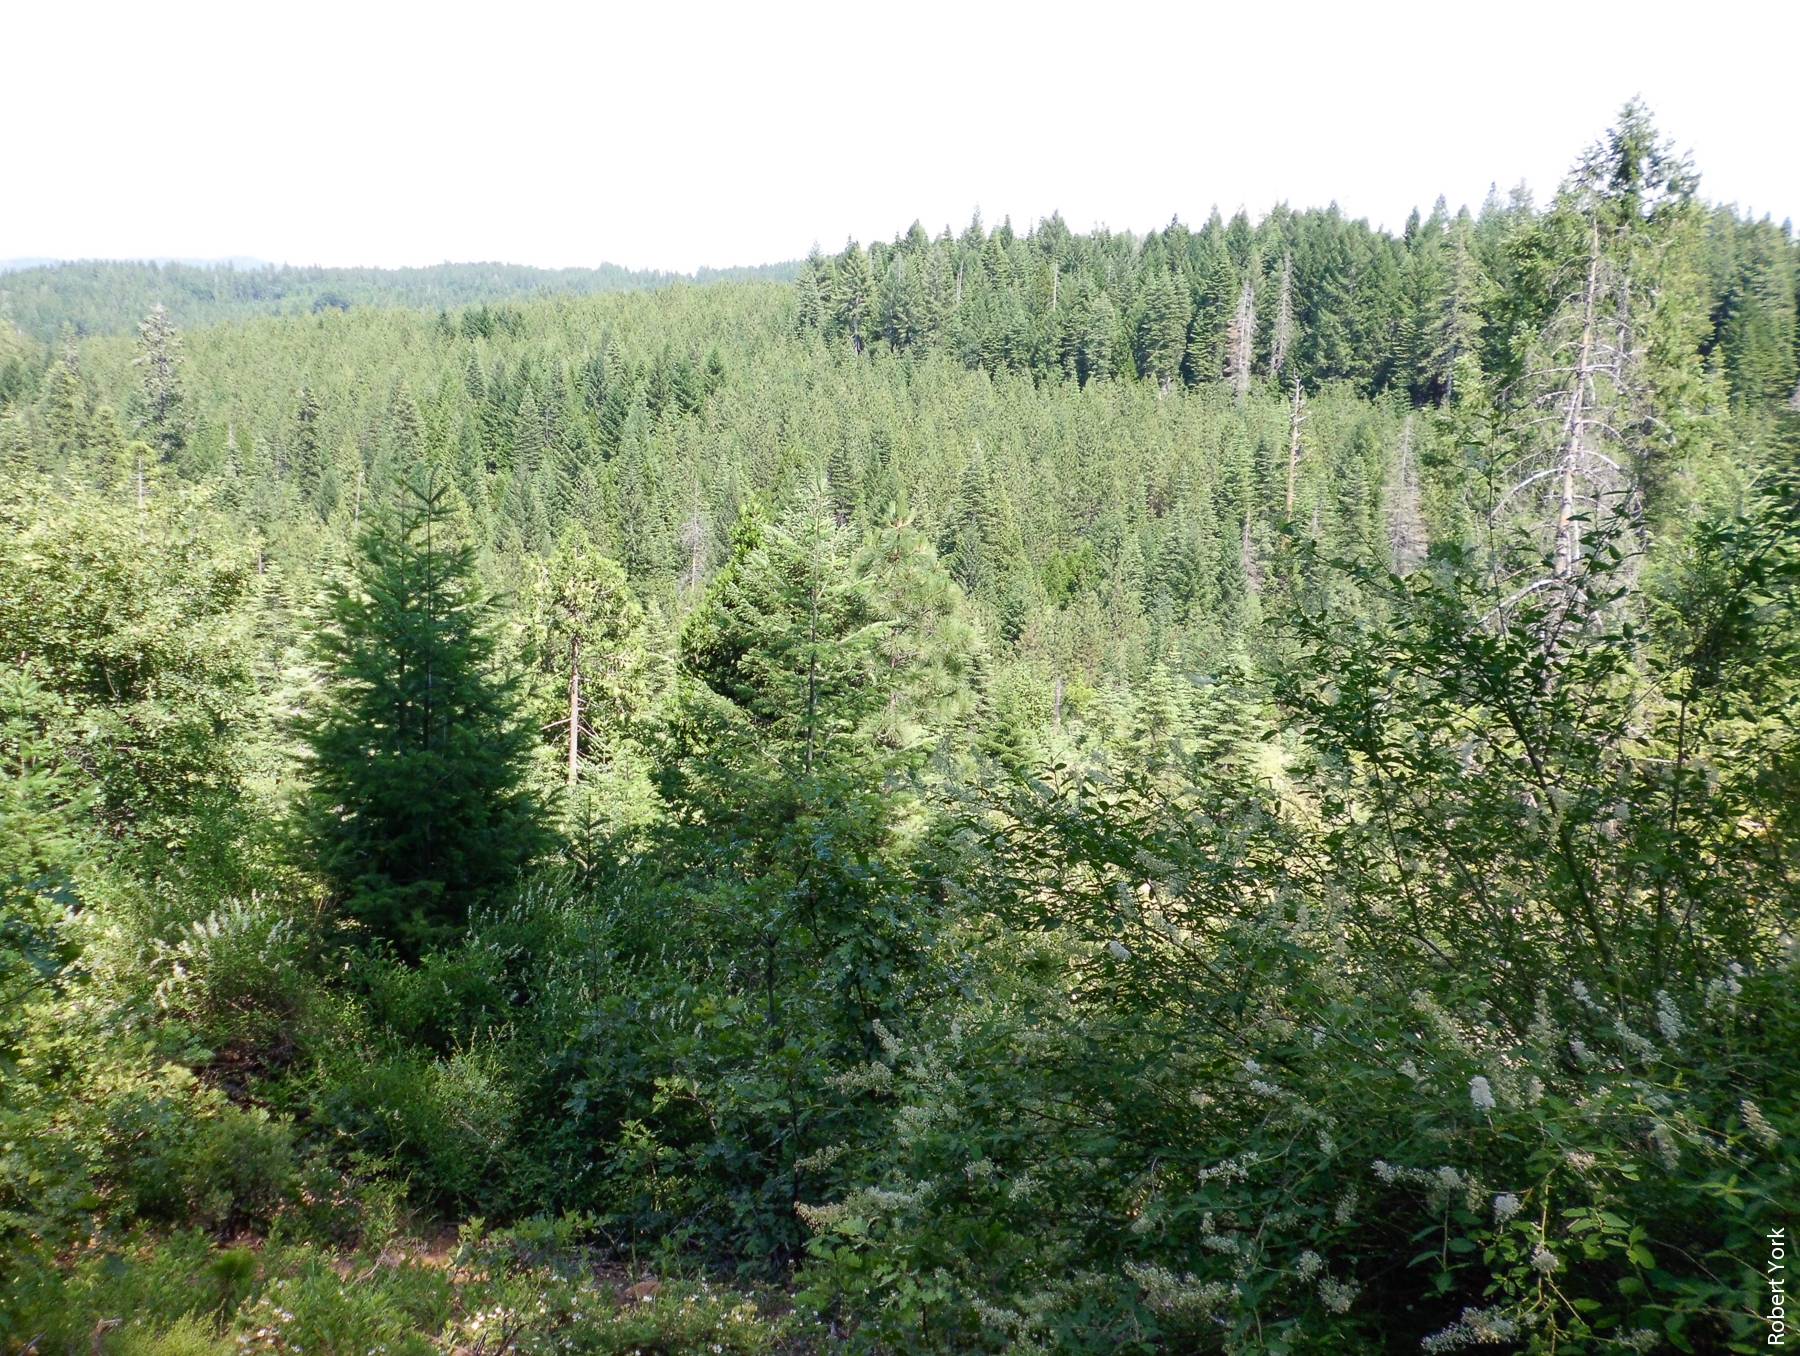
UC researchers have developed a tool that helps users understand how forest management options will affect carbon sequestration. Above, managed stands of mixed-conifer forest in the Sierra Nevada.
There is no consistent approach for counting carbon sequestration benefits of forests and forest products in global, federal and state inventory systems. At the global level, benefits are covered in three different sections of national greenhouse gas inventories: agriculture, forests and other land uses (AFOLU); energy systems; and buildings (IPCC 2006). At the federal level, greenhouse gas inventories, emissions and net sequestration are tracked for forests, wood products in use and wood products deposited in landfills. Emissions from wood used for bioenergy are not included in national emission totals since they reduce the need to burn fossil fuels (US EPA 2014). Sequestration benefits of using wood for bioenergy depend on fossil fuel displacement and how the bioenergy utilization is integrated with overall forest management (Malmsheimer et al. 2011; Smyth et al. 2014). At the state level, California's 2014 Climate Change Scoping Plan mentions the positive benefits of using more wood products in construction and more wood chips to generate energy, but the accounting framework and recommended policies focus only on increasing carbon inventories in the forest (California Air Resources Board 2014).
Foresters who submit timber harvest plans in California face the challenge of demonstrating compliance with California's numerous climate-oriented laws even though different carbon accounting systems can produce conflicting results and the relevant laws are complex in their aims. In 2010, AB 1504 revised the intent of the Z'Berg Nejedly Forest Practices Act regulating nonfederal forest lands to ensure both of these goals: “(a) Where feasible, the productivity of timberlands is restored, enhanced, and maintained. (b) The goal of maximum sustained production of high-quality timber products is achieved while giving consideration to values relating to sequestration of carbon dioxide, recreation, watershed, wildlife, range and forage, fisheries, regional economic vitality, employment, and aesthetic enjoyment” (California Code of Regulations 2010). In addition, the state's forests are diverse; they vary considerably in terms of dominant tree species, ownership and productivity (table 1).
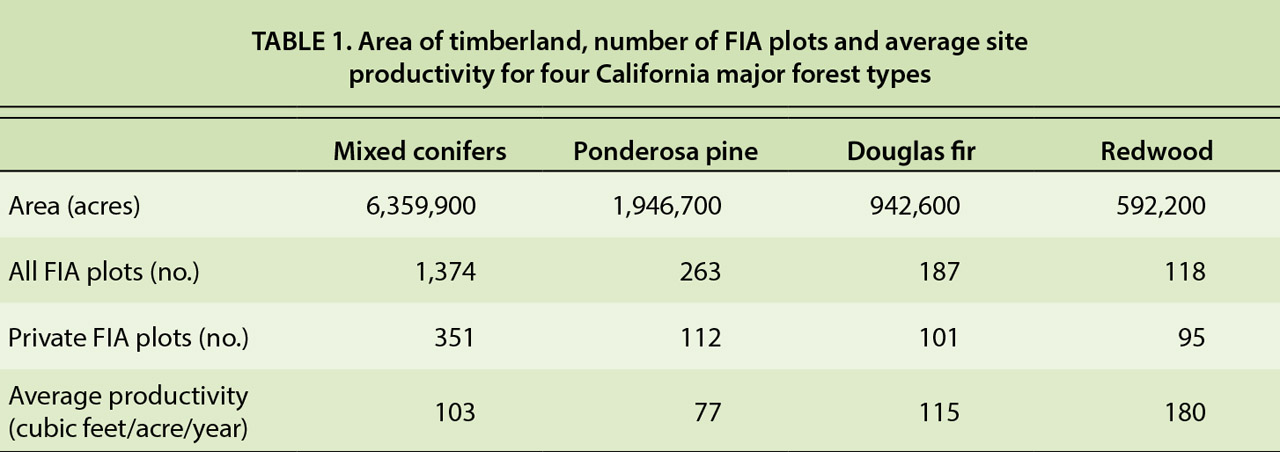
TABLE 1. Area of timberland, number of FIA plots and average site productivity for four California major forest types
Developing a calculator
To help forest landowners describe how a managed forest meets the goals of the Forest Practices Act, we developed a carbon calculator to document the climate benefits of a forest and any harvested forest products. To be relevant for both submitters and regulators, the calculator covers a range of forest types, forest management options and products. We used current publicly available information and presented the carbon calculation in a disaggregated format so that submitters, regulators and other interested parties can see how it is achieved.
To project forest carbon inventories over long time periods with significant but unknown probabilities of disturbance losses, we used the Carbon Online Estimator (COLE) growth model (Van Deusen and Heath 2014). This free Web-based tool allows users to create and download reports summarizing carbon sequestration in U.S. Forest Service forest inventory and analysis (FIA) plots.
We used tree growth data from nearly 2,000 FIA plots on private and federal lands to generate reports for California's four major timberland types — mixed conifers, ponderosa pine, Douglas fir and redwood. We then used Von Bertalanffy growth equations (Van Deusen and Heath 2014) for each forest type to model live tree carbon. The trajectory of a let-grow forest — one that is not harvested but left to grow — is based on the observed rate of live tree carbon by stand age. It illustrates a slowing growth rate of net aboveground carbon sequestration as the forest ages.
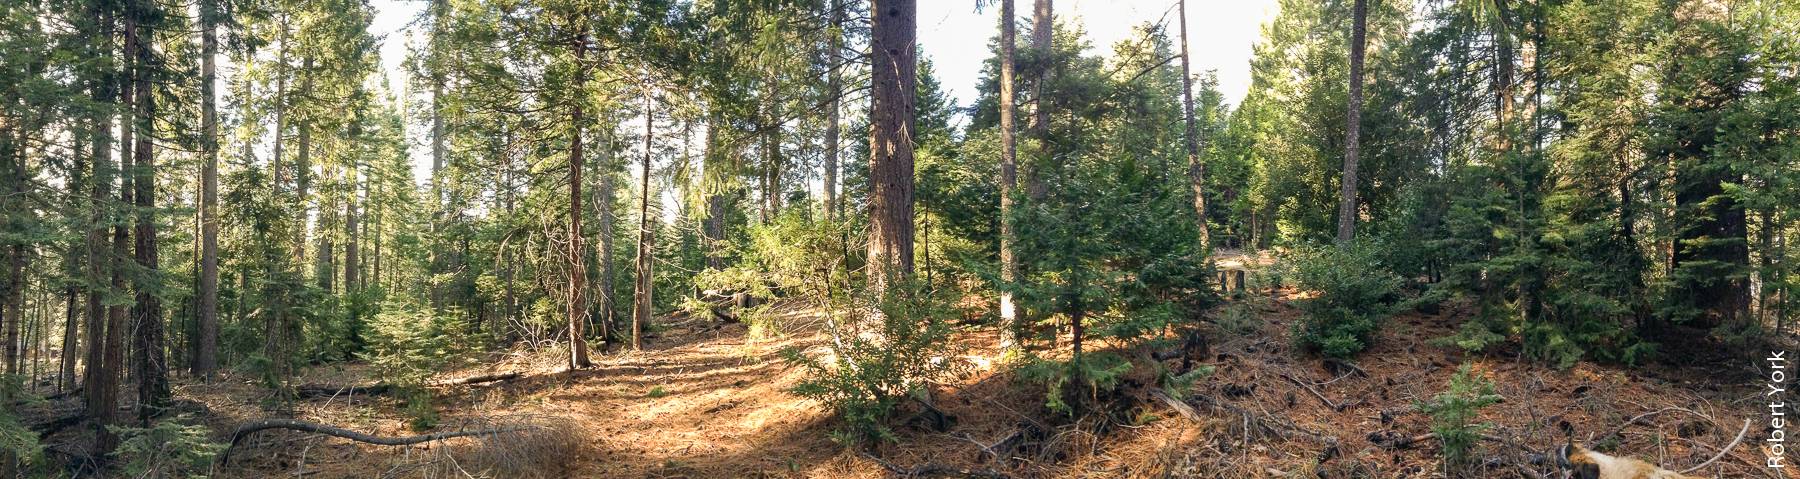
The increase in carbon stands over time in a let-grow forest, above, is based on the observed rate of live tree carbon by stand age.
To estimate the sequestration benefits associated with harvested products, we used the most current state and regional information on where harvested wood goes (Morgan et al. 2012) and how products are used (McKeever and Howard 2011; Sathre and O'Connor 2010; Skog 2008; Smith et al. 2009). Stewart and Nakamura (2012) used these same sources and estimated that the sequestration benefits of harvested wood were two times (when wood used for bioenergy is considered) to four times (when bioenergy use is not considered) larger than those estimated by models such as the greenhouse gas emission calculator developed by the California Department of Forestry and Fire Protection (Cal Fire 2010) that use the older estimates from Smith et al. (2006).
All forest carbon that is cut at harvest was accounted for as logging slash left, logging slash used for energy, mill residues used for energy, wood products and mill waste. The regenerated forest was then modeled with the Von Bertalanffy growth coefficients based on relevant private forest plots, where competing vegetation is controlled. The emissions related to fossil fuel energy used in the harvest operations were estimated as 3% of the total energy value of the harvest based on Wihersaari (2005) and subtracted to generate a net carbon sequestration value for the harvest operations.
We used the best practices assumption of 75% slash utilization for delivery to wood-fired energy plants with the remainder left to slowly decompose on site. This is lower than the sample of projects in Northern California documented by Stewart and Nakamura (2012) but higher than the 66% used by Ince et al. (2011). We provided variants with 0% and 25% slash utilization since recent closures of some wood-fired energy plants due to insufficient payments for the wholesale electricity warrant modeling lower collection rate estimates.
Our modeling tracked wood products through sawmills and energy plants, drawing on published allocation of products and conversion efficiencies (Christensen et al. 2008; Morgan et al. 2012). Our 45-year half-life for wood products produced in California was based on the weighted combination of a 60-year half-life for lumber products (McKeever and Howard 2011; Skog 2008) and a 15-year half-life for other products that is proportional to the allocation in California (Morgan et al. 2012). According to McKeever and Howard (2011), 57% of California's lumber products go into buildings, where the wood is estimated to provide additional carbon sequestration benefits and energy savings by displacing fossil fuel alternatives (Sathre and O'Connor 2010). The estimated allocation of postconsumer wood residues between landfills, energy and uncollected waste was based on estimates by Stewart and Nakamura (2012) of current best practices in California; undoubtedly these could improve with better technologies and financial incentives.
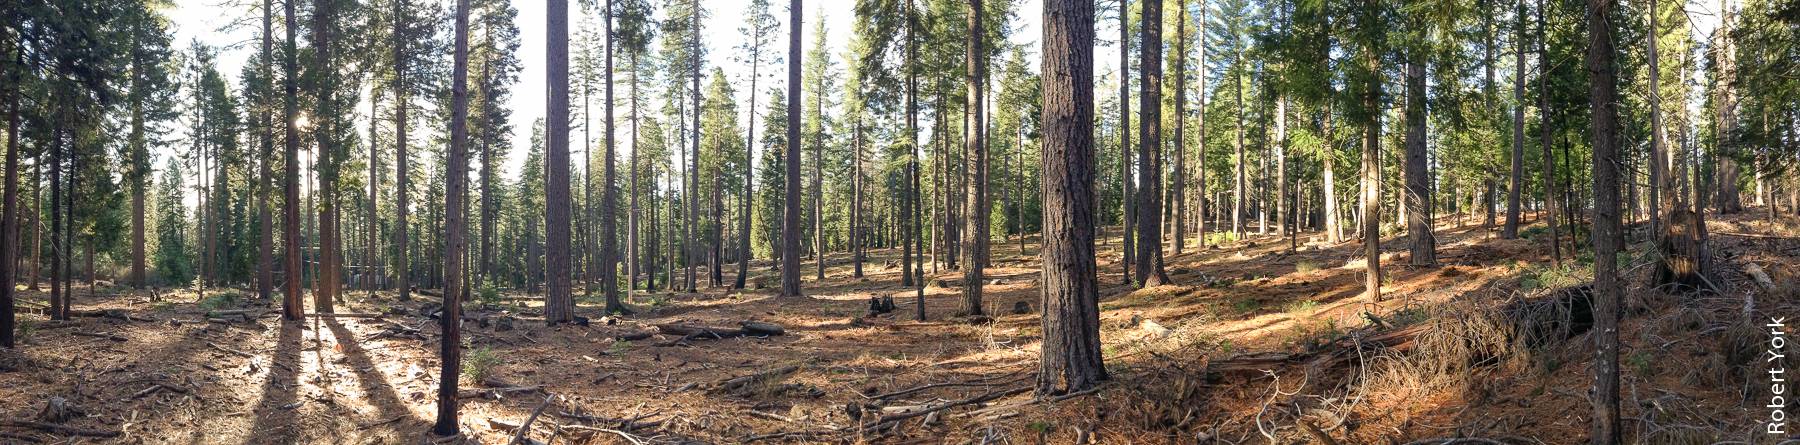
Above, a forest stand at Blodgett Forest Research Station treated with uneven aged, 75% slash utilization forest management.
To conform with the units used in COLE reports (Van Deusen and Heath 2014), we used a single hectare (2.47 acres) as the unit of analysis. We modeled different actions on an 80-year-old forest that had been treated with a light commercial thin 40 years earlier. The regenerating forest as well as the products were then tracked for 40 years, 80 years (approximately the half-life of wood used in single family homes (Skog 2008)) and 160 years to illustrate how the length of the analysis affected the climate benefit comparisons.
As noted earlier, uncertainty remains on how to account for future rates of forest growth as well as climate benefits that accrue outside of the forest sector related to using wood products and bioenergy rather than fossil fuel–intensive products such as cement, steel, coal and natural gas (Smyth et al. 2014). We cannot accurately predict how future forest growth rates will compare to the historic rates used in the calculator. We also did not include any probability of stand-terminating disturbances such as wildfires or insect outbreaks that would reduce long-term carbon sequestration. Different building rating systems such as LEED and Green Globe use various methods to estimate the carbon footprint of using wood rather than concrete in buildings. Depending on the location of a forest project, the ability to sell the slash for bioenergy in the future may be limited if the goals of California's 2012 Bioenergy Action Plan are not achieved.
Using the calculator
In 2013, we expanded the carbon sequestration model submitted with our 2011 timber harvest plan for the mixed-conifer forests at the UC Blodgett Forest Research Station (University of California 2014) to cover more forest types and more management options. The current tool and a user guide are posted on UC's Forest Research and Outreach website (UCCE 2014). The user's first step is to choose a forest type that best matches the area in the user's proposed timber harvest plan. After choosing the relevant forest type, users can review worksheets with detailed forest growth and product life cycle information based on published literature to choose the relevant factors to match their plan. If desired, the user can alter any of the input coefficients to customize the output.
The next step is to choose the forest management option that best matches the user's situation. A let-grow alternative is included with each option to provide a harvest/no-harvest comparison. Tables and figures in the upper left section of each management option worksheet summarize the input coefficients as well as the results.
Users can estimate the total sequestration for their timber harvest plan by multiplying the area of the most relevant harvest type by the relevant coefficients. Carbon quantities should be multiplied by 3.67 to provide measurements in standardized tons of carbon dioxide used in emission-based accounting systems.
A review of a forest project example demonstrates the results a forester can gain by using the calculator to estimate the net climate benefits associated with a timber harvest plan. Figure 1 shows the carbon sequestration in a mixed-conifer forest under two scenarios: unharvested (or let-grow) and an even-aged harvest and regeneration option with 75% of slash (logging residues) used for energy. The solid blue line models the predicted rate of carbon sequestration in live trees for the unharvested forest based on the COLE forest growth model. The stacked columns show the carbon sequestration of the harvested forest — the regenerated forest (also modeled with the COLE forest growth model) plus the sequestration benefits associated with the harvested products.
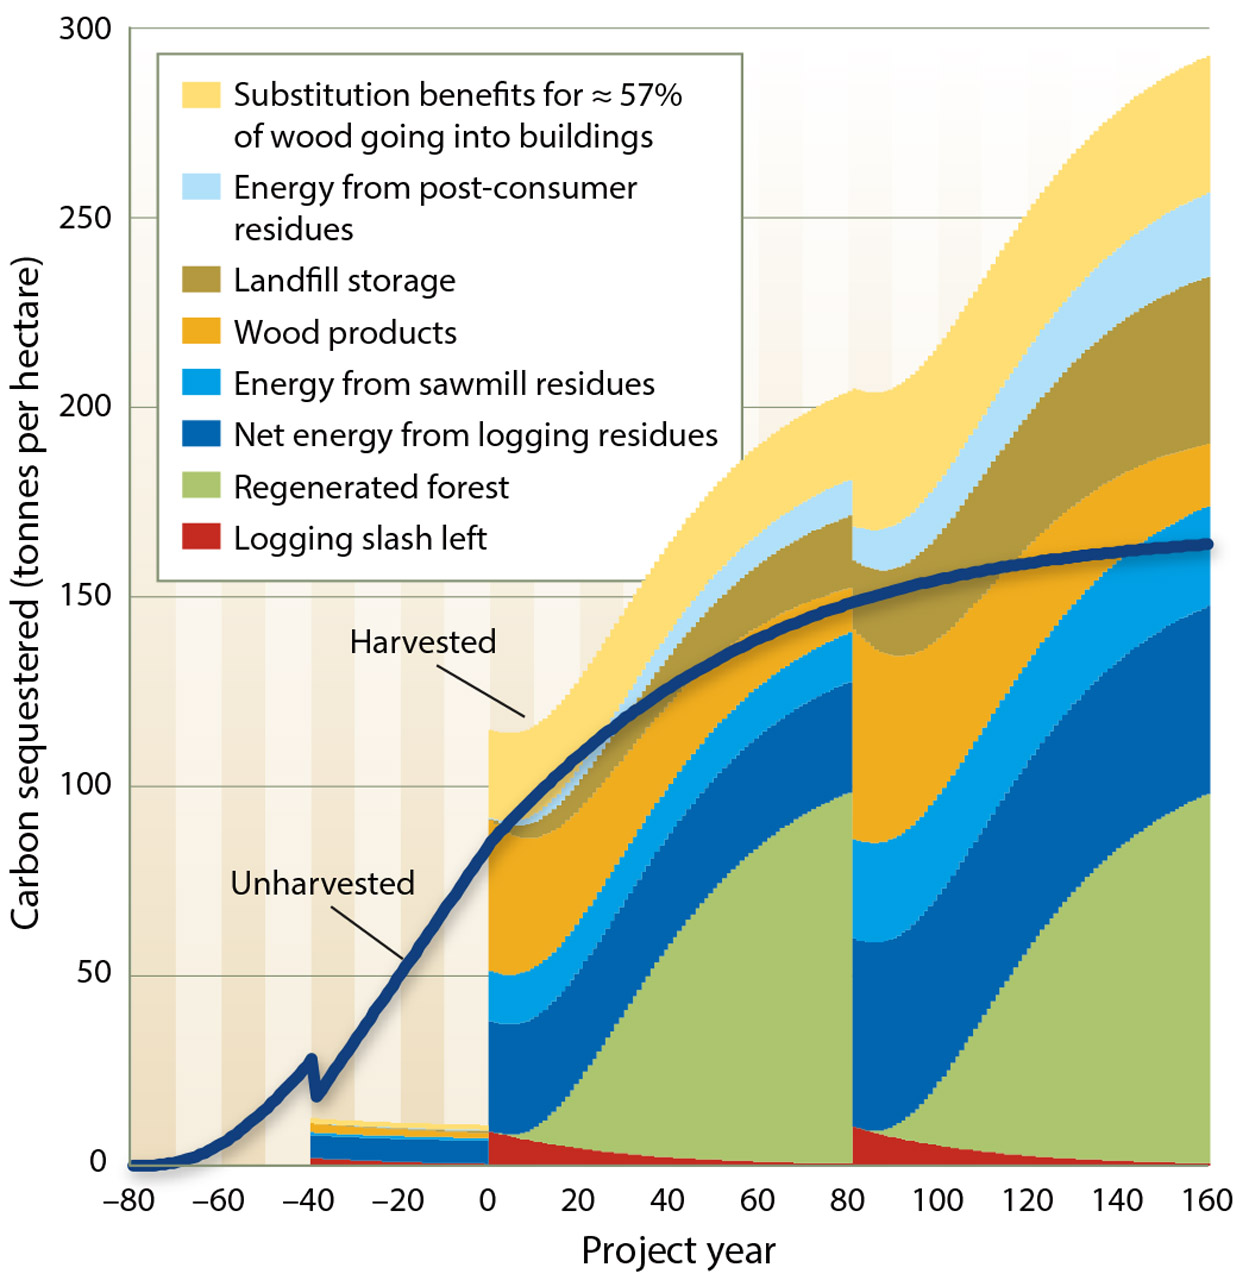
Fig. 1. Cumulative sequestration benefits over time from 1 hectare of a mixed-conifer forest under two scenarios: unharvested (or let-grow), and even-aged harvest and regeneration with 75% of slash (logging residues) used for energy at a harvest at year 0. The life cycle includes the 80 years since the forest started from seedlings as well as two cycles of harvesting and replanting.
Table 2 compares the cumulative carbon sequestration benefits of the two scenarios for 160 years starting from new tree seedlings. The harvested scenario includes a commercial thin at 40 years, a final harvest at 80 years, and regeneration of the forest for 80 more years. The harvested forest has lower average sequestration benefits in the live trees but greater overall sequestration benefits when the harvested products are considered.
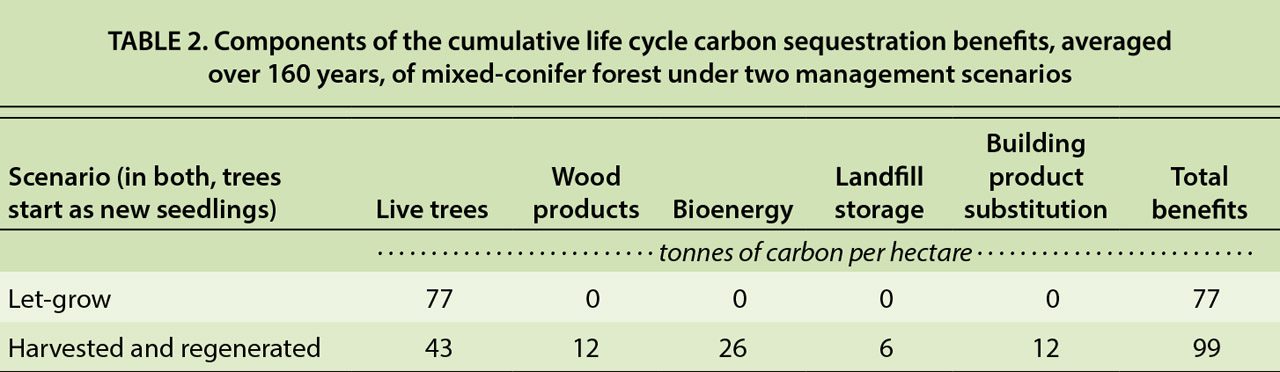
TABLE 2. Components of the cumulative life cycle carbon sequestration benefits, averaged over 160 years, of mixed-conifer forest under two management scenarios
Table 3 summarizes our best practices estimate of annual carbon sequestration rates for four forest types, five management options and three time periods. The more productive redwood and Douglas fir forests sequester considerably more carbon than the mixed-conifer and ponderosa pine forests. Efficient utilization of harvested products increases overall sequestration benefits across all forest types and time periods.

TABLE 3. Cumulative life cycle carbon sequestration benefits, averaged over 120, 160 and 240 years, for four forest types and five management options
More benefits in joint use
Managed (harvested and regenerated) forests provide more carbon sequestration benefits than let-grow forests when the benefits of the harvested products are accounted for. Table 4 summarizes the relative carbon sequestration benefits of let-grow forests and managed forests weighted by the total area of private forests in California. If all carbon sequestration benefits are counted, we project that California's private forests that are harvested and regrown for another 80 years will provide approximately 30% more total carbon sequestration benefits than forests left to grow for 80 years. The relative advantage of the managed forest over the let-grow forest is slightly less for shorter timeframes and slightly greater for longer timeframes. Expanded residue utilization for bioenergy increases total sequestration benefits compared with leaving slash to decompose in the forest. The increased benefits resulting from uneven-aged management systems compared with even-aged management are smaller than the increased benefits related to more slash utilization.
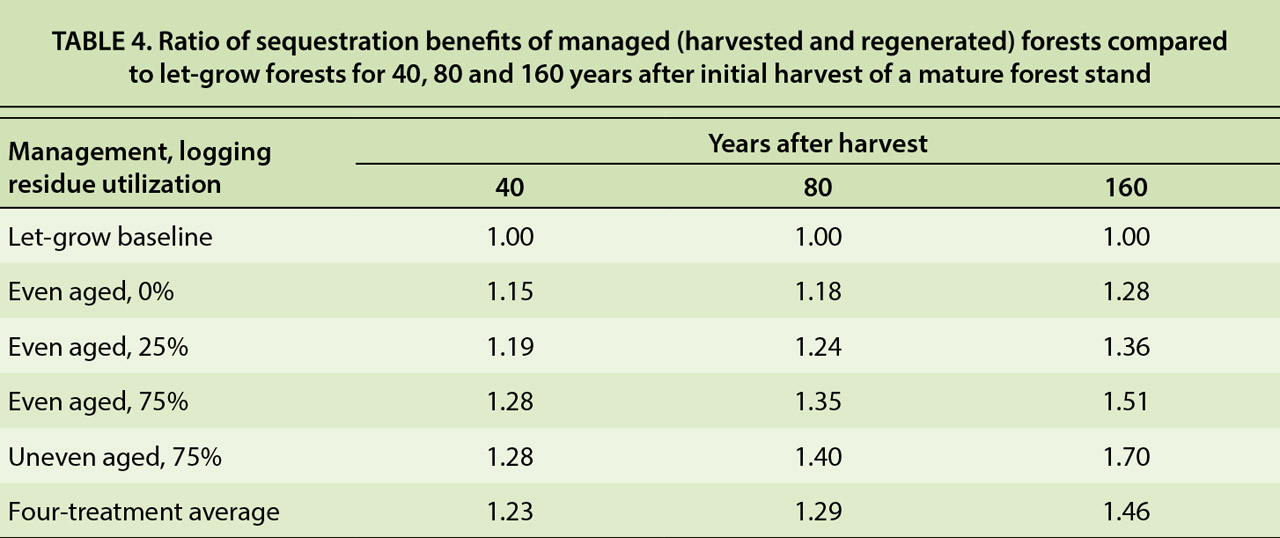
TABLE 4. Ratio of sequestration benefits of managed (harvested and regenerated) forests compared to let-grow forests for 40, 80 and 160 years after initial harvest of a mature forest stand
The carbon calculator helps users understand how forest management options will affect carbon sequestration. It can be used anywhere in the United States where relevant FIA plot data is available. And its assumptions, inputs and coefficients can be changed to match the analytical needs of regulators and submitters. The carbon sequestration categories we presented here match up well with the U.S. Greenhouse Gas Inventory (US EPA 2014) in terms of tracking carbon in live trees, forest products and landfills, and bioenergy. Under the relatively efficient management practices currently used by private forest owners in California and depending on what percentage of logging residues are used for bioenergy, calculations show that a ton of harvested wood provides slightly more or significantly more sequestration benefits than leaving that ton in the forest.
The calculator's simple and transparent format can improve the regulatory review process for forest landowner's compliance with legislation designed to reduce California's greenhouse gas emissions. It is also a useful tool for assessing forest management options in private and federal forests.
Carbon calculator tracks the climate benefits of managed private forests

