


All Issues
Rainfall leaching is critical for long-term use of recycled water in the Salinas Valley
Publication Information
California Agriculture 68(3):75-81. https://doi.org/10.3733/ca.v068n03p75
Published online July 01, 2014
NALT Keywords
Abstract
In 1998, Monterey County Water Recycling Projects began delivering water to 12,000 acres in the northern Salinas Valley. Two years later, an ongoing study began assessing the effects of the recycled water on soil salinity. Eight sites are receiving recycled water and a control site is receiving only well water. In data collected from 2000 to 2012, soil salinity of the 36-inch-deep profile was on average approximately double that of the applied water, suggesting significant leaching from applied water (irrigation) or rainfall. In this study, we investigated some of the soil water hydrology factors possibly controlling the soil salinity results. Using soil water balance modeling, we found that rainfall had more effect on soil salinity than did leaching from irrigation. Increasing applied water usually only correlated significantly with soil salinity parameters in the shallow soil profile (1 to 12 inches depth) and at 24 to 36 inches at sites receiving fairly undiluted recycled water. Winter rains, though, had a critical effect. Increasing rainfall depths were significantly correlated with decreasing soil salinity of the shallow soil at all test sites, though this effect also diminished with increased soil depth. When applied water had high salinity levels, winter rainfall in this area was inadequate to prevent soil salinity from increasing.
Full text
Using recycled wastewater for agriculture and landscaping has environmental benefits because it limits the wastewater discharge into natural waterways while helping to preserve the supply of potable water for human consumption. Recycled water (tertiary-treated wastewater) has been used by a majority of growers in the Monterey County Water Recycling Projects (MCWRP) Salinas Valley area since 1998. An ongoing study, initiated in 2000, is comparing the changes in soil salinity between a field that has received only well water and eight field sites in the MCWRP area that have received recycled water since 1998. Each test site uses a specific blend of recycled water (the fraction ranges from 40% to 90%) and well water for irrigation, allowing assessment of the relative impacts of the water quality on soil salinity parameters.

In a study of Salinas Valley fields irrigated with recycled wastewater, researchers found that rainfall leaching is an important factor in maintaining satisfactory root zone salinity levels for salt-sensitive crops such as lettuce and strawberries.
Recently, a feasibility study of the use of recycled water for vineyard irrigation in the Carneros and Milliken-Sarco-Tulocay (MST) regions near Napa indicated that leaching by winter rains averaging more than 20 inches a year was sufficient to maintain soil salinity, sodium (Na) and chloride (Cl) levels within acceptable ranges for grape production (Weber et al. 2014; page 59 , this issue). Winter rainfall is about 13 inches a year in the MCWRP area, and our goal in this study was to ascertain the effectiveness of irrigation leaching compared with rainfall leaching.
Overall, the average soil salinity parameters — electrical conductivity (ECe), Na, Cl and sodium adsorption ratio (SAR) — at the test sites were highly correlated with the average recycled water quality values, as we describe in our other article on this study (Platts and Grismer 2014; page 68 , this issue). At the same time, with the exception of two sites (1 and 7), average soil salinity parameter values remained roughly constant from one year to the next, suggesting the possibility of relatively steady-state leaching of the soil profile to a depth of 36 inches (i.e., on an annual basis the amount of salt added with irrigation is roughly equal to the amount leaving the bottom of the root zone).
Assuming that strawberry production is the most sensitive to soil Cl concentrations, the irrigation leaching requirement predicted from an annual salt balance consideration using the fairly undiluted recycled water (Cl at 7 meq/L [milliequivalents per liter]) for irrigation would be about 23% as compared to about 5% for well water with Cl at about 1.5 meq/L. However, it was not clear from initial water quality analyses whether the differences in soil salinity parameters between the periods 2000–2009 and 2010–2012 were the result of irrigation alone, irrigation and rainfall, or rainfall alone.
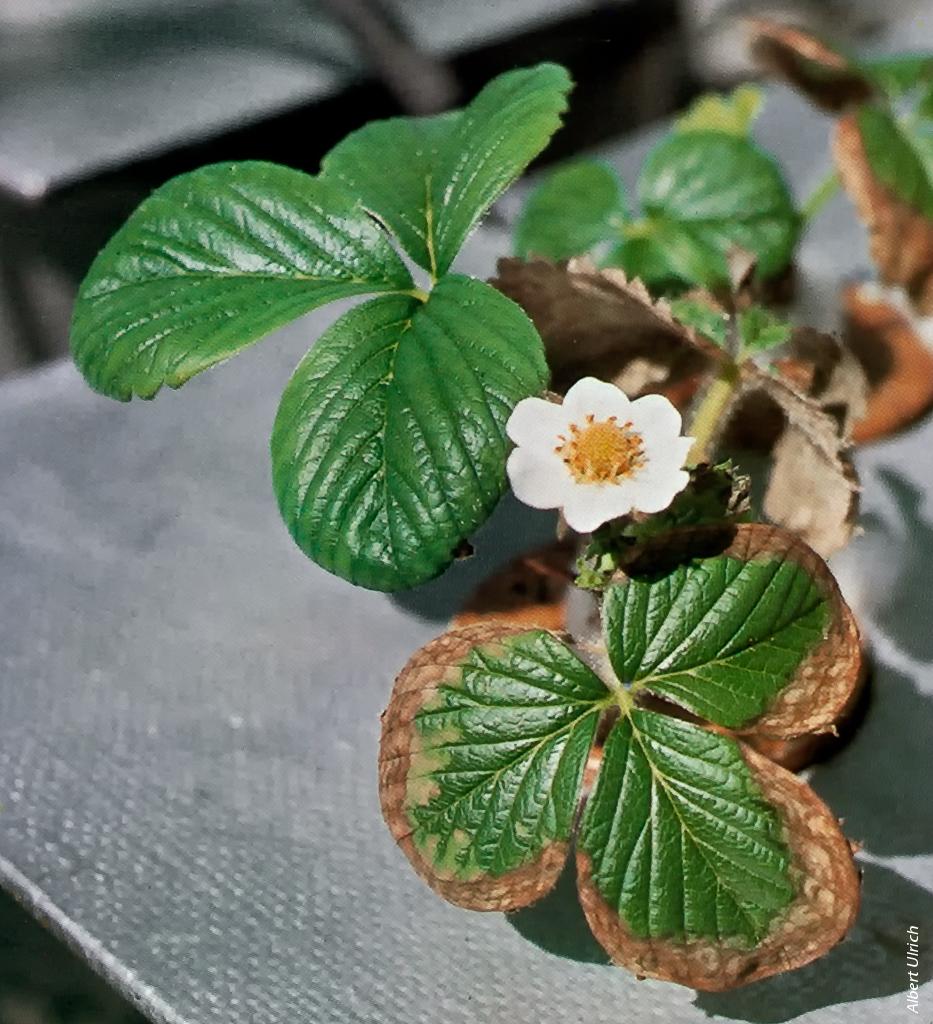
Toxic levels of salt cause strawberry leaf margins to turn brown and dry.
Distinguishing the soil water hydrologic factors controlling this apparent steady-state leaching situation (Grismer 1990) is critical for developing long-term sustainable recycled water use strategies in the region. To this end, we developed a root zone soil water balance model to determine the deep percolation from applied water (irrigation) and rainfall between soil sampling dates for comparison with changes in soil profile salinity parameters that occurred at the control and test sites.
Root zone leaching processes
For equivalent soil conditions, use of soil amendments and atmospheric dry deposition rates, the root zone salinity of irrigated soils largely depends on the applied water quality (salinity), frequency and duration of irrigation, evapotranspiration (ET) and rainfall depths, presuming adequate root zone drainage. Of course, irrigation usually occurs during the periods of the year with greater ET, resulting in a concentration of applied water salinity in the root zone through evaporation and transpiration processes. Irrigations at depths greater than that necessary to meet crop water demands generally occur either because of application inefficiency or for the purpose of leaching the root zone of accumulated salinity.
Generally, the salinity of rainwater is less than that of applied water, and in California deep percolation and leaching of root zone salinity occur during the winter rainy season, when ET rates are generally low. As a result, when there is sufficient rainwater displacement of concentrated applied water in the root zone, a greater decrease in root zone salinity per unit depth of rain is expected than that which would occur from the application of the same depth of more-saline applied water. Management of applied water and rainfall leaching of the soil root zone salinity is especially critical when growing salt-sensitive, high-value crops such as strawberries and leafy greens in the Salinas Valley.
Soil water balance modeling
With knowledge of the crop type, planting and harvest dates, soil type, typical applied water depths and local reference ET and rainfall, a daily root zone water balance can be developed to compute daily irrigation requirements as well as deep percolation (root zone drainage) depths. Water balances have been used to estimate deep percolation rates from desert alfalfa hay production (Bali et al. 2001; Grismer 2012) and from Sonoma County wine grape production (Grismer and Asato 2012) and also to corroborate field-measured soil profile drainage rates for avocado and citrus orchards on the central California coast (Grismer et al. 2000).
Grismer and Asato (2012) provide a detailed description of the general root zone water balance methods that were used here. However, we determined crop water use for the crops grown in the MCWRP region differently because water use changes daily as the crop grows. Water use by artichokes, strawberries, lettuce and cole (broccoli, cauliflower and rapini) crops depends on the relative canopy coverage of the crop, which in turn depends on the overall seasonal reference ET available to grow the crop. For our calculations, we used modified crop coefficient functions that depend on seasonal reference ET, and thus canopy coverage, originally developed by Gallardo et al. (1996), Grattan et al. (1998) and Hanson and Bendixen (2004) for the Salinas Valley region. From the crop season total reference ET and the canopy coverage functions, a daily increasing crop coefficient was determined and used to reduce reference ET to that of the crop ET. Daily rainfall and reference ET for the years 2000 to 2012 were taken as the average of the values from the three California Department of Water Resources CIMIS stations (Watsonville, Castroville and N. Salinas) in the study region.
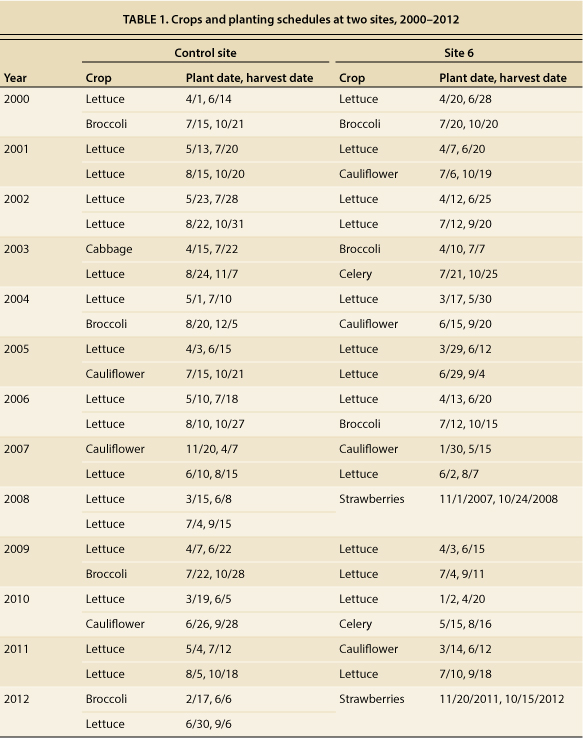
As described in our companion paper (Platts and Grismer 2014; page 68 ), the salinity study involved a control site and eight test sites that had similar soil characteristics, drainage systems, types of crops grown (lettuce, cole crops and strawberries), irrigation method and farming practices. Table 1 presents cropping schedules from the control site and site 6, which are representative of the study sites. Generally, growers followed the management practices described in UC ANR Publications 7211 and 7216 (LeStrange et al. 2011; Smith et al. 2011), with three or four early-season sprinkler irrigations to establish the crops, followed by drip, furrow or additional sprinkler irrigations necessary to bring the crops to harvest.
In our root zone soil water balance modeling, an average 2.0 inches (5.1 centimeters) of water was applied when irrigation was needed to replenish root zone soil moisture levels necessary to meet crop water demands. Rainfall was assumed to be 60% effective as infiltration, and after the three or four initial planting irrigations, additional irrigations were triggered when soil moisture storage declined to less than half of capacity. A 2-inch water application depth is typical of the sprinkler systems used in the region, is greater than that from drip systems, and less than that from furrow irrigation systems. Our seasonal applied water depths ranged toward the low end of those reported for the region (Cahn et al. 2011; M. Cahn, UC Cooperative Extension Monterey County, personal communication) and, as is discussed below, most of the irrigation season deep percolation occurred as a result of the early-season irrigations used to establish the crop. Excess applied water or rainfall beyond that necessary to refill soil root zone water-holding capacity and meet daily crop ET was assumed to become deep percolation, or drainage, from the root zone.
Water and soil sampling, analysis
The recycled water (tertiary effluent from Monterey Regional Water Pollution Control Agency, MRWPCA) was sampled on a weekly basis to determine the levels of salt present in it before blending with the supplemental well water used to meet peak irrigation demand. Monthly delivery system sampling confirmed the quality of the water received by growers after supplemental well water was added to the recycled water. In addition, the quality of the well water delivered to the control site was sampled monthly. The water samples were analyzed for pH, ECw, Na, Mg, Cl and K (potassium) by an accredited laboratory run by MRWPCA.
The sites had Pacheco clay, clay-loam and sandy loam soils and subsurface tile drainage systems. At each site, soil samples were collected from depths of 1 to 12 inches, 12 to 24 inches and 24 to 36 inches at four different locations within 3 feet of a designated global positioning system (GPS) point. Efforts were made to obtain comparable data year to year by collecting soil samples at three specific times in the production cycle: (1) following winter rains and prior to spring planting, (2) mid–growing season, after harvest of the first crop and (3) at the end of the growing season, after the second crop and before winter rains.
Soil samples at the four locations at each site were composited by soil depth. Sample analysis was done by an independent accredited lab (Valley Tech, Tulare, CA) and included pH, ECe, extractable cations B (boron), Ca, Mg, Na and K, and extractable anions Cl, NO3 (nitrate) and SO4 (sulphate).
Control and test site hydrology
Despite the range in crops grown across the control and test sites, the average annual applied water depths ranged only from 22 to 26 inches, with an average of about 24 inches (60 centimeters) for all years, the same for the eight sites as a whole and the control site (table 2). Similarly, applied water deep percolation during the irrigation season ranged from about 15 to 18 inches, with the average amount at the test sites a little over an inch greater than that at the control site. Average rain depths during the irrigation season were more variable, ranging from just over 1 inch to about 4.5 inches, though the average of the test sites was essentially equivalent to that of the control site. Deep percolation leaching from rain between irrigation seasons (i.e., before spring planting) was practically the same at the control site as the average amount at the test sites, about 5.4 inches. The data in table 2 underscores the relative hydrologic similarity of the test sites and the control site, suggesting that reasonable leaching comparisons can be made.

TABLE 2. Average annual hydrologic parameters associated with soil water balance calculations at the control site and eight test sites, 2000–2012
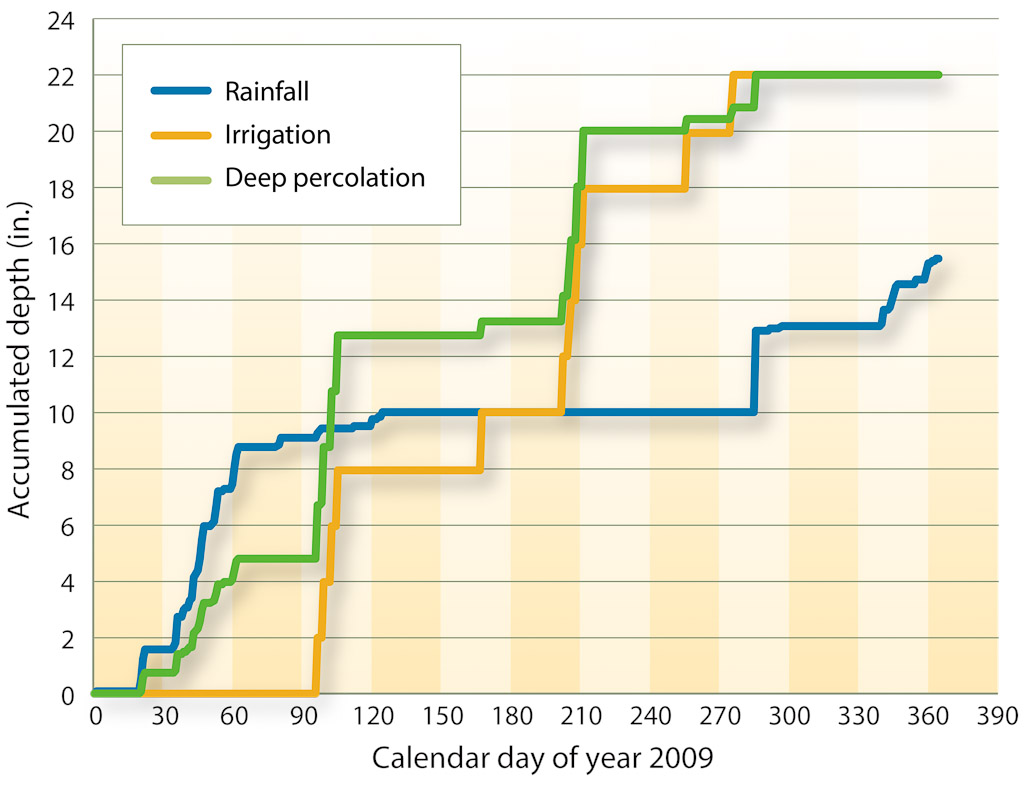
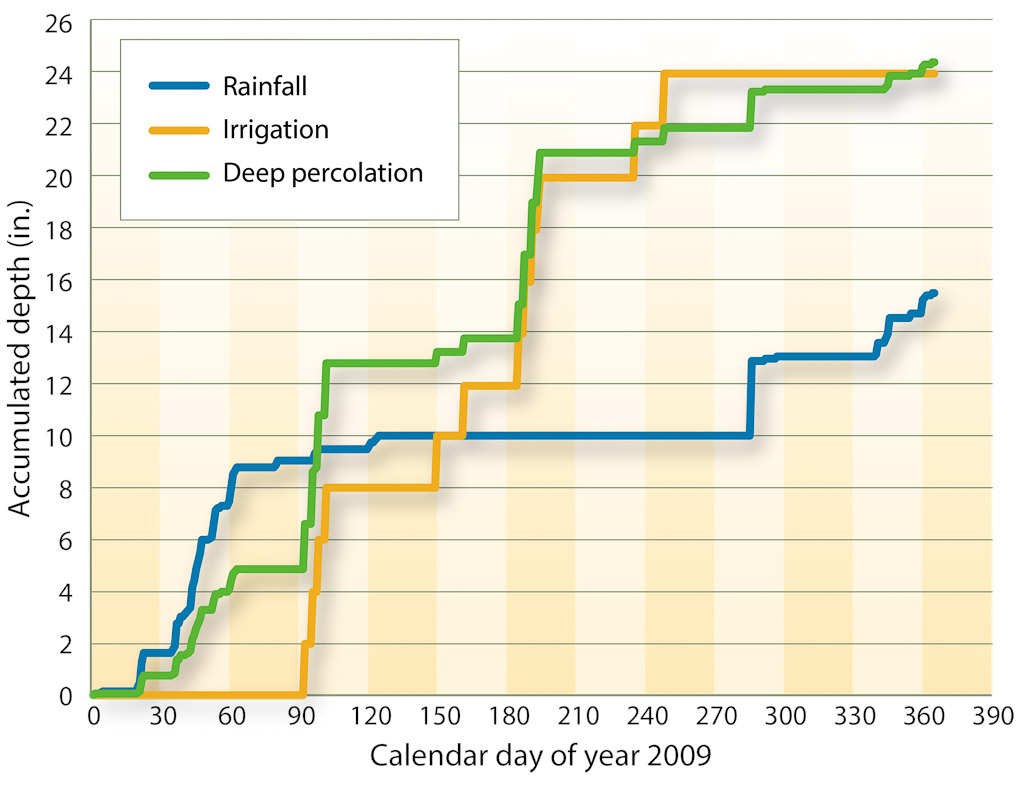
Figures 1 and 2 show the accumulated daily rainfall, applied water and deep percolation at the control site and site 6 during an average ET and rainfall year, 2009. They illustrate the soil water balance modeling processes important for the leaching of soil salinity: At both sites, rainfall recharge incurs soil water deep percolation leaching during the first 2 months of the year and to a lesser extent the last month of the year, whereas applied water recharge, primarily from early-season planting irrigations, is responsible for most of the annual deep percolation leaching during the remainder of the year.
Control and test site salinity
Using daily soil water balance modeling, it was possible at each site to more precisely determine the deep percolation (leaching) from rain, irrigation or a combination of irrigation and rain that occurred between the soil sampling days in early spring, midsummer and late fall. The changes in soil salinity parameters are described in detail in our other article (Platts and Grismer 2014; page 68 , in this issue). As noted there, three of the four primary salinity parameters, Na, Cl and SAR, followed a similar pattern in changes from year to year that contrasted in part with that for EC. As the pairs of parameters — Cl and EC, Na and SAR — are closely related, for brevity here we focus on changes in EC and Na concentrations at each soil depth and the hydrological processes associated with them.
In 2000, soil EC (ECe) and Na concentrations generally increased with increasing depth at all the sites (table 3). The values at sites 2, 3, 4 and 6 were roughly equivalent to those at the control site; at sites 1, 5, 7 and 8, values were much greater. Approximately a decade later, ECe and Na concentrations had increased slightly in the 1 to 12 inches subprofile at the control site and sites 2, 3 and 4, while decreasing at site 6. Changes in the whole profile averages (the sum of the amounts at the three subprofiles) of ECe and Na were mixed at the control site (i.e., there was a slight increase in ECe and a decrease in Na) and site 4 (i.e., an increase in Na and a slight decrease in ECe); at sites 2 and 6, ECe and Na decreased; and at site 5, they increased slightly. At sites 3 and 7, there were relatively larger increases in ECe and Na concentrations in the whole profile after 13 years; and at site 8, substantial decreases occurred in these values after 7 years. Generally, whole profile averages of both ECe and Na increased.
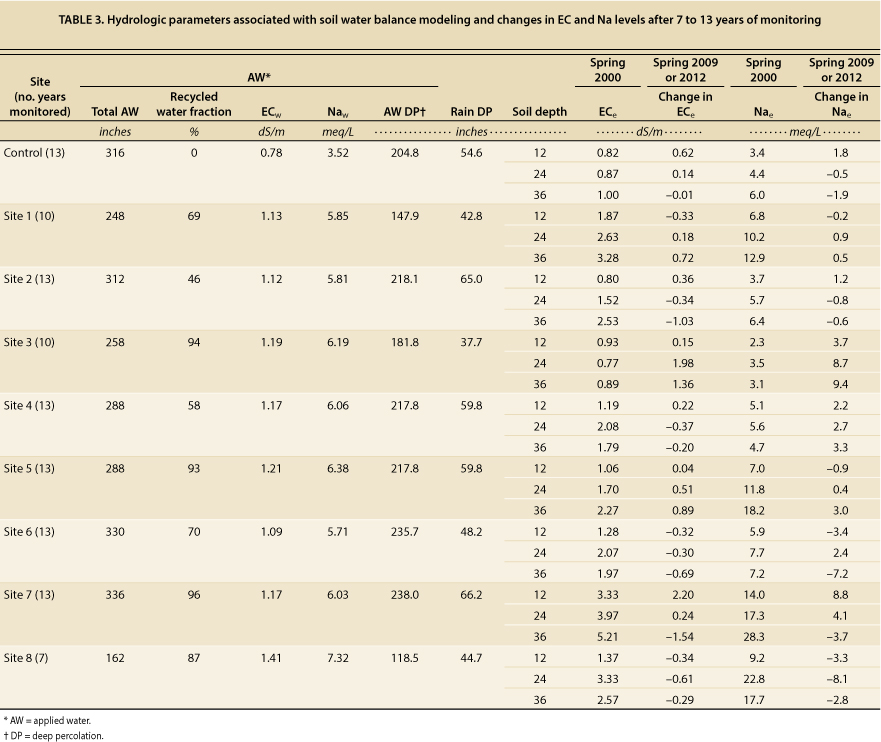
TABLE 3. Hydrologic parameters associated with soil water balance modeling and changes in EC and Na levels after 7 to 13 years of monitoring
Considering the long-term changes in salinity parameters occurring between spring soil sampling in 2000 and spring soil sampling in 2009 or 2012, we found that none of the changes in ECe and Na concentrations at the subprofile or whole profile levels were correlated with the amount of applied water, or the applied water and rain deep percolation depths. This suggested that we needed to do a more detailed (shorter time period) analysis to distinguish differences in leaching effectiveness associated with rain or excess irrigation; the results of that analysis are described below.
Leaching of soil salinity
Using the soil water balance calculations to determine the deep percolation (leaching) from applied water or rainfall between the soil sampling dates (1 to 5 months), we did correlation analyses of the dependence of soil salinity parameter changes at each subprofile on the increasing deep percolation. Deep percolation depths from applied water or rainfall were computed at the control site and each test site at each of the three soil subprofiles, compared with measured changes in soil salinity parameters and tested for significance using the Student's t-distribution.
In many cases, both applied water and rainfall deep percolation occurred between soil sampling periods, and in the first analyses of the 108 correlations possible, 13 correlations were significant at > 95% confidence and 25 at > 90% confidence. Generally, increasing applied water deep percolation was correlated with increasing salinity (positive r value, table 4), whereas increasing rainfall deep percolation was correlated with decreasing salinity (negative r value, table 5).
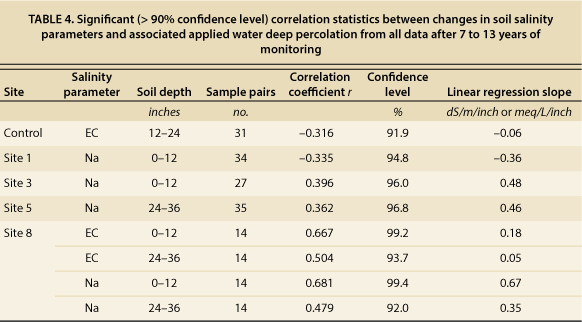
TABLE 4. Significant (> 90% confidence level) correlation statistics between changes in soil salinity parameters and associated applied water deep percolation from all data after 7 to 13 years of monitoring

TABLE 5. Significant (> 90% confidence level) correlation statistics between changes in soil salinity parameters and associated rain deep percolation from all data after 7 to 13 years of monitoring
In the second correlation analyses, which considered the changes in soil salinity that were associated with deep percolation from only applied water or only rainfall (i.e., no combination of both), only 66 comparisons were possible because of the limited frequency of rainfall-only events, so we pooled the rainfall-only events at all the test sites. Of the 66 possible correlations, 14 were significant at > 90%, and of these, eight were significant at > 95% confidence (table 6).
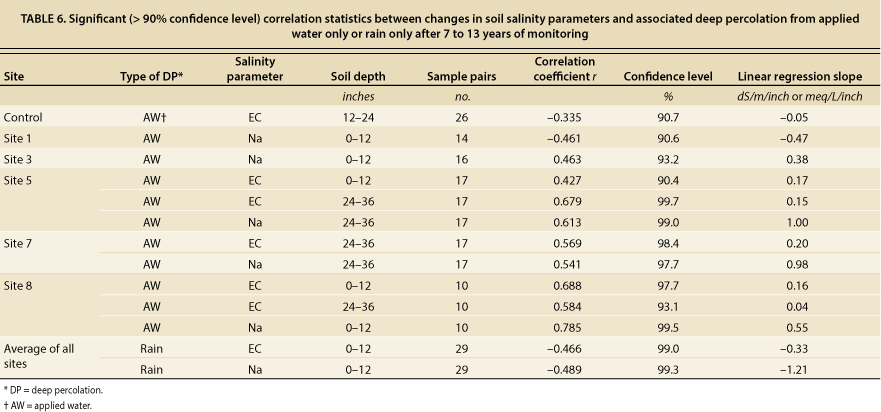
TABLE 6. Significant (> 90% confidence level) correlation statistics between changes in soil salinity parameters and associated deep percolation from applied water only or rain only after 7 to 13 years of monitoring
At the control site and sites 1 and 6, rainfall leaching appeared to displace salinity to the deeper soils (24 to 36 inches), where there was a slight accumulation. At the remaining sites, rainfall leaching decreased soil salinity at different depths depending on the site. Increasing applied water depths tended to increase soil salinity at the test sites, particularly at sites 3, 5 and 8, which received the fairly undiluted recycled water.
No significant correlations between soil salinity and deep percolation from applied water and/or rainfall were found at test sites 2 and 4, where the blending with well water was highest, which supports our observation in our other paper of little salinity accumulation at these sites. The greatest reductions in soil salinity per unit of rainfall deep percolation occurred at sites 5 and 8, where the greatest salinity accumulations from applied water occurred (see last column of table 5). Crop yields from all of the sites appeared to be acceptable with an applied water ECw of 1.1 to 1.2 and Na as high as 6 meq/L, values which are greater than those generally assumed to be suitable. Overall, the correlation analyses underscore the importance of rain-driven soil water leaching for maintaining satisfactory root zone salinity conditions.
Rainfall leaching critical
Comparison of the overall changes in soil salinity parameters from the beginning of soil sampling in spring 2000 to that in 2012 (or 2009 at two sites) yielded mixed results with little clear conclusion possible. However, when we considered the changes occurring between sampling events (1 to 5 months), the effects of rain and irrigation leaching became more apparent. At the control and the test sites, rainfall leaching of salinity was critical for maintaining agronomically acceptable soil salinity parameters in the root zone.
Irrigation leaching of the soil profile at the control site reduced salinity in the near-surface soil depth (1 to 12 inches) but may be resulting in a slight increase in Na concentrations at deeper depths (24 to 36 inches). At the test sites using irrigation water with greater salinity (high amounts of recycled water), despite considerable leaching fractions, irrigation leaching resulted in greater salinity concentrations in the near-surface soils and possible accumulation at deeper levels. Overall, rainfall leaching of the soil profile is critical for the sustained irrigation of the salt-sensitive crops in this area with recycled water of the quality documented in this study, and this should be considered in the water use management strategies of the region.
Citations
Rainfall leaching is critical for long-term use of recycled water in the Salinas Valley

