


All Issues
Vineyard floor management affects soil, plant nutrition, and grape yield and quality
Publication Information
California Agriculture 62(4):184-190. https://doi.org/10.3733/ca.v062n04p184
Published October 01, 2008
PDF | Citation | Permissions
Abstract
Management of the vineyard floor affects soil and crop productivity, as well as runoff and sediment that leave the vineyard. In Monterey County, weed control is typically conducted in a 4-foot-wide area under the vines, while cover crops are planted in the middles between vine rows. This 5-year multidisciplinary study in a low rainfall vineyard evaluated the impact of weed control strategies (cultivation, pre-emergence and post-emergence herbicides) in the vine rows, factorially arranged with three cover-crop treatments in the middles. We studied soil compaction, moisture and runoff; vine and soil nutrition; soil microbial biomass and mycorrhizae; and grape yield and quality. The late-maturing 'Trios 102' triticale used more water during the vine growing season than the earlier maturing 'Merced' rye. Cover crops increased organic matter and microbial biomass in the middles and reduced sediment loss. Weed control treatments did not affect crop yield or soil nutritional and microbiological parameters, but cultivation increased soil compaction at 4 to 7 inches deep. Weed control strategies and cover crops must be chosen carefully to maximize benefits and minimize negative environmental impacts.
Full text
Vineyard-floor management strategies, such as weed control and cover-cropping, have wide-ranging impacts both inside the vineyard, in terms of crop management and productivity, and outside the vineyard, in terms of runoff and sediment movement into streams and rivers. The increasing importance of water-quality issues statewide, including in Monterey County where the Salinas River drains into the Monterey Bay National Marine Sanctuary, highlights the need for management strategies that limit environmental impacts. Growers are interested in alternative weed-control practices and cover crops, but they need information in order to balance benefits with the economic realities of wine-grape production. We established a 5-year experiment in a commercial vineyard in Monterey County with the intent of identifying effective practices that can be integrated into the cropping system without negatively affecting wine-grape production.
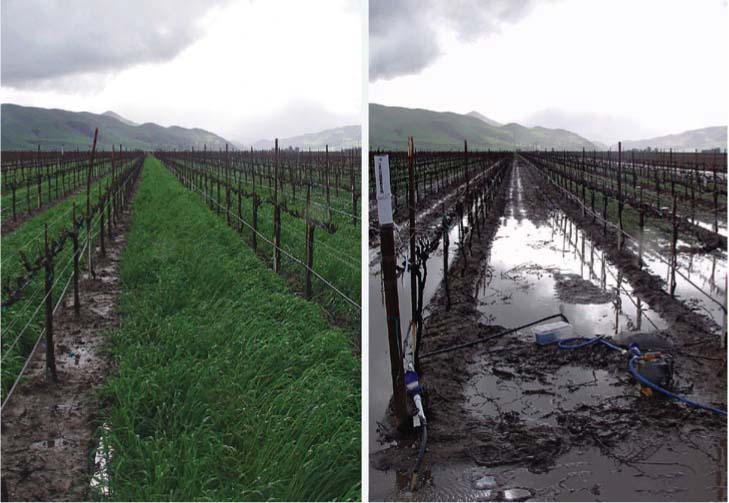
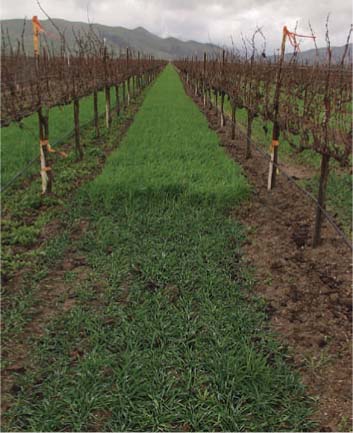
Cover crops can help reduce runoff from vineyards into nearby surface waters, and they protect soil from erosion and nutrient loss. Left, a cover-cropped Monterey County vineyard middle planted with 'Merced' rye; right, with no cover crop following a winter rain.
The vineyard floor consists of two zones: (1) the rows, a 2- to 4-foot-wide swath underneath the vines, which are managed primarily to control weeds by herbicide applications or cultural practices (e.g., mechanical cultivation); and (2) the middles, interspersed between the rows, which are vegetated by cover crops or resident vegetation in the dormant season, and are tilled or left untilled in spring.
Growers manage weeds in rows to reduce competition for water, nutrients and light (Hembree et al. 2006), and to prevent tall-statured weeds such as horseweed (Conyza canadensis L. Cronq.) (Shrestha et al. 2007) from growing or climbing into the canopy, where they interfere with harvest. Growers transitioning to more sustainable production systems need information on how management practices affect the physical properties, health, organic matter and water retention of soil. We monitored soil microbial activity for arbuscular mycorrhizal fungi (AMF) and soil microbial biomass, since weed control and cover-cropping can affect populations of beneficial soil microbes in annual crops (Kabir and Koide 2002).
Dormant-season cover crops in the middles minimize runoff from winter rains (McGourty and Christensen 1998). Many California growers are also willing to plant cover crops because they protect soil from nutrient and sediment loss in winter storms (Bettiga et al. 2006), suppress weeds (Lanini and Bendixen 1992), harbor beneficial arthropods (Costello and Daane 1998), enhance vine mineral nutrition (Patrick et al. 2004) and increase soil organic matter (Ingels et al. 2005).
Competition between vines and cover crops for soil moisture in spring, when both are actively growing, can lead to severe water stress and reduce grape production (Tesic et al. 2007). However, wine-grape production is distinct from other cropping systems (i. e., agronomic crops) because water stress may be imposed to enhance wine composition (Matthews et al. 1990); this practice has been studied mostly in high-rainfall regions of California. The vineyard production region of Monterey County, in contrast, has low rainfall (< 10 inches annually), and growers must weigh the benefits of cover crops with the possible need to replace their water use with irrigation.
In addition, growers must decide on the type of vegetation to utilize in the middles. Resident vegetation is cheap and generally easy to manage. Cover crops can provide specific benefits such as nitrogen fixation (i. e., legumes) or high biomass production and vigorous roots (i. e., cereals). There are many choices for cover crops in vineyard systems, ranging from perennial and annual grasses, to legumes (Ingels et al. 1998). Each species has strengths and weaknesses, as well as associated seed and management costs.
Five-year study in Monterey County
Research site.The trial was initiated in late fall 2000 in a drip-irrigated vineyard near Greenfield, Calif., and continued through the 2005 harvest. The vineyard was established in 1996 with Vitis vinifera L. cv. Chardonnay on Teleki 5C (V. berlandieri Planch. × V. riparia Michx.) rootstock. Vine spacing was 8 feet between rows and 6 feet within rows. Annual rainfall normally ranges from 4 to 10 inches. Soil is elder loam with gravelly substratum. The vineyard was drip-irrigated from April to October.
Experimental design.Row weed control treatments were: (1) cultivation, (2) post-emergence weed control only (glyphosate at 2.0% by volume [v/v] plus oxyfluorfen at 1.0% v/v) and (3) pre-emergence herbicide (simazine at 1.8 pounds active ingredient/acre [a.i./ acre] plus oxyfluorfen at 1.0 pounds a.i./acre), followed by post-emergence herbicide applications (glyphosate at 2.0% v/v plus oxyfluorfen at 1.0% v/v). Cultivations and herbicide applications were timed according to grower practices and label rates.
Cultivations were carried out every 4 to 6 weeks during the growing season using a Radius Weeder cultivator (Clemens and Company, Wittlich, Germany). The cultivator used a metal knife that ran 2 to 6 inches below the soil surface cutting weeds off in the vine row; it had a sensor that caused it to swing around vines. Pre-emergence herbicides were applied in winter with a standard weed sprayer, and postemergence herbicides were applied in spring through fall as needed with a Patchen Weedseeker light-activated sprayer (NTech Industries, Ukiah, CA).
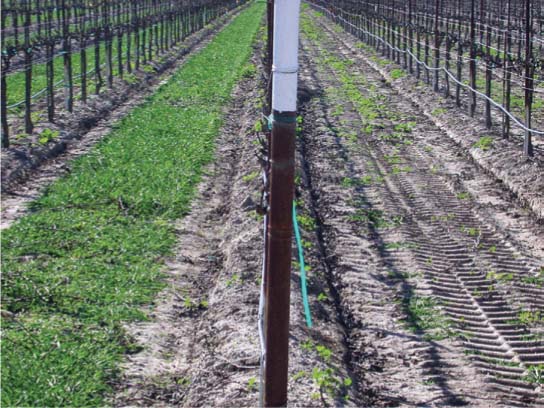
(Left) Trios 102' was compared with (right) bare ground and ‘Merced’ rye (not shown). The treatments were evaluated for soil qualities; vine nutrients and growth; and grape yield and quality.
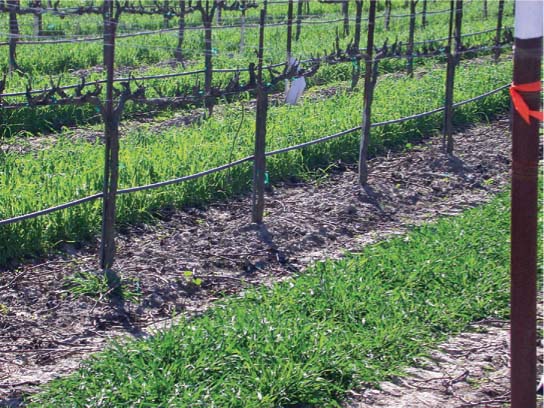
The ‘Merced’ rye cover crop (back) grew faster from December to March, while ‘Trios 102’ (foreground) grew slowly early in the season but vigorously from March to May.
An early and late-maturing cereal were chosen for the cover-crop treatments; legumes were not considered due to aggravated gopher and weed problems. Cover-crop treatments in the middles were: (1) no cover crop (bare ground), (2) earlier maturing ‘Merced’ rye (Secale cereale L.) and (3) later maturing ‘Trios 102’ triticale (X Triticosecale Wittm. Ex A. Camus). Cover crops were planted with a vineyard seed drill in a 32-inch-wide strip in the middle of 8-foot-wide rows just before the start of the rainy season in November 2000 to 2004 (narrow cover-crop strips are used in Monterey County to minimize competition for water). They were mowed in spring to protect vines from frost, and both cover-crop species senesced by summer. Prior to planting cover crops each November, row middles were disked to incorporate the previous year's cover crop and stubble and prepare a seedbed. Periodic spring and summer disking kept bare-ground middles free of weeds.

Fig. 1 Soil compaction under vine rows in 2005. Soil compaction with cultivation was significantly greater than the post-emergence and pre-emergence treatments at 4 to 7 inches (P = 0.0206) and significantly greater than standard weed control at 8 to 11 inches (P = 0.0087). Means within each depth were statistically significant (P < 0.05) by pairwise t-tests; differences within each depth are indicated by different letters.

Fig. 2 Average soil moisture in vine rows (middles) at 6 to 42 inches during winter 2002–2003 (date-by-cover-crop interaction, P < 0.0001).
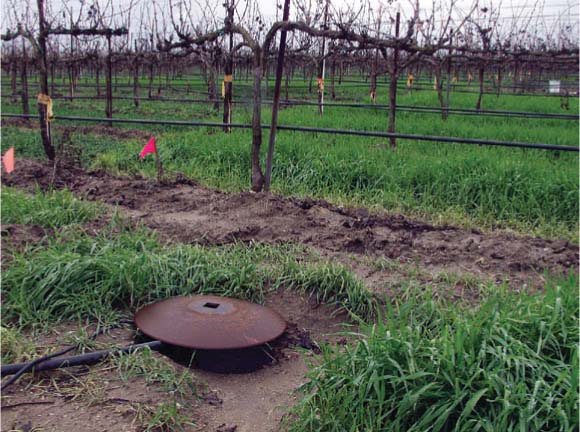
▴ A sump pump was used to monitor runoff from storm events, as well as collect water samples for sediment and nutrient analysis.
The ‘Merced’ rye cover crop (back) grew faster from December through March, while ‘Trios 102’ (foreground) grew slowly early in the season but vigorously from March through May.
Weed control (in-row, main plot) and cover-crop (middles, subplot) treatments were arranged in a 3 × 3 splitblock design with three replicate blocks covering a total of 23 vineyard rows (7 acres). Each block contained six vine rows and six adjacent middles. Weed control treatments were applied along the entire length of each vine row (300 vines); cover-crop treatments were established along one-third of each middle and were continuous across the main plot treatments in each block. Each replicate main plot-by-subplot treatment combination included 100 vines.
Soil and crop evaluations
Soil compaction.Soil compaction was measured in the vine row in November or December 2003, 2004 and 2005 with a Field Scout Soil SC-900 compaction meter (Spectrum Technologies, USA). Ten sites in each plot were sampled to a depth of 15 inches.
Soil moisture.Soil water storage was evaluated from volumetric soil moisture measurements taken in-row and adjacent middles to a depth of 3.5 feet at 1-foot intervals using a neutron probe. The neutron probe readings were calibrated with volumetric moisture measured from undisturbed soil cores collected at the site.
Rainfall and runoff.A tipping bucket rain gauge with an 8-inch-diameter collector was used to monitor daily and cumulative rainfall at the field site. Runoff was collected at the lower end of the plots into sumps measuring 16 inches in diameter by 5 feet deep. Each sump was equipped with a device constructed from a marine bilge pump, a float switch and flow meter, to automatically record the runoff volume from the plots during storm events. During the second and third years the sampling devices were modified to collect water samples for sediment and nutrient analysis.
Vine mineral nutrition.One-hundred whole leaves opposite a fruit cluster were collected from each plot at flowering in May 2003, 2004 and 2005. Petioles were separated from leaf blades, and tissue was immediately dried at 140°F for 48 hours and then sent to the ANR Analytical Laboratory for nutrient analyses. Petiole and leaf-blade tissue samples were analyzed for nitrate (N03), ammonium (NH4), nitrogen (N), phosphorus (P), potassium (K), sulfur (S), calcium (Ca), magnesium (Mg), boron (B), zinc (Zn), manganese (Mn), iron (Fe) and copper (Cu).
Soil mineral nutrition.Composited samples from 10 soil cores taken to a depth of 1 foot were collected from the vine rows and middles at flowering as described above. Samples were airdried and sent to the ANR Analytical Laboratory for analyses. Soil samples were analyzed for pH, organic matter, cation exchange capacity (CEC), nitrate, Olsen-phosphorus, potassium, calcium, magnesium, sodium (Na), chloride (Cl), boron and zinc.
Soil microbial biomass.Due to the limited capacity of the laboratory, microbial biomass assays were conducted on selected treatments. Ten soil cores were collected to a depth of 1 foot and then composite samples were made from each replicate of the pre-emergence and cultivation weed-control treatments and the adjacent middles of the ‘Merced’ rye and bare treatments. Samples were collected about four times each year (each season) from November 2001 to November 2005 for a total of 14 sets of samples. Soil samples were immediately placed on ice and taken to the laboratory for soil microbial biomass carbon (C) analysis according Vance et al. (1987).
Mycorrhizae.Roots were collected, stained and examined as previously reported (Baumgartner et al. 2005) on April 16, 2003, May 3, 2004, and June 2, 2005.
Grape yield, fruit quality and vine growth.Fruit weight and cluster number were determined by individually harvesting 20 vines per subplot. Prior to harvest a 200-berry sample was collected from each subplot for berry weight and fruit composition. Berries were macerated in a blender and the filtered juice analyzed for soluble solids as Brix using a hand-held, temperature-compensating refractometer. Juice pH was measured by pH meter and titratable acidity by titration with a 0.133 normal sodium hydroxide to an 8.20 pH endpoint. At dormancy, shoot number and pruning weights were measured from the same 20 vines.
Statistical analysis.Analyses of variance (ANOVAs) were used to test the effects of cover crop, weed control and year on the vine, soil and microbial parameters, according to a split-block ANOVA model in SAS (SAS Institute, Ver. 9.1, Cary, NC). Cover crop, weed control, year and their interactions were treated as fixed effects. The main and interactive effects of block were treated as random effects. Year was treated as a repeated measure. When necessary, data were log-transformed to meet the assumption of normality for ANOVA, although untransformed or reversetransformed means are presented. Changes in soil moisture among treatments during the winter and the irrigation seasons were determined from significant treatment-date interactions.
Compaction evaluation
We conducted evaluations with a penetrometer each fall to determine the impact of weed-control treatments on soil compaction. Soil compaction was not significantly different at any depth in 2003 (P > 0.420 for all depths). However, in 2004 and 2005 soil compaction began to increase in the cultivation treatment compared to the other two weed-control treatments. In 2004, soil compaction at the 4- to 7-inch depth was significantly greater in the cultivation treatment compared to the standard treatment (P = 0.0178), but not more so than in the post-emergence treatment (P = 0.0629). In 2005, the cultivation treatment had significantly greater soil compaction at the 4- to 7-inch depth than both the postemergence and standard weed-control treatments (P = 0.0206). At the 8- to 11-inch depth, soil compaction was significantly greater than the standard treatment (P = 0.0087), but not greater than in the post-emergence treatment (P = 0.2884) (fig. 1).
The blade of the cultivator passes through the soil at 2 to 6 inches deep, which may explain why greater soil compaction was measured there. Cultivations often also occurred when the soil was still moist following an irrigation, which may have contributed to the development of compacted layers over time.
Water effects on soil
Moisture.Average, volumetric soil moisture levels at the 6- to 42-inch depth increased after the first rain events of the season, such as in winter 2002–2003 (this season's data are representative of other years in the trial) (fig. 2). Soil moisture declined most rapidly with ‘Merced’ rye in the middles during periods without rainfall each year (P < 0.0001), presumably due to its greater early-season growth and greater potential evapotranspiration, compared to the ‘Trios 102’ triticale. Soil moisture levels were similar between the bare and ‘Trios 102’ triticale treatments until May for all years.
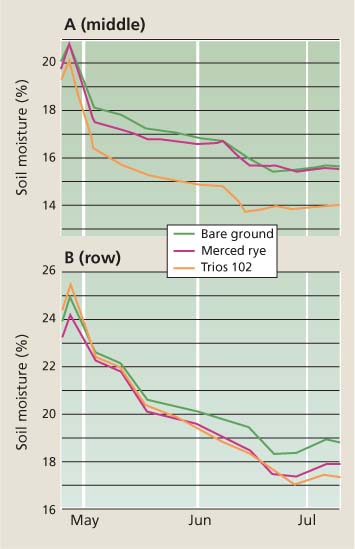
Fig. 3 Average soil moisture at 6 to 42 inches due to cover-crop treatments during the 2004 growing season for (A) middles (P = 0.09) and (B) rows (P = 0.0003); date-by-cover-crop interaction.
During the irrigation season, average soil moisture levels at the 6- to 42-inch depths were higher in rows than middles. Soil moisture in the rows and middles steadily declined during the irrigation season for all treatments during all years (fig. 3). Moisture levels declined most in middles with 'Trios 102' triticale cover during each irrigation season, presumably due to the later growth of this cover crop (P = 0.09). In addition, the row soil-moisture levels also declined the most adjacent to 'Trios 102' triticale for the 2003 and 2004 irrigation seasons (P = 0.016 and P = 0.0003, respectively), but not during the 2005 irrigation season (P = 0.97).
Runoff.Total precipitation at the field trial was 7.4 inches during the 2002–2003 winter, 7.6 inches during the 2003–2004 winter and 9.9 inches during the 2004–2005 winter. A majority of the runoff was collected during December and January for the 2002–2003 and 2004–2005 winters, and February for the 2003–2004 winter.
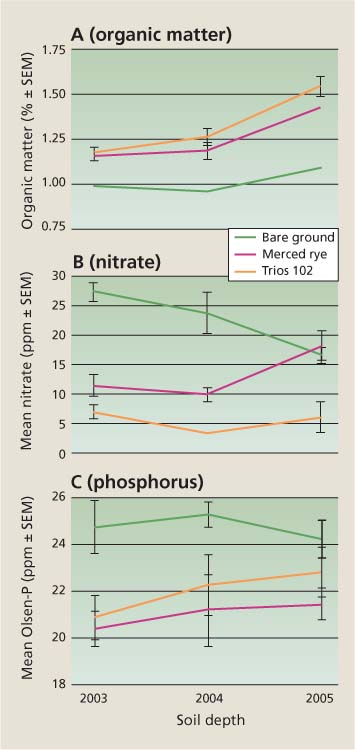
Fig. 4 Levels of (A) soil organic matter (B) nitrate and (C) phosphorus in cover-crop treatments in middles over 3 years. Each point is the mean of three observations and error bars are standard errors of the mean.
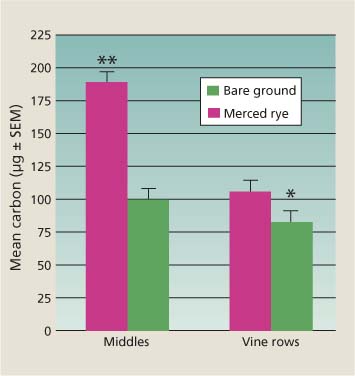
Fig. 5 Cover-crop effects on microbial biomass (ug C/g dry soil ± standard error of the mean) in middles and vine rows at 1-foot deep. In paired t-tests, differences between treatments in middles and vine rows adjacent to rye cover cropped or bare middles were significant (∗ = P < 0.05; ∗∗ = P < 0.0001).
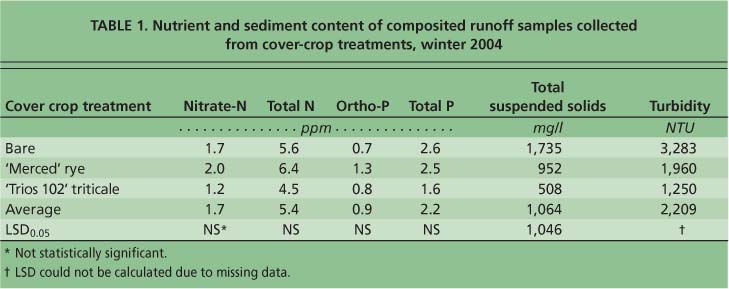
TABLE 1 Nutrient and sediment content of composited runoff samples collected from cover-crop treatments, winter 2004.
Cumulative runoff collected from individual plots during the three winters ranged from 0.02% to 3% of seasonal rainfall. Runoff was usually collected during rain events greater than 1 inch per day. Runoff was highest during the second and third years of the trial. During three consecutive winters, runoff was significantly lower in the cover crop treatments (P = 0.004). 'Trios 102' triticale (38.4 gallon/plot) and 'Merced' rye (96.3 gallon/plot) had significantly less runoff than the bare treatment (177.1 gallon/plot) (P < 0.05).
Suspended sediment (P = 0.07) and turbidity (P = 0.09) were also significantly lower in runoff collected from the cover-crop treatments than in bare middles during winter 2004, but nutrient (ortho-phosphorus, total phosphorus, nitrate-nitrogen and total nitrogen) levels were similar (P > 0.16) among all treatments (table 1).
Nutrient levels
Vines.Weed control and cover treatments did not have any significant effect on the nutritional status of the grape vines as measured by nutrient levels of the leaf petiole tissues, as determined by ANOVA. Although the nutrient levels by year were significantly different, the interactions of weed control-by-cover and weed control-by-cover-by-year were not significant (data not shown).
Weed control and cover treatment also had no significant effect on blade nutrient content with the exception of boron and phosphate (PO4-P) content. Vines adjacent to cover crops had significantly lower boron (P = 0.009) and phosphate (P = 0.02) levels in the leaf blade tissue than vines adjacent to bare row middles. As with the petioles, there was an absence of significance between the interaction of weed control-by-cover and weed control-by-cover-by-year for all nutrients analyzed (data not shown).
Soil cores indicated that most of the vine roots at this site were located under the vine row and few of the roots extended out to the row middles. This root distribution probably occurred because irrigation water was applied under the vines, and low rainfall at the site does not facilitate root growth into row middles. Thus, the lower nutrient levels in vines near cover crops may have been accentuated by irrigation effects that reduced vine root exploration of the soil to a narrow band under the vines. Since cover-crop roots probably grew into this zone there may have been competition between vines and cover crops for some nutrients.
Soil.Cultivated rows had significantly lower levels of nitrate-nitrogen (P = 0.01). Although the nutrient levels by year were significantly different, there was an absence of significance between the interaction of weed control-by-cover and weed control-by-cover-by-year (data not shown). The differences observed in nitrate-nitrogen in the cultivation treatment may be due to the impact of loosening soil on water movement and leaching. Weed control treatments had occasional impacts on soil mineral nutrition in the middles, but results were inconsistent from year to year (data not shown). Cover-crop treatments had no effect on soil nutrients in the rows (data not shown).
The most significant impacts of the vineyard floor treatments were of the cover-crop treatments on soil parameters in the middles. Soil organic matter in cover-cropped middles (‘Merced’ rye and ‘Trios 102’ triticale) was higher (P = 0.0004) than in bare middles each year (fig. 4). Cover crops affected key soil nutrients in the middles; for instance, cover crops greatly reduced nitrate-nitrogen (P = 0.002), and to a lesser extent, extractable phosphorus (P = 0.01) (fig. 4), which may be beneficial in reducing loss of these nutrients in runoff during winter storms, but which also may have reduced the phosphorus content in the vines. In addition, cover crops in the middles also significantly reduced soil boron (P = 0.001), extractable sodium (P = 0.008) and pH (P = 0.03), and increased chloride (P = 0.009) and zinc (P = 0.02) when compared to bare soil.
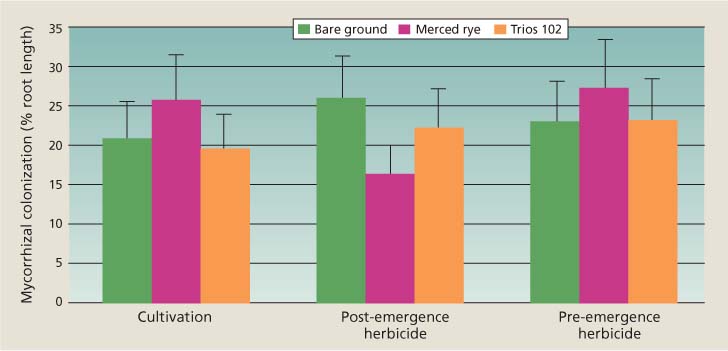
Fig. 6 Interactive effects of cover crop and weed control treatments on mycorrhizal colonization of grapevines, 2003 to 2005. Each column is mean of nine observations, averaged over all three blocks and all 3 years. Simulation-based t-tests were used for mean comparisons. Error bars are 95% confidence intervals; columns without overlapping confidence intervals are significantly different at P ≤ 0.05.
Soil microbiology
Soil microbial biomass.Microbial biomass varied as a result of both the cover-crop and weed control treatments. In both the middles and vine rows, microbial biomass was higher in rye cover-crop plots compared to bare plots (cover crop-by-sample location, P = 0.0017) (fig. 5). These results confirm earlier observations by Ingels et al. (2005) that microbial biomass carbon was higher in cover-cropped middles compared to bare middles. In the vine rows, microbial biomass was greater in plots adjacent to rye cover-cropped plots compared to bare plots. The effect of cover crops grown in the middles on soil in the vine rows may be due to cover-crop roots or tops extending into the vine rows and their subsequent decomposition, providing a food source for soil microbes.
Microbial biomass varied between the weed treatments in the vine rows (P = 0.0453) but not middles (P = 0.1540). In the vine rows, microbial biomass was significantly higher in the cultivation plots (105.95 ± 7.68 micrograms carbon per gram [ug/g C] of soil) compared to the pre-emergence weed control plots (82.08 ± 8.04 ug/g C). The most likely explanation is the incorporation of greater amounts of weed-derived carbon into the surface soil of the cultivated plots.
Mycorrhizae.AMF can benefit grapevines by improving the nutritional status of the plant and producing a highly branched root system. We quantified AMF reproductive structures (propagules) in grapevine roots to determine if the weed control treatments in the rows and/or cover-crop treatments in the middles had significant effects on mycorrhizal colonization from 2003 through 2005. Based on ANOVA, the effects of weed control on colonization were not consistent among cover-crop treatments (interactive effect of weed control-by-cover crop, P = 0.04). Grapevines adjacent to ‘Merced’ rye had higher colonization compared to those adjacent to ‘Trios 102’ triticale or bare ground, in both the cultivation and pre-emergence treatments (fig. 6).
In contrast, grapevines in the post-emergence treatment had the lowest colonization when adjacent to ‘Merced’ rye. These findings were consistent in each study year, based on the absence of significant main or interactive effects of time (data not shown). It is possible that low colonization of grapevines in the post-emergence-by-‘Merced’ rye treatment is associated with this treatment's weed community. Indeed, weed species vary in their ability to host AMF (e.g., mustards are not mycorrhizal), so their presence or absence may affect mycorrhizal colonization of grapevines. Indeed, reports on the influence of plant community composition on AMF suggest that plant diversity has a strong effect on AMF diversity (Johnson et al. 2004), and this may affect the colonization of individual plant species.
Grape yield and quality
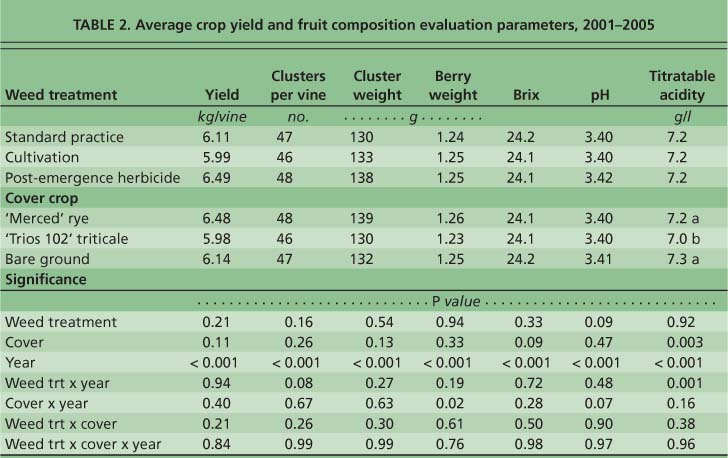
All yield, fruit quality and vine growth parameters varied by year, and this was the only significant effect for these parameters, with the exception of berry weight and titratable acidity (tables 2 and 3). No differences in crop yield or fruit composition were observed from 2001 to 2005 due to weed control treatments (table 2). Cover-crop treatments also had no significant effect on yield or fruit composition, although in 2001 and 2004, there was a reduction in berry size in the ‘Trios 102’ triticale treatment.
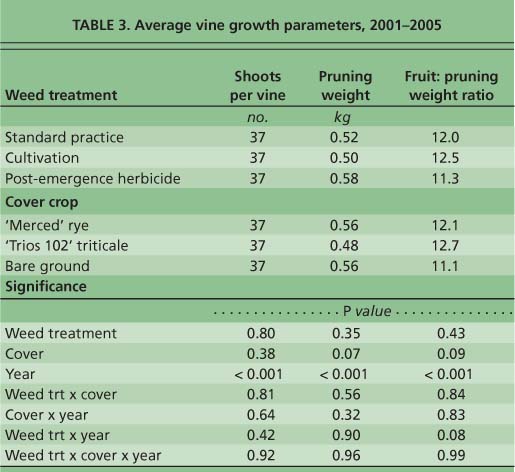
Weed control treatments also had no effect on vine growth (table 3), based on shoot counts and pruning weights taken at dormancy. Cover-crop treatments had no significant effect on vine growth when averaged over 5 years, although in 2001 and 2005 the ‘Trios 102’ triticale treatment significantly reduced pruning weights. The trend for lower pruning weights may be related to the greater decline in soil moisture in the middles where this cover crop was used. It appears that vine growth, yield and grape quality are more significantly affected by annual precipitation than by vineyard floor management practices.
Choosing the right cover crop
In low rainfall areas the choice of cover crop is critical because of its effect on available soil moisture. We observed that late-maturing ‘Trios 102’ used more soil moisture during the vine growing season; if irrigation water does not compensate for water used by the cover crop, reduced vine growth and yield losses may result. The clear benefits of cover crops were increased organic matter in the middles and reduced sediment loss.
Microbial biomass was increased in cover-cropped middles and there were indications that this effect extended to under the vines. Although there were no negative impacts of weed control treatments on vine productivity, we observed increased compaction over time from the use of cultivation. This study indicated that the choice of weed control strategy and cover crop must be carefully considered to maximize the benefits and minimize negative impacts of the practices. The benefits of cover crops are concentrated in the middles, and future research should focus on evaluating practices that improve the quality of soil under the vines.
Vineyard floor management affects soil, plant nutrition, and grape yield and quality

